

Never miss an important update on your stock portfolio and cut through the noise. Over 7 million investors trust Simply Wall St to stay informed where it matters for FREE.
If you are wondering whether Rheinmetall’s share price still reflects fair value after its strong multi year run, this article will walk through what the current numbers actually say.
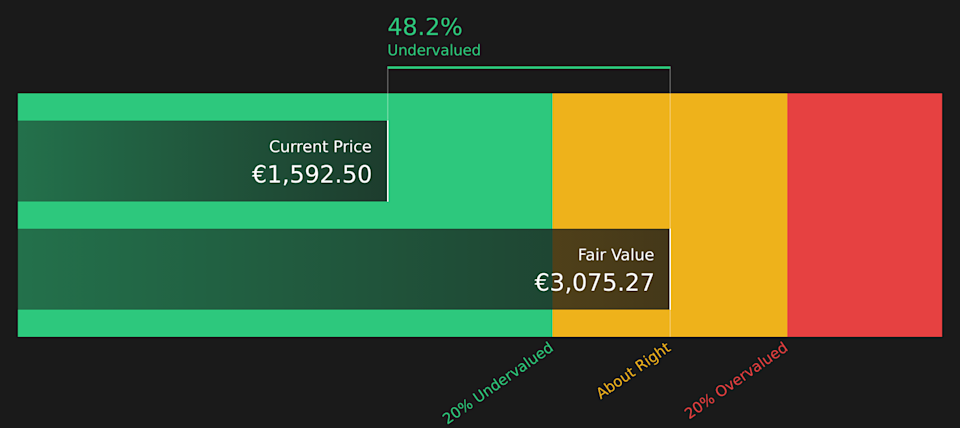
Rheinmetall’s stock closed at €1,592.50, with a flat 7 day return, a 1% decline over 30 days, a 0.6% decline year to date, and a 16.9% return over the past year, alongside a very large 3 year gain and an increase of more than 19x over 5 years.
Recent news coverage has focused heavily on Rheinmetall’s role in defense and security supply chains, with attention on contracts and orders that relate to European rearmament and support for Ukraine. Headlines have also highlighted the company’s growing profile in ammunition and vehicle production, which many investors link to changes in perceived risk and future demand.
Against this backdrop, Rheinmetall has a value score of 3/6, which means it screens as undervalued on half of the checks we run. We will look next at what traditional valuation methods say about that score and why a broader way of thinking about value could be even more useful by the end of this article.
A Discounted Cash Flow, or DCF, model takes estimates of the cash a company could generate in the future and discounts those amounts back to today, to arrive at an estimate of what the business might be worth right now.
For Rheinmetall, the model used is a 2 stage Free Cash Flow to Equity approach. The latest twelve month free cash flow is €1.49b. Analyst estimates and Simply Wall St extrapolations then project free cash flow out to 2035, with the 2030 estimate at €4.53b. The interim projections for 2026 to 2035 are based on a mix of analyst inputs and calculated growth rates.
Using these cash flow projections, discounted back to today, the model arrives at an estimated intrinsic value of €3,085.12 per share. Compared with the recent share price of €1,592.50, this implies a 48.4% discount, which points to the shares screening as undervalued on this DCF view.
Result: UNDERVALUED
Our Discounted Cash Flow (DCF) analysis suggests Rheinmetall is undervalued by 48.4%. Track this in your watchlist or portfolio, or discover 226 more high quality undervalued stocks.
 RHM Discounted Cash Flow as at Mar 2026
For a profitable company like Rheinmetall, the P/E ratio is a useful shorthand for how much investors are paying for each euro of earnings. It ties directly to the bottom line that ultimately supports dividends, buybacks and reinvestment.
What counts as a “normal” P/E usually reflects two things: the growth investors expect from those earnings, and how much risk they see in achieving that growth. Higher expected growth and lower perceived risk tend to go with higher P/E ratios, and the reverse is also true.
Rheinmetall currently trades on a P/E of 71.87x, compared with an Aerospace & Defense industry average of 49.90x and a peer group average of 58.75x. Simply Wall St’s Fair Ratio for Rheinmetall is 62.08x. The Fair Ratio is a proprietary estimate of what P/E might make sense for this specific company, based on factors like its earnings growth profile, industry, profit margins, market cap and risk characteristics. That makes it more tailored than a simple comparison to broad industry or peer averages.
With a current P/E of 71.87x versus a Fair Ratio of 62.08x, Rheinmetall screens as trading above this fair value benchmark.
Result: OVERVALUED
 XTRA:RHM P/E Ratio as at Mar 2026
P/E ratios tell one story, but what if the real opportunity lies elsewhere? Start investing in legacies, not executives. Discover our 98 top founder-led companies.
Earlier we mentioned that there is an even better way to understand valuation, so let us introduce you to Narratives, which are simply your own story about Rheinmetall, linked directly to a set of numbers like future revenue, earnings, margins and a fair value estimate, and then compared in a clear, visual way with the current share price.
On Simply Wall St’s Community page, Narratives let you set out why you think the business looks the way it does, plug those views into a forecast, see the implied fair value, and then quickly tell whether your story points to the shares looking expensive or cheap versus the market price. The Narrative then updates automatically when fresh news or earnings arrive.
For Rheinmetall, one Narrative on the platform currently anchors on a fair value of about €420 per share while another sits above €8,500. This allows you to see in one place how different investors connect the same company to very different assumptions about future orders, defense budgets and profitability, and how they may use that gap between price and fair value to guide their own timing on when to act or stay patient.
For Rheinmetall however, we will make it really easy for you with previews of two leading Rheinmetall Narratives:
Together they show you how the same share price of €1,592.50 can look very different depending on what you believe about future defense spending, margins and how much of that Rheinmetall captures.
On Simply Wall St these Narratives are backed by full forecast tables, fair value models and community comments. What you are seeing here is just the headline version that can help you decide which story feels closer to your own view.
Here is how the most popular bull and bear Narratives line up.
🐂 Rheinmetall Bull Case
Fair value in this Narrative: €7,569.50 per share
Implied undervaluation vs last close: around 79% below this fair value
Implied revenue growth assumption: 64%
Assumes European NATO members lift defense budgets to about 3% of GDP, which the author links to yearly spending of over €500b.
Rheinmetall management comments from March 2025 are taken at face value, with the view that 20% to 25% of this spending could realistically flow to Rheinmetall given its scale.
Sees a path to yearly revenue of over €100b with a 20% profit margin, which feeds into a fair value of more than €7,000 per share, while still flagging risks around asymmetric warfare, production capacity and supply chains.
🐻 Rheinmetall Bear Case
Fair value in this Narrative: €420.00 per share
Implied overvaluation vs last close: around 279% above this fair value
Implied revenue growth assumption: 1.38%
Anchors on a fair value of about €420 per share, framed around Rheinmetall’s position across defense and automotive as defense spending rises.
Highlights demand for armored vehicles, ammunition and auto technology, but ties the fair value to more moderate assumptions for earnings and revenue growth.
Stresses that the timing of any move toward that €420 level is uncertain and depends on factors like macro conditions, geopolitics, contracts and future financial results, so the author avoids attaching a specific year to the target.
These two Narratives sit at opposite ends of the current community range and give you a clear sense of how different assumptions on defense budgets, margins and growth translate into very different fair values.
Once you know which story feels more realistic to you, you can adjust the inputs, build your own version and see in numbers whether your view on Rheinmetall lines up with where the market is pricing the stock today.
Do you think there’s more to the story for Rheinmetall? Head over to our Community to see what others are saying!
XTRA:RHM 1-Year Stock Price Chart
This article by Simply Wall St is general in nature. We provide commentary based on historical data and analyst forecasts only using an unbiased methodology and our articles are not intended to be financial advice. It does not constitute a recommendation to buy or sell any stock, and does not take account of your objectives, or your financial situation. We aim to bring you long-term focused analysis driven by fundamental data. Note that our analysis may not factor in the latest price-sensitive company announcements or qualitative material. Simply Wall St has no position in any stocks mentioned.
Companies discussed in this article include RHM.DE.
Have feedback on this article? Concerned about the content? Get in touch with us directly. Alternatively, email editorial-team@simplywallst.com