
Lycopene extraction and recovery
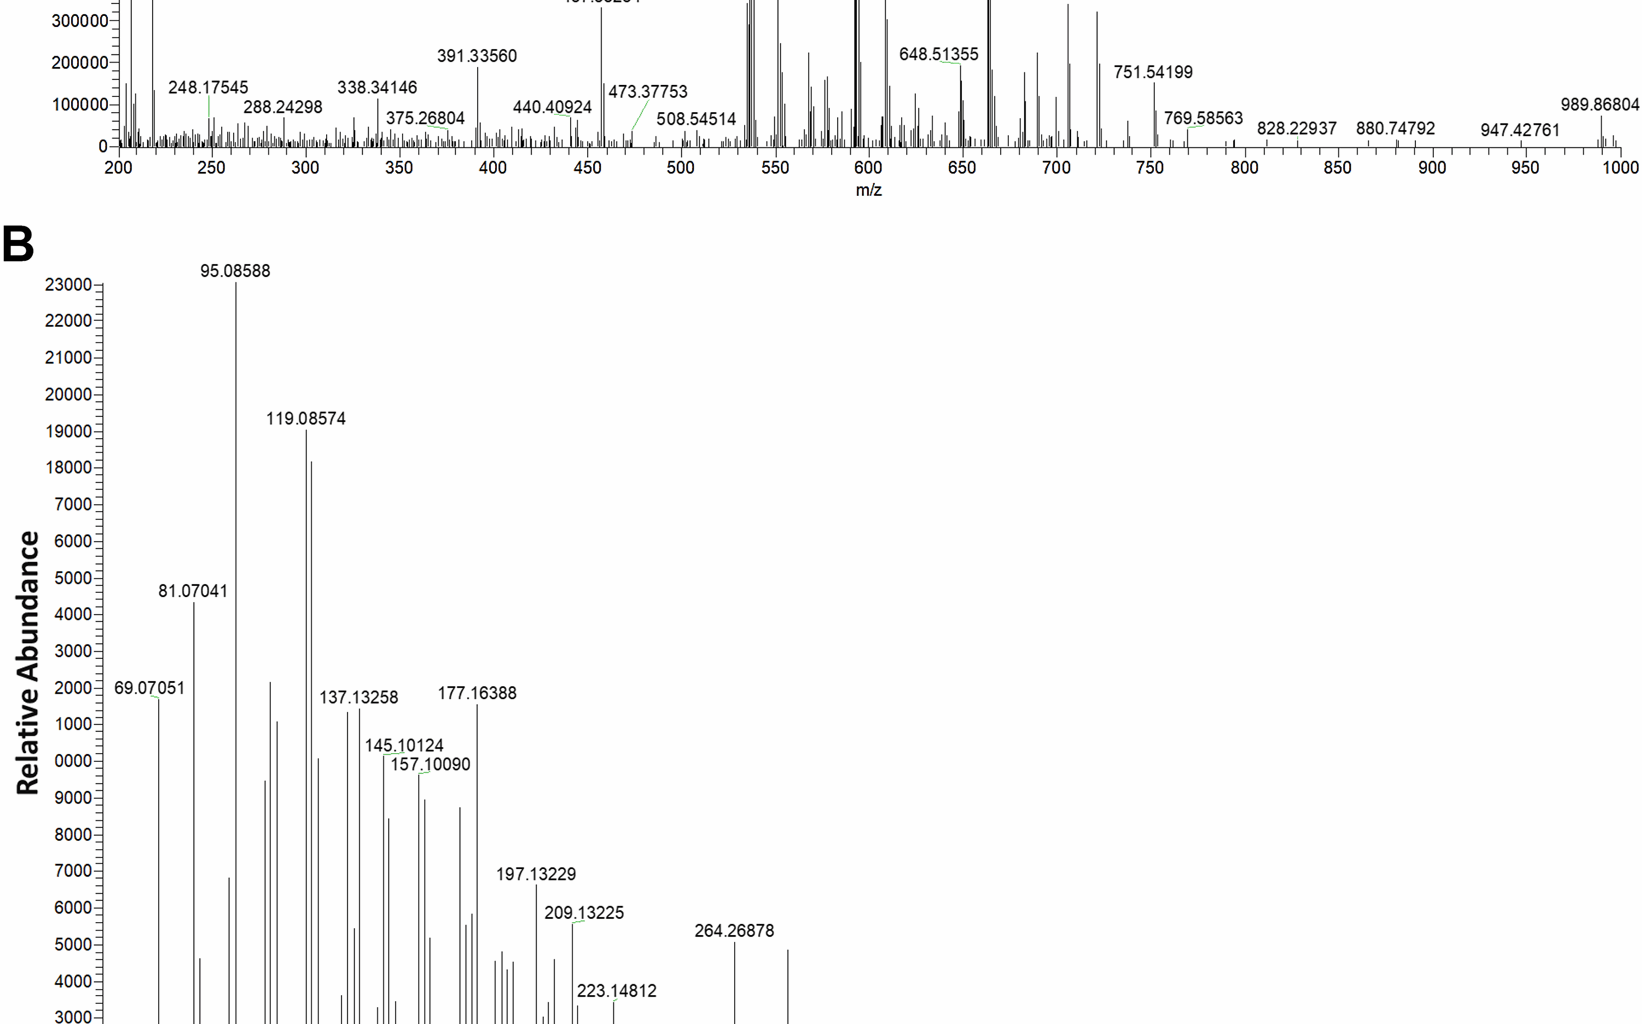
The lycopene standard was measured via HPLC at 450 nm with a retention time of approximately 19.10 min. A peak map of the standard samples (Figure S2A) and the wheat samples were measured (Figure S2B). A single peak appeared up in all five standard curves (Figure S1A), with a stable chromatographic baseline and no obvious curve tailing, demonstrating the accuracy of the method for lycopene measurement. The linear regression of the standard curve (R2 > 0.99) also confirmed the accuracy of the peak area external standard method (Figure S1B). The method was sensitive with a detection of limit (LOD) of 0.005 μg/ml and the quantification limit (LOQ) of 0.007 μg/ml (Table S2). Moreover, it yielded high recovery (95.92–97.18%) and acceptable variations (RSD% < 5) for wheat lycopene (Table S3). The LC–MS analysis of the target peak presented in the HPLC chromatograms (retention time of 19.10 min) of the wheat samples was performed. As shown in Fig. 1, the mass spectra profile (Ms1, Fig. 1A) of the component at 19.10 min exactly matches the lycopene mass spectra m/z (M + H) 537.44556, (M + H2O + K) 593.50781, and the Ms2 (Fig. 1B) profile of fragments 537.45. These findings further confirmed the detection of lycopene in wheat grains.
Fig. 1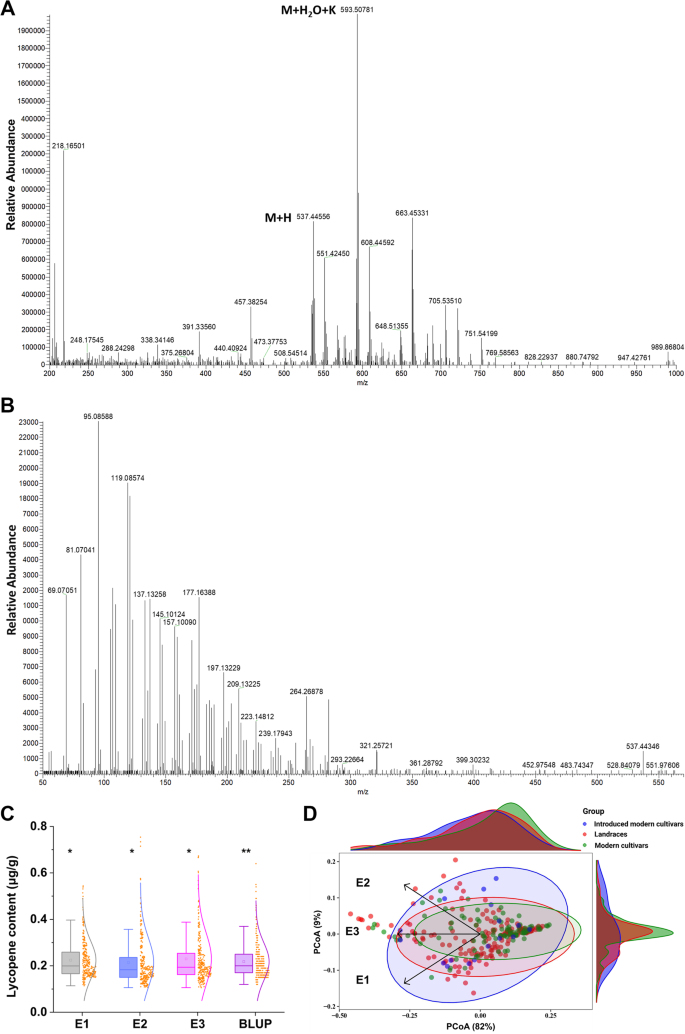
A Ms: the first-level mass spectrum detection signal. B Ms/ms: secondary mass spectrometry detection signal. Natural variation (C) and score plots (D) of lycopene content among the wheat accession harvested in three environments. The angle between the arrows represents the correlation between the variables, with the angle < 90° indicating a positive correlation and the angle > 90° indicating a negative correlation between the two variables. The asterisk *, ** or *** represents significant difference at the 0.05, 0.01 or 0.001 probability level
Lycopene content is typically measured via UV–VIS spectrophotometry and HPLC [22]. Despite the convenience of UV–VIS spectrophotometry, it involves interference from other carotenoids in the sample, and the solvent used tends to cause a larger error [23]. Alternatively, HPLC has been used for measuring single carotenoid components and is simple, accurate and stable [22], and it is widely used to detect lycopene contents in fruits and vegetables [14], as well as cereals such as maize [6] and rice [7]. HPLC assays have also been used to quantify carotenoid components including grain lycopene in wild-type Bobwhite and transgenic wheat [8,9,10]. This study further verified that an HPLC assay provides an accurate and reliable approach for measuring wheat grain lycopene quantity.
In studies on wheat provitamin A via genetic engineering, lycopene was detected only in the grains of transgenic lines of Chinese Spring and Bobwhite [8,9,10]. Owing to the small number of wheat varieties analyzed, the general distribution and genetic regulatory mechanism of wheat grain lycopene content is not fully understood. In this study, we surveyed 262 wheat accessions grown in three different environments for lycopene content and variation. Large samples of accessions in diverse environments are necessary for exploring target genes as well as for developing high lycopene wheat varieties.
Analysis of lycopene content in the Chinese MCC wheat
The grain lycopene content of Chinese MCC wheat, which consisted of 262 accessions, significantly varied. The coefficient of variation (CV) across the three distinct environments regardless of genotype, ranging from 36.39%−49.23%. The lycopene contents in E1, E2 and E3 ranged from 0.114–0.540 μg/g, 0.106–0.754 μg/g and 0.106–0.844 μg/g, with averages of 0.225 ± 0.082 μg/g, 0.214 ± 0.105 μg/g and 0.230 ± 0.111 μg/g, respectively (Fig. 1C; Table 1). The wheat accessions were classified into seven grades on the basis of their lycopene content. Most accessions (39.82%) contained 0.15–0.2 μg/g lycopene. There were 11, 14, and 20 MCC accessions whose lycopene contents in E1, E2 and E3 exceeded 0.4 μg/g, respectively (Table S4). In the field trial, a total of 12 accessions grown in all three environments presented average lycopene content greater than 0.4 μg/g. The red spring and winter wheat samples from Changji and Manasi, Xinjiang, contained higher levels of lycopene than others. Red spring wheat (Manasi, Xinjiang) had the highest average lycopene content (0.699 μg/g) across all the environments; thus, it is a high lycopene content enriched variety (Table S1). Importantly, it has been suggested that 500 g of high-lycopene whole wheat flour provides 50% of the recommended dietary allowance of 1 mg of lycopene [4].
Table 1 Descriptive statistics of lycopene in a 262-accession Chinese wheat MCC across 3 environments
Wang et al. (2020) reported that nonpolar carotenoids (lycopene, α-carotene or β-carotene) are most likely responsible for the irregular and persistent amyloplast membranes and that changes in carotenoid composition affect the formation of hard endosperm in maize [24]. These findings revealed that lycopene is a nonpolar carotenoid in maize endosperm. Chettry et al. (2019) reported that the lycopene content of rice grains was ranging from 3.10–17.32 μg/g in six different accessions [white (IC-558319, IC-583122), brown (IC-540274, IC-558324), and purple (LR 26, LR 27)] from Northeast India [7]. Riaz et al. (2019) reported that, the lycopene content in lentil significantly differed from 0.686 to 10.881 μg/g among 100 lentil germplasms from different agro-climatic zones in Pakistan [25]. However, to date, most of the studies on wheat grain lycopene have focused on transgenic wheat. Through the use of overexpression and silencing methods, wheat grain lycopene increased from 0.03 to 1.33 μg/g [8,9,10]. In the present study, the lycopene content in the MCC ranged from 0.11 to 0.85 μg/g across the three distinct environments, which is comparable to previous reports on other cultivars tested using HPLC [8,9,10]. Wheat varieties whose lycopene content is greater than 0.4 μg/g in multiple environments could provide germplasm resources for the breeding of biofortified varieties.
Effects of genotype, environment and their interactions on lycopene
For the 262 accessions of Chinese wheat MCC, the correlation analysis of wheat grain lycopene content across three environments revealed the following major influencing factors: genotype (71.973***) > genotype and environment interaction (27.365***) > environment (0.662) (Table S5). The skewness values of all environments were < 3, and the kurtosis values of all environments were < 10 (Table 1). These results suggest that the wheat grain lycopene content is a quantitative trait with a normal distribution. As well as the combined heritability was found to be higher (85.6%) (Table 1), suggesting that genetic factors had strong impact on determining the lycopene content, than that of environmental factors and genotypes might be the key influencing factors. This finding is consistent with tomatoes, in which lycopene is a typical quantitative trait that is controlled mainly by complex genetic systems (QTL) [26]. Genetic factors contribute to tomato fruit lycopene content, as demonstrated in molecular breeding via genetic engineering and genome editing [27].
Water is the major factor influencing wheat yield. The environments E2 and E3 are in the same location but differ in water regime. The statistics of the 262 MCC accessions grown in E2 and E3 showed that lycopene contents were positively correlated (p < 0.001), and the genotypes with high lycopene contents were generally consistent across both environments (Fig. 1D; Table S6). These findings indicate that, under normal growth conditions, the water regime had little effect on the lycopene content in wheat grains, suggesting that wheat has greater potential for lycopene enrichment than other food crops, such as maize and rice, which require more water. Moreover, lycopene is classified as a secondary metabolite that demonstrates significant functional relevance in the mechanisms of plant stress adaptation. Alongside numerous secondary metabolites, it plays a critical role in the stress responses of plants. Its content may be higher under rain-fed (stress) conditions, which are typically characterized by abiotic stress. This stress-induced response may elucidate why lycopene levels tend to be relatively higher under sub-optimal growing conditions compared to irrigated environments.
Distribution of lycopene content in Chinese MCC wheat cultivars
Wheat plantations in China are divided into 10 agro-ecological zones (AEZ) on the basis of climate, geographical area, planting system and crop variety [28]. The analysis of lycopene contents across these AEZ could reveal the impacts of geophysical factors. In this study, the frequency distribution of lycopene in wheat varieties across the AEZ was generally consistent, and not significantly different, except that the Xinjiang winter and spring wheat regions contained mainly wheat varieties with high lycopene contents (Fig. 2; Table S7, S8). These findings suggest that geographical location may be of less concern in the breeding of high-lycopene wheat varieties.
Fig. 2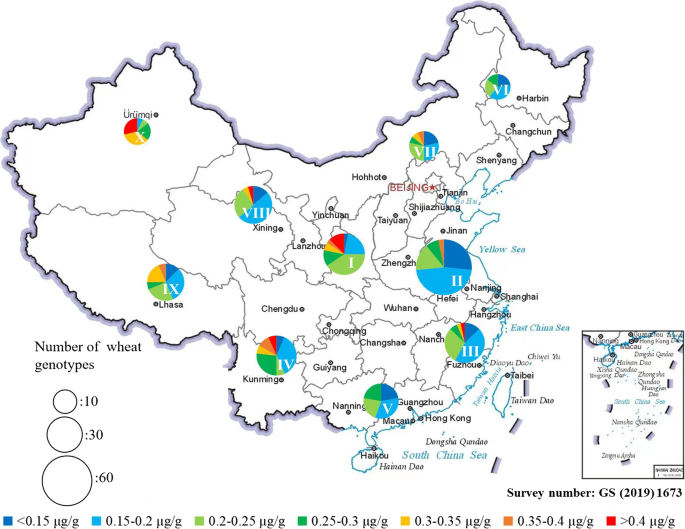
The frequency distribution of grain lycopene of the Chinese wheat MCC across 10 AEZ. The circle size represents the number of accessions and the color represent the proportion of each lycopene range. The Roman numbers are: I (Northern winter wheat region), II (Yellow and Huai River valley winter wheat region), III (low and middle Yangtze River valley winter wheat region), IV (Southwestern winter wheat region), V (Southern winter wheat region), VI (Northeastern spring wheat region), VII (Northern spring wheat region), VIII (Northwestern spring wheat region), IX (Qinghai-Tibet spring-winter wheat region), X (Xinjiang winter-spring wheat region)
For the Xinjiang region (AEZ-X, Fig. 2), the relatively high lycopene content is likely due to the combination of wheat genotypes, large diurnal temperature differences and long sunshine times rather than drier soil conditions, since the water regime was found to have little effect on the lycopene content in wheat grains. This hypothesis is consistent with the observation that strong light and large diurnal temperature differences contribute to lycopene accumulation [29]. Light induces photosynthetic complex formation and indirectly promotes lycopene yield. In general, genotype is the primary factor influencing the variation in wheat grain lycopene content, and strong light and large diurnal temperature differences are the main environmental factors.
Effects of grain color, winter/spring variety and accession type on wheat lycopene
Wheat kernels are typically red and white in color, which is generally associated with the accumulation of the polyphenolic compound phlobaphene in the outer layer of the kernels [30]. This study included 167 red- and 95 white-grain accessions in the MCC panel. ANOVA was used to evaluate the effect of grain color on the wheat lycopene content. In E1, the red-grain accessions contained higher lycopene than the white-grain accessions [6.87 (p < 0.001)] (Fig. 3A; Table S9), and no difference was found in E2 and E3. It is reasonable to infer that grain color may not be a concern in selection for high-lycopene wheat varieties. No significant difference in lycopene content was detected between the spring wheat variety and the winter wheat variety (Fig. 3B; Table S9), indicating that the winter/spring variety had little effect on the lycopene content. Similarly, there was no significant difference in lycopene content among the landraces, modern cultivars and introduced varieties (Fig. 3C; Table S10). In general, this study revealed that grain color, winter/spring variety and accession type were not the key factors in future breeding for high-lycopene wheat varieties.
Fig. 3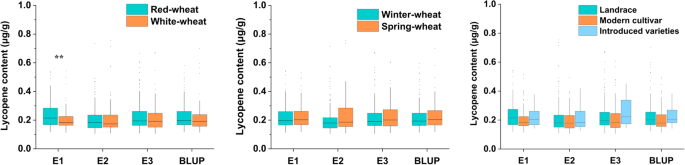
Lycopene contents in wheat grains of different colors (A), winter/spring varieties (B) and accession types (C). The asterisk *, ** and *** each represents significant difference at the 0.05, 0.01 and 0.001 probability levels
Relationship of lycopene with bioactive compounds
Whole grain cereals contain a variety of bioactive compounds, including folate, lutein, and lycopene, all of which are important for human health. In all three environments, the lycopene content in Chinese MCC wheat was not correlated with the average folate level [30] but was positively correlated with the average lutein content [18] (Table S11). Pairwise correlation analysis revealed a significant correlation between lycopene and lutein contents across all three environments (Table S12). The synthesis of folate and lycopene occurs through two distinct biosynthetic pathways, without any relevance to each other. It has been reported that wheat grains accumulate mainly the non-vitamin A carotenoid lutein, while lycopene serves as the upstream product of lutein, with its cyclization being the rate-limiting factor in lutein biosynthesis [8]. These findings highlight the close relationship between lycopene and lutein, suggesting the potential for breeding wheat varieties rich in lycopene and lutein in the future.
Relationships between lycopene content and agronomic traits
Lycopene was significantly and negatively correlated with TKW and GW (Fig. 4). This finding is consistent with the significant negative correlation of lutein with TKW reported in a study involving 262 accessions of Chinese MCC wheat [18]. Moreover, lycopene content was positively correlated with the wheat maturity date (Fig. 4). During the early stages of development, kernel cells contain chlorophylls, which degrade as the grain matures, along with a substantial accumulation of carotenoids. This process is associated with the differentiation of chloroplasts into chromoplasts [31]. Saini et al. reported that in ripening tomato fruits, lycopene gradually increased, reaching its highest level in the late ripening stage [32]. Thus, it can be inferred that wheat varieties with longer maturity dates may be preferred for higher lycopene contents.
Fig. 4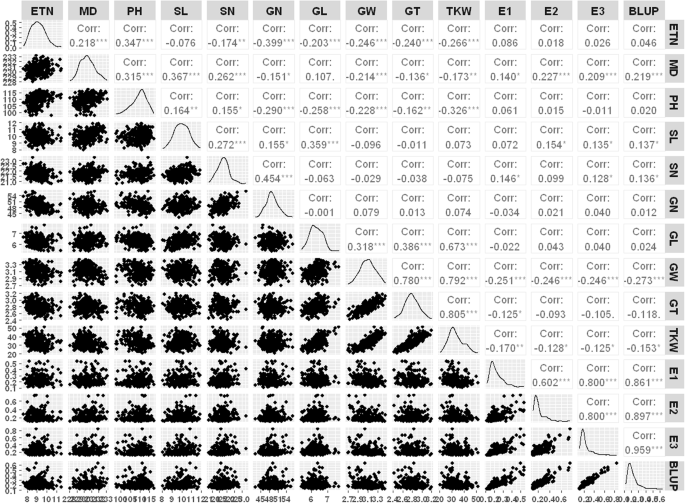
Correlation of wheat lycopene to 10 agronomic traits: effective tiller number (ETN), maturity date (MD), plant height (PH), spike length (SL), spikelet number per spike (SN), grain number per spike (GN), grain length (GL), grain width (GW), grain thickness (GT), thousand kernel weight (TKW). The asterisk *, ** or *** represents significant difference at the 0.05, 0.01 and 0.001 probability level
Genetic loci associated with lycopene identified through GWAS
The lycopene content of wheat is affected mainly by genetic factors. In the search for lycopene QTL and genes via GWAS in wheat, a total of 122 significant MTAs (− log10(P-value) ≥ 3.0) were detected on 17 chromosomes with the exceptions of 2D, 3D, 4D and 6D (Fig. 5A, Table S13). The QQ plots for the SNPs demonstrated a similar distribution of observed and expected P-values, indicating that the false positives in the GWAS were effectively controlled (Figure S3). The detected MTAs formed 45 loci on the basis of the defined LD block, among which 12 QTL on chromosomes 1A, 1B, 2B, 4A, 5A, 5B, 6B, 7A and 7B were stably identified in two or three environments (Fig. 5A; Table 2). Specifically, QLyc.sxau-2B, QLyc.sxau-7A.2, and QLyc.sxau-7B were mapped to the regions of 775.37–775.83 Mb, 712.42–713.74 Mb and 703.17–717.75 Mb, respectively, across all environments, indicating the greater stability of these three QTL. In addition, QLyc.sxau-1A, QLyc.sxau-1B.1, QLyc.sxau-1B.2, and QLyc.sxau-5A.2 were identified in E2, E3, and BLUP; QLyc.sxau-4A and QLyc.sxau-6B were identified in E1, E2, and BLUP; and QLyc.sxau-5A.1, QLyc.sxau-5B and QLyc.sxau-7A.1, were identified in E1, E3 and BLUP. More specifically, the associated marker IAAV416 of QLyc.sxau-7A.2, located at 712.42–713.74 Mb, exhibited a highly significant level (− log10(P-value) = 4.19–6.86), indicating the presence of genes that regulate lycopene at these loci (Table 2).
Fig. 5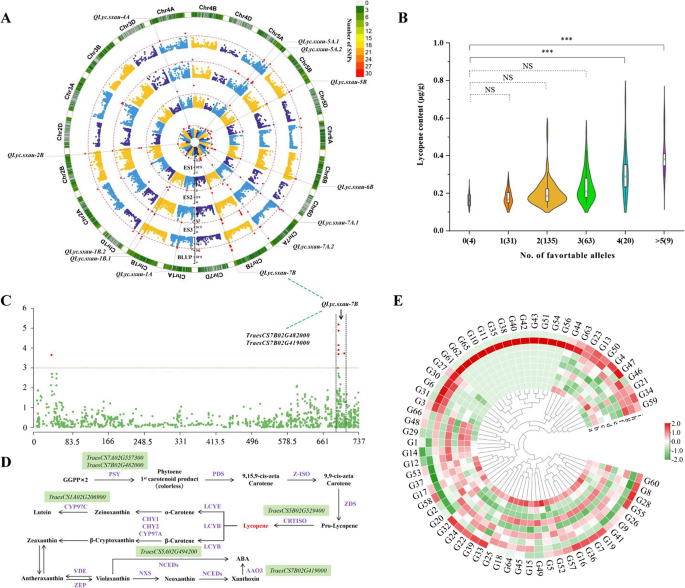
A Whole-genome quantitative trait loci (QTL) mapping of grain lycopene contents in the Chinese wheat mini-core collection (MCC) across three distinct environments E1, E2, E3 and BLUP. The red dashed line represents the log-of-odds score threshold of 3.0. The outer track shows the single nucleotide polymorphism (SNP) loci variation in each linkage group. B Plot shows the additive effects of favorable alleles at stable QTL loci on lycopene contents of MCC wheat. C Manhattan plot of lycopene contents in BLUP with markers on chromosome 7B. D Scheme of lycopene biosynthesis pathway in plants. Shaded green are genes with known carotenoid pathways in functional regions. The abbreviations are: GGPP (geranylgeranyl diphosphate), PSY (phytoene synthase), PDS (phytoene desaturase), ZISO (ζ-carotene isomerase), ZDS (ζ-carotene desaturase), CRTISO (carotenoid isomerase), LYCB (β-lycopene cyclase), LYCE (ε-lycopene cyclase), CHY1 CHY2 CYP97A (β-carotene hydroxylase), CYP97C (carotene ε-hydroxylase), ZEP (zeaxanthin epoxidase), VDE (violaxanthin deepoxidase), NXS (neoxanthin synthase), NCEDs (9-cis-epoxycarotenoid dioxygenases), AAO3 (Abscisic aldehyde oxidase). E. Transcriptome data for candidate region in wheat grain with high expression (FPKM) and known pathway candidate genes in different tissues, where a: roots, seedling (n = 8); b: leaves/shoots, seedling (n = 174); c: roots, vegetative (n = 73); d: leaves/shoots, vegetative (n = 156); e: spike, vegetative (n = 2); f: roots, reproductive (n = 8); g: leaves/shoots, reproductive (n = 151); h: spike, reproductive (n = 278); i: grain, reproductive (n = 166)
Table 2 Stable quantitative trait loci (QTL) for wheat grain lycopene content (LYC) from the Chinese wheat mini-core collection (MCC)
Notably, among the 12 stable loci identified in this study, QLyc.sxau-6B, QLyc.sxau-7A.1 and QLyc.sxau-7A.2 were previously reported. Two flour color-related QTL, QYPC.caas-6BL.2 and QYPC.caas-7AS, were previously described by Zhai et al. (2016) in an RIL population derived from a cross between the bread wheat cultivars Gaocheng 8901 and Zhoumai 16. These two QTL overlapped with the physical locations of QLyc.sxau-6B and QLyc.sxau-7A.1, respectively. These findings indicate that QLyc.sxau-6B, QYPC.caas-6BL.2, QLyc.sxau-7A.1 and QYPC.caas-7AS may be located at the same locus. Additionally, QLyc.sxau-7A.2 was also found close to other QTL associated with flour color, e.g. wPt-4038-cfa2257a, which is linked to flour yellowness (b*) color variation [33], and cfa2040-gwm344, which is related to the yellow index and/or yellow pigment content [34]. These findings indicate that the QLyc.sxau-7A.2 region is significantly correlated with the lycopene content in wheat.
Comparison of grain lycopene content between different alleles of QTL
The assessment of the influence of different QTL alleles on wheat grain lycopene content revealed consistent effects of the same loci across all environments. Significant differences in lycopene content were detected among the variant alleles at QLyc.sxau-1A, QLyc.sxau-1B.2, QLyc.sxau-2B, QLyc.sxau-4A, QLyc.sxau-5A.1, QLyc.sxau-6B, QLyc.sxau-7A.2 and QLyc.sxau-7B (P < 0.05), among which QLyc.sxau-2B, QLyc.sxau-7A.2 and QLyc.sxau-7B had greater effects (P < 0.001) (Fig. 6, and S4). The variation in QLyc.sxau-7A.2 had the second highest effect on lycopene quantity, about 70.79% in BLUP (Table 2). In E1, E2 and E3, the lycopene content in Allele-C was significantly higher (53.03–83.41%) than that in Allele-G (P < 0.001) (Fig. 6). QLyc.sxau-2B had the second highest effect on lycopene content (47.34%) in BLUP (Table 2). The lycopene content of Allele-A was significantly higher by 26.63–62.55%, than that of the lines with Allele-G (P < 0.001) across all environments (Fig. 6). These results indicate that wheat grain lycopene content is controlled by a few major genes and multiple minor genes (Fig. 6). The development of new markers is necessary to select high lycopene content wheat varieties in the future. For instance, in the wild-type background, alleles containing the C allele of QLyc.sxau-7A.2, and the A allele of QLyc.sxau-2B and QLyc.sxau-7B could be chosen to biofortify lycopene (Table S14).
Fig. 6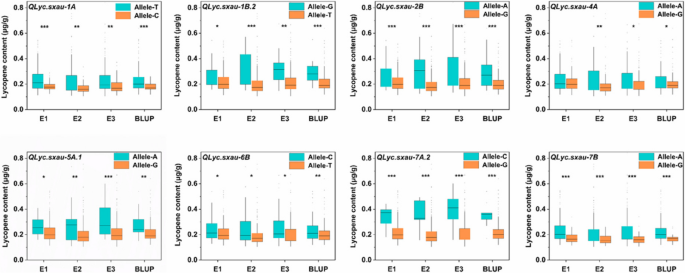
Effect of alleles of QTL on wheat grain lycopene contents in different environments including BLUP. The asterisk *, ** or *** represents significant difference at the 0.05, 0.01 or 0.001 probability level
Additive effects of major and stable QTL for grain lycopene content
Six stable QTL showed an additive effect on wheat grain lycopene, viz. QLyc.sxau-1A, QLyc.sxau-1B.2, QLyc.sxau-2B, QLyc.sxau-6B, QLyc.sxau-7A.2 and QLyc.sxau-7B. The lycopene content increased with increasing numbers of favorable alleles present at these six stable QTL loci (Fig. 5B), among which the frequency of favorable alleles ranged from 0.04 to 0.91, with a median of 0.34. QLyc.sxau-1A and QLyc.sxau-7B exhibited the highest frequencies of favorable alleles, indicating a significant correlation with lycopene levels in wheat grains. The lycopene content in the lines with at least four favorable alleles was 44.72%−149.14% greater than that in the lines without favorable alleles (P < 0.001). These favorable alleles provide potential targets for exploring functional lycopene genes in wheat, as well as for breeding high-lycopene wheat varieties.
Candidate genes for lycopene biosynthesis and regulation in wheat
Using the IWGSCv1.1 Chinese Spring reference genome and its functional annotation, the genes in the functional regions of 12 stable QTL associated with lycopene were identified via GWAS, resulting in a total of 2394 highly confident genes. The TraesCS1A02G206900_G1, TraesCS5A02G494200_G8, TraesCS5B02G529400_G29, TraesCS7A02G557300_G48, TraesCS7B02G419000_G49, and TraesCS7B02G482000_G66 were associated with lycopene synthesis and degradation pathways (Fig. 5D and S5), with the vital enzymes of phytoene synthase (PSY), phytoene desaturase (PDS), Zeta-carotene dehydrogenase (ZDS), carotenoid isomerase (CRTISO), lycopene β-cyclase (LCYB), lycopene ε-cyclase (LCYE), and ε-ring carotene hydroxylase (CHXB) (Fig. 5C) [35,36,37].
Notably, the region at QLyc.sxau-7A.2 contained the TraesCS7A02G557300_G48 (Psy-A1) gene, whereas the region at QLyc.sxau-7B contained the TraesCS7B02G482000_G66 (Psy-B1) gene; both genes are homologous to AT5G17230. TraesCS7A02G557300_G48 and TraesCS7B02G482000_G66 encode phytoene synthase (PSY), which catalyzes the first committed step in the carotenoid biosynthesis pathway and is a major rate-limiting enzyme of carotenogenesis [35]. The Psy1 gene was found to be associated with the QTL for yellowness (b*) color variation in wheat flour [38]. In addition, TraesCS7B02G419000_G49 encodes abscisic aldehyde oxidase (AAO) in the QLyc.sxau-7B region, which catalyzes the final step of ABA biosynthesis [19]. The TraesCS1A02G206900_G1 gene was identified in the QLyc.sxau-1A region, which is a homolog of the Arabidopsis gene CYP97C1 (AT3G53130), which encodes carotenoid ε-cyclohydroxylase (the cytochrome P450 enzyme CYP97C1). The CYP97C1 plays an important role in carotenoid hydroxylation reactions [39]. In the QLyc.sxau-5A.2 region, the gene TraesCS5A02G494200_G8, which is homologous to the rice gene Os03g0125100, encodes carotenoid β-cyclohydroxylase 1. Thus, the enzyme BCH1 first hydroxylates β-carotene on a β-ring to form β-cryptoxanthin, which is then converted to zeaxanthin [37]. TraesCS5B02G529400_G29 was found in the QLyc.sxau-5B region, encoding a carotenoid isomerase that is homologous to the ArabidopsisCRTISO2 (AT1G57770) gene, which is essential for converting colorless phytoene to red-colored lycopene [36]. Among the 12 stable QTL identified in this study, only five QTL regions (QLyc.sxau-1A, QLyc.sxau-5A.2, QLyc.sxau-5B, QLyc.sxau-7A.2, and QLyc.sxau-7B) contained regulatory genes associated with known pathways (Figure S6 and Table S15), suggesting the presence of possible unknown regulatory genes or pathways involved in wheat grain lycopene production.
The genes within functional intervals exhibited high expression variation across different tissues (Fig. 5E; Table S15). Gene expression analysis revealed that five QTL regions contained six regulatory genes (TraesCS1A02G206900_G1, TraesCS5A02G494200_G8, TraesCS5B02G529400_G29, TraesCS7A02G557300_G48, TraesCS7B02G419000_G49, and TraesCS7B02G482000_G66) associated with known carotenoid pathways. The expression of these six genes was low in the kernel milk stage but remained high in the leaves throughout the plant’s life cycle. Further examination of gene expression in episperm, endosperm, and embryonic tissues revealed that TraesCS1A02G206900_G1, TraesCS5A02G494200_G8, and TraesCS7B02G482000_G66 had high expression levels in the episperm, whereas TraesCS7B02G419000_G49 was expressed at high levels in the endosperm (Figure S6). Moreover, TraesCS7A02G557300_G48 was more highly expressed in the grain, whereas TraesCS5B02G529400_G29 was expressed at lower expression in the grain structure (Figure S6). It is inferred that the specific expression of these genes is related to the accumulation of lycopene and other carotenoids in wheat grains.