

Find your next quality investment with Simply Wall St’s easy and powerful screener, trusted by over 7 million individual investors worldwide.
If you are wondering whether Paycom Software’s share price reflects its true worth, starting with a clear look at valuation can help frame your next move.
The stock recently closed at US$123.56, with a 5.6% gain over 7 days, set against returns of 9.6% over 30 days, 18.9% year to date, and 37.1% over the past year.
Over 3 and 5 years, shareholders have seen returns of 56.3% and 66.8%. This gives useful context for anyone reassessing their expectations and can shape how you think about risk, potential recovery, and what you need from the current valuation to feel comfortable holding or starting a position.
Simply Wall St assigns Paycom Software a valuation score of 5 out of 6. Next, you will see how that score is built using different approaches, and why an even deeper way of thinking about value could matter most by the end of this article.
Find out why Paycom Software’s -37.1% return over the last year is lagging behind its peers.
A Discounted Cash Flow, or DCF, model takes forecasts of a company’s future cash flows and discounts them back to today using a required rate of return. The goal is to estimate what those future cash flows are worth in today’s dollars.
For Paycom Software, the model used is a 2 Stage Free Cash Flow to Equity approach based on cash flow projections. The latest twelve month free cash flow is about $434.9 million. Analysts provide explicit forecasts for several years, and Simply Wall St then extrapolates further out to build a 10 year path. By 2030, projected free cash flow is $698.0 million, with interim projections between 2026 and 2035 also feeding into the valuation.
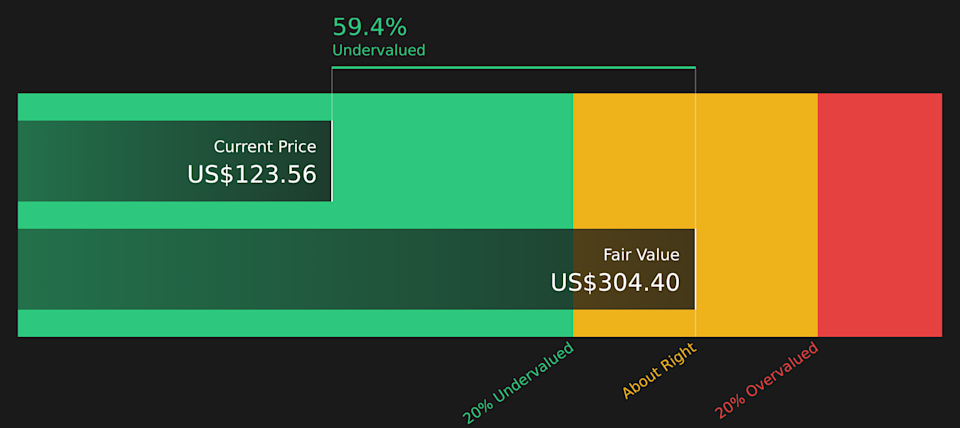
After discounting these cash flows and estimating value beyond the explicit forecast period, the model arrives at an intrinsic value of about $304.40 per share. Compared with the recent share price of $123.56, this implies the shares are 59.4% below the DCF estimate, which points to the stock being undervalued on this measure.
Result: UNDERVALUED
Our Discounted Cash Flow (DCF) analysis suggests Paycom Software is undervalued by 59.4%. Track this in your watchlist or portfolio, or discover 59 more high quality undervalued stocks.
 PAYC Discounted Cash Flow as at Apr 2026
For profitable companies, the P/E ratio is a useful way to connect what you pay for each share with the earnings that support that price. It quickly shows how many dollars of share price you are paying for each dollar of earnings.
Story Continues
What counts as a “normal” P/E depends on how the market views a company’s growth prospects and risk. Higher expected growth and lower perceived risk often support a higher P/E, while slower growth or higher risk usually call for a lower P/E.
Paycom Software currently trades on a P/E of 14.49x. That sits below the Professional Services industry average P/E of 19.31x and below the peer group average of 17.75x. Simply Wall St also calculates a proprietary “Fair Ratio” of 18.84x for Paycom Software. This metric aims to reflect the P/E that might be appropriate given factors such as earnings growth profile, profit margins, industry, market cap and company specific risks.
Because the Fair Ratio is tailored to Paycom Software, it can be more informative than a simple comparison to peers or the broad industry. With the Fair Ratio of 18.84x above the current 14.49x P/E, the shares screen as undervalued on this metric.
Result: UNDERVALUED
 NYSE:PAYC P/E Ratio as at Apr 2026
P/E ratios tell one story, but what if the real opportunity lies elsewhere? Start investing in legacies, not executives. Discover our 20 top founder-led companies.
Earlier it was mentioned that there is an even better way to understand valuation, so Narratives take center stage as a simple way for you to attach a clear story about Paycom Software to concrete numbers like fair value, future revenue, earnings and margins, then see how that story stacks up against today’s price.
A Narrative on Simply Wall St, available on the Community page and used by millions of investors, connects three pieces for you in one place: the business story you believe, the forecast that falls out of that story, and the fair value that those assumptions imply.
Once you have that, you can compare each Narrative’s fair value to the current share price to help decide how you view Paycom in terms of holding, adding or trimming, and the tool then updates automatically as fresh information such as earnings or news is fed into the underlying assumptions.
For Paycom Software, for example, one community Narrative currently anchors on a fair value of about US$260.61 while another anchors on about US$165, so you can quickly see how different investors’ stories about Beti, IWant, data center spending and growth translate into different views of what the shares are worth.
Do you think there’s more to the story for Paycom Software? Head over to our Community to see what others are saying!
NYSE:PAYC 1-Year Stock Price Chart
This article by Simply Wall St is general in nature. We provide commentary based on historical data and analyst forecasts only using an unbiased methodology and our articles are not intended to be financial advice. It does not constitute a recommendation to buy or sell any stock, and does not take account of your objectives, or your financial situation. We aim to bring you long-term focused analysis driven by fundamental data. Note that our analysis may not factor in the latest price-sensitive company announcements or qualitative material. Simply Wall St has no position in any stocks mentioned.
Companies discussed in this article include PAYC.
Have feedback on this article? Concerned about the content? Get in touch with us directly. Alternatively, email editorial-team@simplywallst.com