
Researchers have documented the first two-dimensional map of a tsunami moving across the open ocean, captured by a satellite shortly after a major earthquake.
That view turns a fast-moving hazard into a measurable pattern, revealing how the wave spread, split, and carried energy across a wide area.
Rare satellite alignment

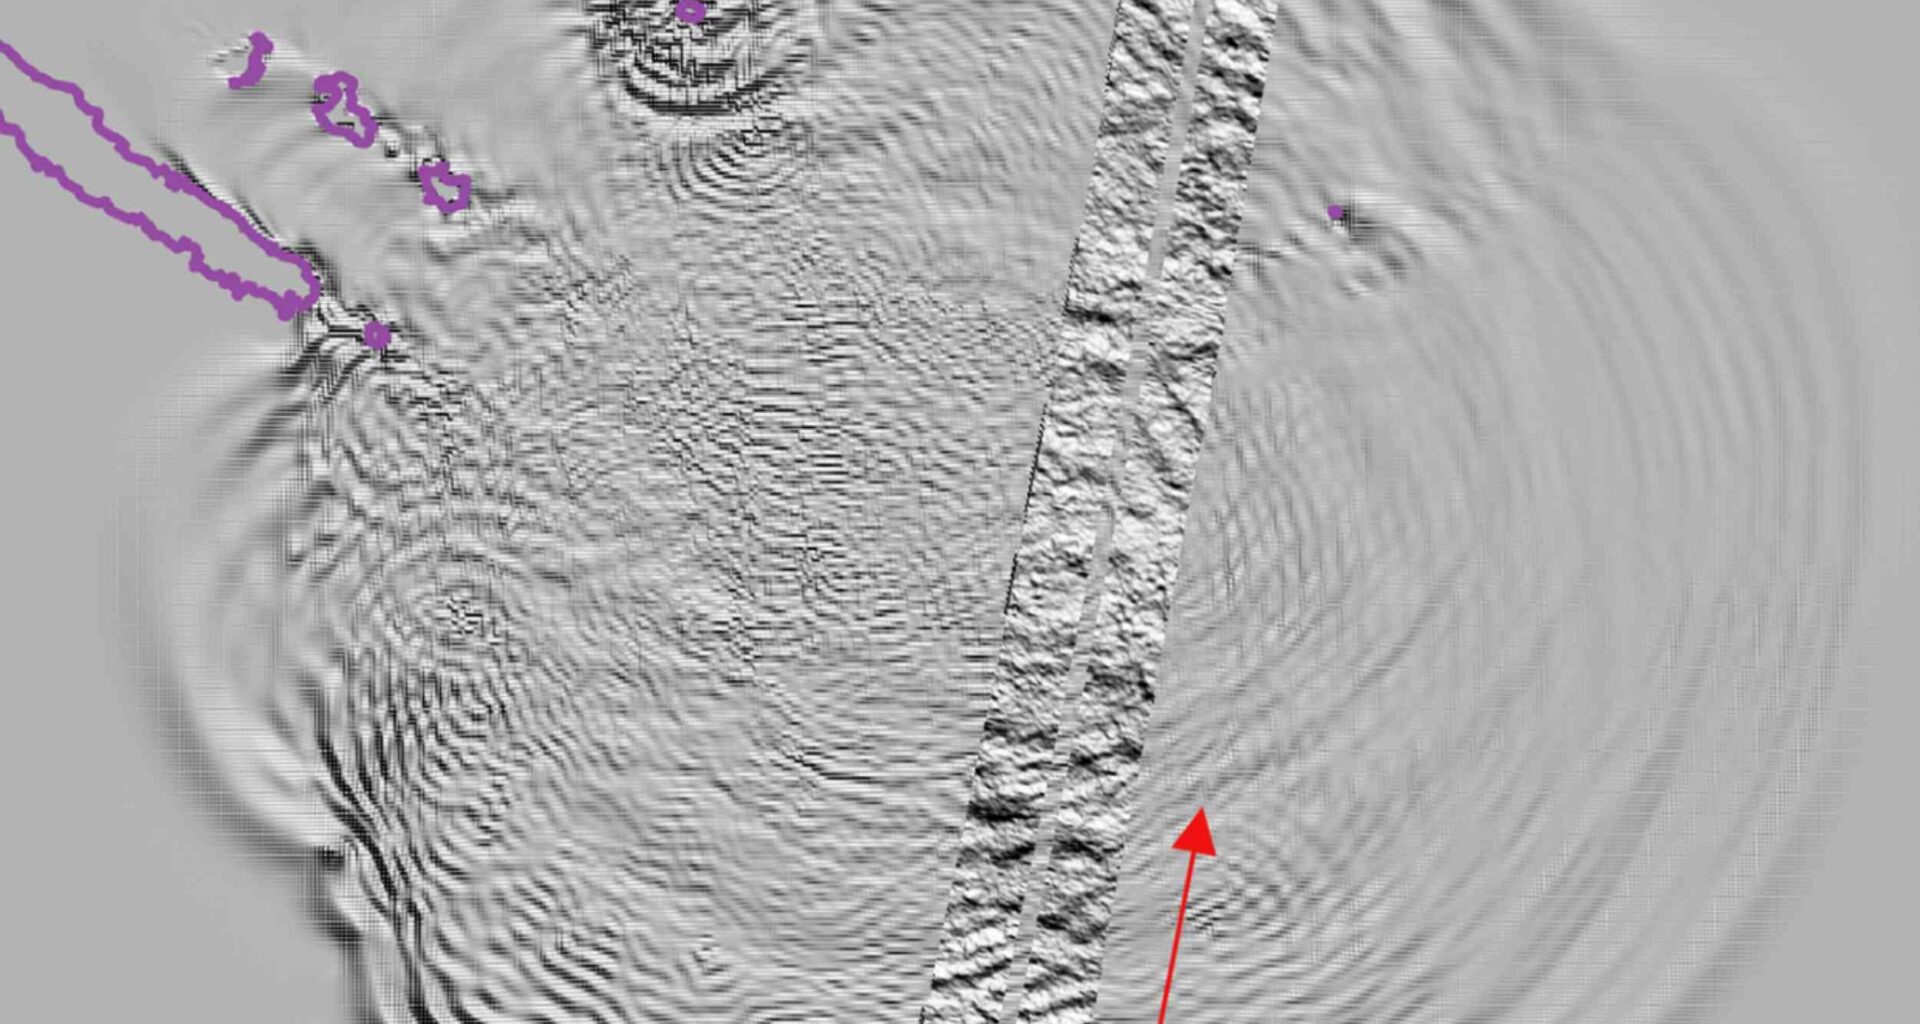
A wide swath of ocean southeast of the Loyalty Islands revealed two distinct tsunami fronts moving across deep water within a single satellite pass.
Tracing that signal, Jean H. M. Roger at Earth Sciences New Zealand demonstrated that the structure matched a propagating tsunami rather than normal ocean motion.
One front appeared stronger and farther from the source, while a second, weaker front followed along the same path within minutes.
Because both fronts were recorded during a single overflight, the observation captured a continuous wavefield that invites deeper analysis of how tsunamis evolve in open ocean conditions.
Tsunami in 2D
Before this event, orbiting instruments usually cut across tsunamis as narrow lines, leaving scientists to reconstruct the broader shape afterward.
Unlike older satellites, Surface Water and Ocean Topography (SWOT) satellites scan a broad strip, capturing both width and length.
Back in 2004, satellites clearly recorded the Indian Ocean tsunami, but only along narrow crossing lines.
With side-to-side structure finally visible, researchers can separate real wave geometry from ordinary ocean bumps with far greater confidence.
How the tsunami began
At 2:57 a.m. UTC on May 19, 2023, a magnitude 7.7 earthquake struck southeast of the Loyalty Islands.
Its shallow rupture shoved part of the seafloor upward, and that sudden lift pushed seawater above it into motion.
Soon afterward, coastal gauges and offshore sensors across the southwest Pacific began recording the disturbance as it moved away.
By the time SWOT arrived near 4:00 a.m. UTC, the expanding wave was already racing across deep water.
Cleaning the picture
Open-ocean height data mix many signals, and a tsunami can hide inside normal swells, currents, tides, and eddies.
To strip that clutter away, the team compared the event with the previous day and data from seven other satellites.
Once those background patterns were removed, the northern front stood out clearly, while smaller secondary waves appeared inside the main ring.
Without that cleanup, ordinary ocean variability could easily masquerade as tsunami structure and blur the story the satellite captured.
Waves within waves
The image showed more than a single crest, because several shorter ripples trailed behind the larger leading front.
Those lagging ripples reflected dispersion, when different wavelengths travel at different speeds, so the tsunami stretched as it moved.
Near the strongest front, the wave rose about 6 inches (15 centimeters) and extended for more than 62 miles (100 kilometers).
That direct look at a dispersing train gave scientists a rare view of behavior models have long predicted.
Model meets measurement
Computer simulations of the earthquake produced fronts in nearly the same places and at nearly the same times.
Using a simple rupture scenario, the model matched the phase of the leading waves better than their size.
Measured heights still came out larger, with the mismatch averaging about 5 inches (13 centimeters) and reaching much more in places. Simulations consistently underestimated the observed wave amplitudes.
Why the fit slipped
Source estimates for this earthquake remain uncertain, partly because seismic coverage in that corner of the Pacific is sparse.
Even a small change in where the fault moved can alter how much water rises and where energy travels.
Another analysis moved the source about 12 miles (19 kilometers) to better match the available regional records.
Below the wave, rugged bathymetry – the shape of the seafloor – likely added small reflections and bends the simple model missed.
What scientists gain
A two-dimensional record gives tsunami scientists something they almost never get: the full layout of the wave in motion.
That broader view helps test earthquake source ideas, because direction, curvature, and spacing all carry clues about what happened below.
Earlier satellite passes could confirm timing or height, but they left most side-to-side structure inferred.
The conclusion highlights that two-dimensional data allows scientists to better separate tsunami waves from background ocean signals.
Rare but revealing
Catching any tsunami from orbit still depends on luck, because satellites and fast waves rarely meet at the right moment.
During SWOT’s early daily-repeat phase, that unlikely alignment happened, and the spacecraft crossed the signal in about four minutes.
After calibration, the mission moved to a 21-day repeat orbit, making similar encounters even harder to expect.
That rarity limits warning use, but it makes each successful overflight a powerful test of how tsunamis really behave.
Future tsunami research
The new map ties earthquake motion, deep-ocean travel, trailing ripples, and model error into one scene scientists could not see before.
With better source estimates and more wide-strip missions, rare flyovers could become one of the sharpest checks on tsunami physics and risk.
The study is published in Natural Hazards and Earth System Sciences.
—–
Like what you read? Subscribe to our newsletter for engaging articles, exclusive content, and the latest updates.
Check us out on EarthSnap, a free app brought to you by Eric Ralls and Earth.com.
—–