

Find winning stocks in any market cycle. Join 7 million investors using Simply Wall St’s investing ideas for FREE.
If you are wondering whether Telefonaktiebolaget LM Ericsson is fairly priced or if the current share price leaves room for value, this article breaks down what the numbers say so you can judge for yourself.
The stock last closed at SEK104.5, with a 1.1% decline over 7 days, a 1.4% decline over 30 days, and returns of 18.3% year to date, 35.2% over the last year, 108.3% over 3 years, and 8.3% over 5 years.
Recent headlines around Ericsson have focused on its position in global telecom equipment and ongoing contract wins and network rollouts. These factors help frame how investors think about future demand and often influence how the market weighs potential growth against risks such as competition and capital intensity.
Ericsson currently has a valuation score of 3/6, indicating it screens as undervalued on half of Simply Wall St’s checks. The article will next walk through the usual valuation methods before finishing with a framework that can help you interpret those numbers in a more complete way.
A Discounted Cash Flow, or DCF, model estimates what a company could be worth today by projecting its future cash flows and then discounting those amounts back to a present value.
For Telefonaktiebolaget LM Ericsson, the model used is a 2 Stage Free Cash Flow to Equity approach, based on cash flows in SEK. The latest twelve month free cash flow sits at about SEK32.1b. Analyst inputs cover the earlier forecast years, and Simply Wall St extends those estimates further out, with projected free cash flow of SEK17.8b in 2030 and a full ten year path of cash flows that gradually step down from today’s level.
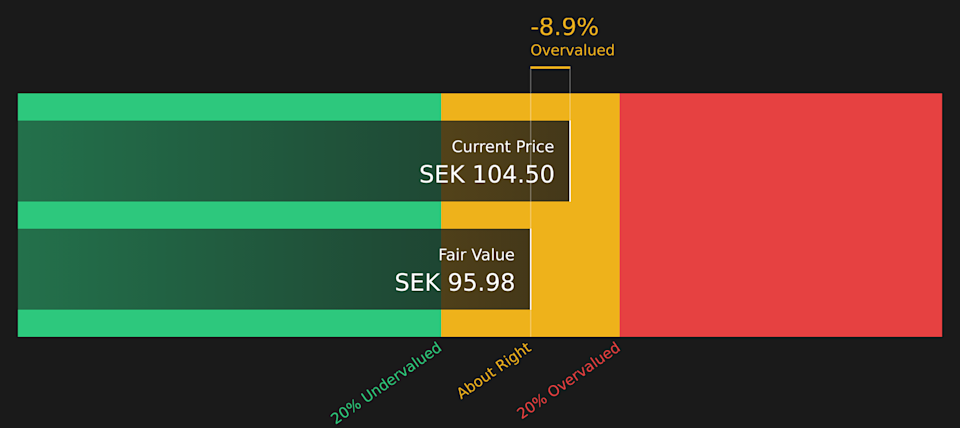
When all these future SEK cash flows are discounted back and summed, the model arrives at an estimated intrinsic value of SEK95.98 per share. Compared with the recent share price of SEK104.5, this implies the stock screens as roughly 8.9% overvalued on this DCF view, which is a relatively small gap.
Result: ABOUT RIGHT
Telefonaktiebolaget LM Ericsson is fairly valued according to our Discounted Cash Flow (DCF), but this can change at a moment’s notice. Track the value in your watchlist or portfolio and be alerted on when to act.
 ERIC B Discounted Cash Flow as at Apr 2026
P/E is a common way to value profitable companies because it links what you pay per share directly to the earnings that each share generates. In general, higher expected growth and lower perceived risk tend to justify a higher P/E, while lower growth expectations or higher risk usually point to a lower, more cautious P/E range.
Telefonaktiebolaget LM Ericsson currently trades on a P/E of 13.8x. That sits below the Communications industry average of 41.5x and also below the wider peer group average of 74.6x, which suggests the market is assigning a lower earnings multiple than many comparable names.
Simply Wall St’s Fair Ratio for Ericsson is 22.5x. This is a proprietary estimate of what a more tailored P/E might look like after considering factors such as earnings growth profile, profit margins, company size, industry and specific risks. Because it is built around Ericsson’s own fundamentals, the Fair Ratio can provide a more company specific anchor than a simple comparison with industry or peer averages, which may mix businesses with very different characteristics.
Comparing the current P/E of 13.8x with the Fair Ratio of 22.5x suggests the shares are screening as undervalued on this earnings based view.
Result: UNDERVALUED
 OM:ERIC B P/E Ratio as at Apr 2026
P/E ratios tell one story, but what if the real opportunity lies elsewhere? Start investing in legacies, not executives. Discover our 95 top founder-led companies.
Earlier it was mentioned that there is an even better way to understand valuation, so Narratives are introduced as a simple way for you to attach a clear story about Telefonaktiebolaget LM Ericsson to specific assumptions for future revenue, earnings, margins and fair value. You can then see how that story lines up with the current share price.
On Simply Wall St’s Community page, Narratives give you a structured template to set your own view, link it to a forecast and a fair value, and then compare that fair value with the live market price to see whether your story suggests the shares look cheap, expensive or roughly in line.
Narratives update automatically when fresh information such as earnings, news or price targets is added. This helps your fair value view stay current instead of being a one off spreadsheet exercise.
For Ericsson, one investor might anchor on a cautious story close to the bearish cohort with a fair value around SEK69.6, another might lean toward a more optimistic case closer to SEK121.0, and a third might sit near the consensus style midpoint. Each of these Narratives would translate those different expectations into a fair value that can be compared with the latest price to help decide whether to hold off, add or reduce exposure.
For Telefonaktiebolaget LM Ericsson we will make it really easy for you with previews of two leading Telefonaktiebolaget LM Ericsson Narratives:
Each one ties a clear story to explicit assumptions for revenue, margins and valuation, so you can see which version lines up more closely with your own expectations.
🐂 Telefonaktiebolaget LM Ericsson Bull Case
Fair value in this bullish narrative: SEK121.0
Implied difference to the last close of SEK104.5: about 13.6% below this fair value level
Revenue growth assumption: 2.57% per year
Assumes AI driven automation and higher value software and services support a richer earnings mix over time, even with some margin pressure.
Leans on themes such as secure communications, digital inclusion and mission critical networks to support a larger long term revenue base.
Uses a 2029 P/E assumption of 18.8x and a discount rate of about 6.5% to arrive at a fair value of SEK121.0, with analysts in this group seeing scope for a higher earnings multiple than today.
🐻 Telefonaktiebolaget LM Ericsson Bear Case
Fair value in this bearish narrative: SEK69.6
Implied difference to the last close of SEK104.5: about 50.2% above this fair value level
Revenue growth assumption: 2.07% decline per year
Frames Ericsson as facing sustained pressure from geopolitics, regulation and intense competition, with weaker pricing power and thinner margins.
Builds in falling revenue and profit margins over time, with 2029 earnings assumptions well below today and a revenue base that is modeled to contract.
Applies a 2029 P/E of 20.0x and a discount rate of about 6.6% to reach a fair value of SEK69.6, implying the current share price sits well above what these analysts think the business fundamentals support.
These two Narratives bracket a wide range of outcomes. This is exactly the point. You can place your own view somewhere along that spectrum and see how it compares with the current market price and the community consensus. See what the community is saying about Telefonaktiebolaget LM Ericsson
Do you think there’s more to the story for Telefonaktiebolaget LM Ericsson? Head over to our Community to see what others are saying!
OM:ERIC B 1-Year Stock Price Chart
This article by Simply Wall St is general in nature. We provide commentary based on historical data and analyst forecasts only using an unbiased methodology and our articles are not intended to be financial advice. It does not constitute a recommendation to buy or sell any stock, and does not take account of your objectives, or your financial situation. We aim to bring you long-term focused analysis driven by fundamental data. Note that our analysis may not factor in the latest price-sensitive company announcements or qualitative material. Simply Wall St has no position in any stocks mentioned.
Companies discussed in this article include ERIC-B.ST.
Have feedback on this article? Concerned about the content? Get in touch with us directly. Alternatively, email editorial-team@simplywallst.com