
In recent years, PhotoEmission Electron Microscopy (PEEM) has shown how magnetic domains and domain boundaries in a range of FM thin films, grown on BTO, evolve with an applied electric field6,7,19,20,21. In addition, PEEM together with Low-Energy Electron Microscopy (LEEM), enables detailed monitoring of thin film growth on BTO surfaces, allowing excellent control of interface composition and morphology. Here, we have successfully deposited epitaxial metallic Fe films on atomically clean (001) FE single-crystal surfaces of BTO. PEEM, combined with X-ray Magnetic Circular Dichroism (XMCD) allowed access to the Fe FM domain structure and PEEM combined with X-ray Linear Dichroism (XLD) allowed simultaneous access to the underlying BTO FEL domain structure. By interpreting the XMCD-PEEM images with a macrospin model and micromagnetic simulations, the value of shear-strain (B2) magnetoelastic constant has been determined.
The BTO surface exhibited a sharp (1 × 1) Low-Energy Electron Diffraction (LEED) pattern (figure SM1) after repeated cycles of oxygen-assisted annealing. Four samples were grown for the study. Sample A had a 2.2 nm Fe film grown on the BTO, whereas Sample B, C and D had 1.5 nm films with 2 nm Al caps to allow switching of the FE domains. Mirror Electron Microscopy (MEM) of the cleaned BTO surface revealed the presence of FEL and FE domains (figure SM3) demonstrating that the surface FE properties persisted after the surface preparation. Fe films were subsequently deposited in situ with X-ray Absorption Spectroscopy (XAS) indicating the growth of purely metallic Fe (figure SM5)22.
Figure 1 a shows an XLD-PEEM image of the Fe covered BTO surface recorded at the Ti L3-edge (figure SM4). The dark/light areas correspond to a1/a2 FEL domains with the domain boundaries running parallel to the \({[1\bar{1}0]}_{pc}\) direction21. The local c-axis of the FEL domains is indicated by the yellow arrows (figure SM6). Figure 1b shows an XMCD-PEEM magnetization vector map (see Supplementary Material V and figure SM7 and figure SM8), recorded at the Fe L3-edge, from the same area demonstrating that the Fe film FM domain structure reproduces the underlying BTO FEL domain structure. The angular distribution of the Fe magnetisation across the vector map is shown in Fig. 2a and indicates a predominant direction of 54° ± 3° for the blue areas, i.e. for the BTO a1 domains, and 129° ± 4° for the magenta areas, i.e. for the BTO a2 domains. The schematic in Fig. 2a shows the orientation of the BTO unit cell for each of the FEL domains so that it is straightforward to see that the local Fe spin-axis unexpectedly aligns close to the local BTO c-axis, confirming the presence of a strong local uniaxial magnetic anisotropy. Such an alignment is in stark contrast to the case for thicker Fe films grown on BTO7 which exhibit a perpendicular in-plane magnetic alignment with the local BTO c-axis.
Fig. 1: PEEM images of the FEL/FM striped domains.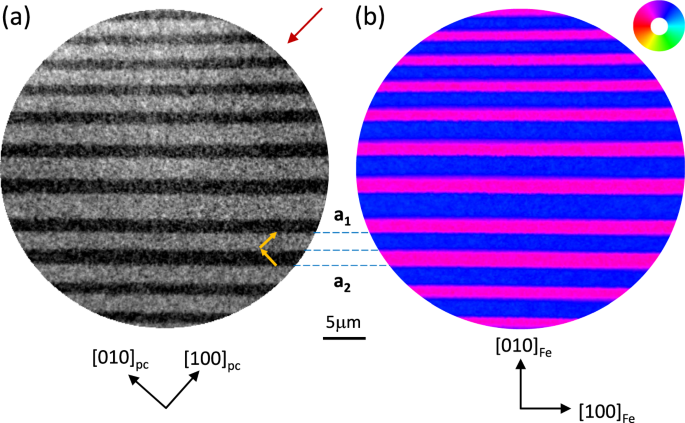
a XLD-PEEM image of the Fe/BTO surface recorded at the Ti L3-edge showing the FEL domain structure. The c-axes of the a1 and a2 FEL domains are shown as the yellow arrows and were determined using the angle-dependence of the XLD contrast. The red arrow indicates the in-plane projection of the incoming x-rays. b XMCD-PEEM vector magnetisation map recorded at the Fe L3-edge showing the FM magnetic domain structure of the Fe overlayer. The magnetization direction is represented by the colour wheel. The crystallographic directions are shown in black. The broken blue lines are guides to the eye linking the BTO a1 and a2 FEL domains with the corresponding Fe FM domains. (Data from Sample A).
Fig. 2: Angular distribution of the magnetization direction.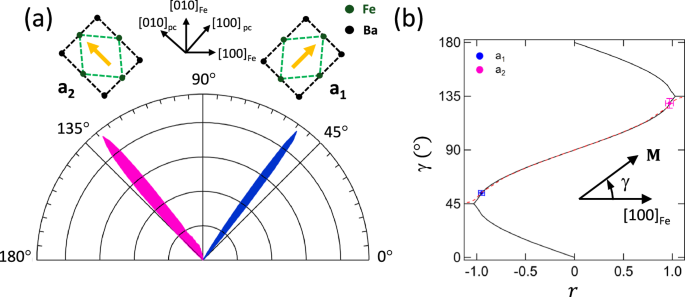
a Polar plot of the angular distribution of the local spin-axes extracted from the vector magnetisation map shown in Fig. 1b along with a representation of the corresponding Fe/BTO unit cells for the a1 and a2 FEL domains. The yellow arrows indicate the local c-axis direction. The crystallographic axes are shown in black along with the BTO pseudocubic (pc) and Fe unit cell orientations. b Stable values of the magnetization angle, γ, determined using a macrospin model (solid black line) and micromagnetic simulations (broken red line) as a function of r. The experimental values of γ, determined from the polar plot for the a1/a2 FEL domains, are marked as the solid blue/magenta squares. Error bars represent the FWHM of the polar plot peak widths. (Data from Sample A).
The MEL coupling of the Fe film, arising from the reduced dimensionality, can be developed in terms of a macrospin model and using micromagnetic simulations. Within a macrospin (single domain) approximation, the total MAE of a cubic system can be expressed in the form of a power series23 as the sum of a uniaxial MEL energy (Fme) and a cubic magnetocrystalline (MC) energy (Fmc) as
$${F}_{tot}={F}_{me}+{F}_{mc}={B}_{1}{\sum}_{i=j}{\epsilon }_{ij}{\alpha }_{i}^{2}+2{B}_{2}{\sum}_{i\ne j}{\epsilon }_{ij}{\alpha }_{i}{\alpha }_{j}+{K}_{1}{\sum}_{i\ne j}{\alpha }_{i}^{2}{\alpha }_{j}^{2}$$
(1)
where αi and αj are direction cosines of the in-plane magnetisation, M, ϵij are strain tensor components, B1 and B2 are the first order MEL constants, and K1 is the first order MC constant. We define the angle between M and [100]Fe as γ (hence α1 = cos(γ) and α2 = sin(γ)). The unpoled BTO substrate exhibited in-plane FEL a1 and a2 domains. Using bulk elastic stiffness values16, the Fe strain tensor ϵ has components ϵ11 = ϵ22 = −0.0112, ϵ33 = 0.013 and ϵ12 = ϵ21 which is 0.0055 for an a1 domain and -0.0055 for an a2 domain. Given that the magnetization is in-plane (α3 = 0) and that B1 is independent of γ, Ftot can be expressed in a compact form as
$${F}_{tot}={K}_{1}(r\,{\alpha }_{1}{\alpha }_{2}+{\alpha }_{1}^{2}{\alpha }_{2}^{2})\,,\qquad r=\frac{2{B}_{2}{\epsilon }_{12}}{{K}_{1}}$$
(2)
The stable minima, with respect to γ (figure SM9) arise from the competition between the shear-strain uniaxial and MC biaxial anisotropies and are plotted as a function of r in Fig. 2b. The magnetic anisotropy is uniaxial for r ≤ −1 (r ≥ 1), with the easy-axis aligned along [110]Fe(\({[\bar{1}10]}_{Fe}\)) yielding a2 (a1) FEL domains, and represents the case for strained Fe/BTO using bulk bcc-Fe values of K1 and B2 (K1 = 0.042 MJ/m3 and B2 = 7.83 MJ/m3 (i. e. ∣rbulk∣ = 2.1). For ∣r∣ < 1, the competition between the shear-strain MEL and MC anisotropies rotates the easy-axis of magnetisation from the in-plane < 100 > Fe directions to close to the <110> Fe directions as r changes from 0 to ± 1.
The values of γ for the a1(a2) FEL domains, determined from the polar plot, are marked as the solid squares in Fig. 2b and show that the measured local magnetisation direction is 8 ± 2° from the <110> Fe (\({ < \bar{1}10 > }_{Fe}\)) directions, implying a negative value of B2 and representing a significantly different MEL coupling in ultrathin Fe films grown on BTO compared to thicker films.
In order to take into account the dipolar interactions between the FM domains, micromagnetic simulations were performed. The dashed line in Fig. 2b shows the resulting stable minima using the bulk bcc-Fe value for K1 and assuming an initial Fe magnetic configuration with \({{{\bf{M}}}}\parallel {[\bar{1}\bar{1}0]}_{pc}\). Figure 2b shows good agreement between the dependence of r, with γ, extracted from the micromagnetic simulations and calculated using the macrospin model, with the exception of the transition regions (∣r∣ ≈ 1) where there is a small difference between the two curves. By averaging over the FEL domains, r is determined to be −/+ 0.97 ± 0.02 for the a1/a2 domains. However, quantitatively extracting the effects of shear strain from r requires an accurate determination of K1 which depends sensitively on film thickness24. To address this uncertainty, the changes in the Fe domain pattern with r can be explored using micromagnetic simulations, but then requires sharper domain features to uniquely evaluate both B2 and K1 from the domain pattern transfer.
Figure 3a shows an XLD-PEEM image with a pattern of dark/light areas arising from the a1/a2 FEL BTO domains, with long domain walls parallel to either \({[1\bar{1}0]}_{pc}\) or to [110]pc as observed for the FEL domains shown in Fig. 1a. The tapering of the FEL domain walls, also observed using MEM (figure SM3), is driven by strain minimisation25 at the boundaries between orthogonal FEL domains. The analysis of the contrast in the XLD-PEEM image confirms an in-plane orientation of the local FEL domain c-axis (shown as the yellow arrows). Figure 3b shows an XMCD-PEEM image of the same area as Fig. 3a with the contrast showing the projection of the local magnetisation onto the light propagation direction. Inside the tapered a2 domains, black and white regions with sharp boundaries arise from magnetic domains with head-to-head domain walls. Inside the a1 regions the XMCD contrast is grey, consistent with a magnetization direction perpendicular to the x-ray beam direction. The uniformity of the XMCD contrast suggests a strong uniaxial anisotropy within the FEL domains.
Fig. 3: PEEM images of the FEL/FM needle domains.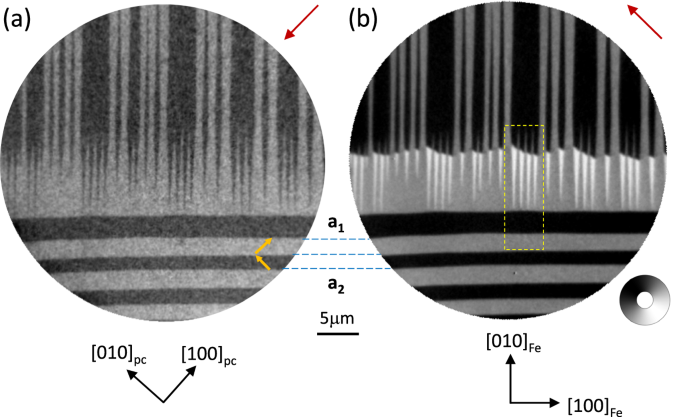
a XLD-PEEM image of the Fe/BTO surface recorded at the Ti L3-edge showing the FEL domain structure of an area where the DWs run along the [110]pc direction (top half) and meet DWs running along the \([1\bar{1}0]_{pc}\) direction (bottom half) forming a well-defined tapered FEL domain structure. The yellow arrows indicate the local BTO c-axis. b XMCD-PEEM image of the same area as (a) recorded at the Fe L3-edge showing the corresponding FM domains. The magnetisation direction is represented by the greyscale wheel. The crystallographic axes are shown in black and the in-plane projection of the incoming x-ray beam is shown by the red arrows. The broken yellow lines indicate the area compared to the micromagnetic simulations in Fig. 4a. (Data from Sample A).
To quantitatively understand the interfacial MEL coupling, micromagnetic simulations were performed with ∣r∣ = 0.97. By setting a uniform initial state with \({{{\bf{M}}}}\parallel {[\bar{1}\bar{1}0]}_{pc}\), the simulations converged to a domain structure which included the head-to-head DWs observed on the needle tip structures within the a2 FEL domains (see Fig. 4a). Figure 4b shows the corresponding simulated XMCD-PEEM image along with the corresponding experimental XMCD-PEEM image in Fig. 4c. The simulations also predict the formation of 180° DWs in the tapered a1 FEL areas which are not observed in the experimental XMCD-PEEM images due to the experimental geometry and the resolution limit of the field of view used. Reducing B2 to −0.2 MJ/m3 (whilst keeping r constant) results in a significant blurring of the FM domain structure (see Fig. 4d, e). By comparing the experimental and simulated XMCD-PEEM images for a range of B2 values, B2 is estimated to be −3 ± 1MJ/m3 with Msat = 1.76 MA/m (figure SM10) and 0.022 < K1 < 0.042 MJ/m3 (figure SM11) and represents the first quantitative determination of the interfacial shear strain MEL coupling in a FM thin film.
Fig. 4: Micromagnetic simulations of the PEEM images.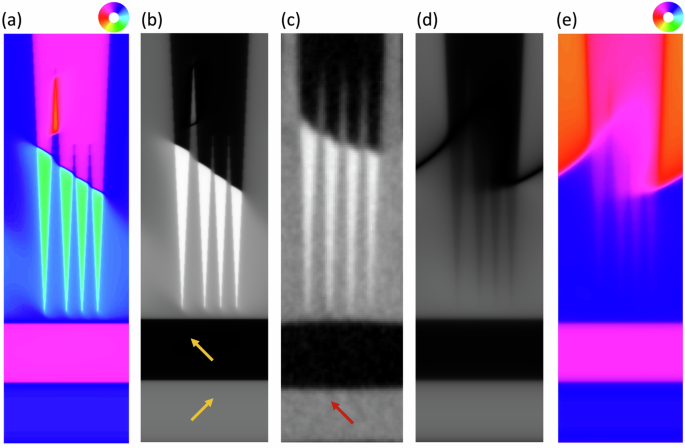
a Micromagnetic simulation of the Fe magnetic domains with B2 = −3 MJ/m3 (∣r∣ = 0.97) corresponding to the area shown by the broken yellow lines in Fig. 3b. The magnetisation direction is represented by the colour wheel. b Simulated XMCD-PEEM image for the domain structure shown in (a). The yellow arrows indicate the the local BTO c-axis. c Experimental XMCD-PEEM image of the tapered FM domains highlighted by the yellow broken-line box in Fig. 3b. The red arrow indicates the in-plane projection of the incoming x-rays. d Simulated XMCD-PEEM image and (e) corresponding magnetic domain structure for B2 = −0.2 MJ/m3 (∣r∣ = 0.97) showing the degraded transfer of the domains structure. The short side of the images is 4 μm.
Thin film MEL constants have also been determined using a Néel model with the addition of surface contributions to represent the MAE of a thin film16,17,26. Another possibility is to include higher order terms to the MAE24,27,28 using a strain-dependent effective MEL constant, B2,eff (figure SM12), which can reverse sign for thin films under strain. Although such a result might imply a negative value of B2 for the Fe/BTO structure here, the similarity between B2,eff and B2 is not direct and each coefficient describes distinct physical quantities. B2,eff is proportional to the anisotropic stress that a FM film exerts on a substrate as M is rotated in-plane, and represents the strain derivative of the MAE. Conversely the local direction of M, with the in-plane strain state determined by the epitaxial growth, is governed directly by the angular dependence of the MAE. We verified that adding the experimentally determined higher order terms to Fme did not have an effect on the easy-axis direction of the Fe thin film (figure SM12). The emergence of a negative value of B2 in Fe/BTO heterostructures then highlights the importance of epitaxial shear-strain in thin films which depends sensitively on factors such as morphology and interface quality16.
In order to further investigate shear strain effects on the ME coupling at the Fe/BTO interface, samples capped with 2nm of Al were prepared so that the BTO substrate could be poled by applying an electric field of 200 kV/m between the top and bottom sample. Once poled, the capped samples exhibit c domains for which the shear strain should be zero with only the MC anisotropy remaining. Figure 5a shows a composite XMCD-PEEM and XLD-PEEM image before poling (figures SM13 and SM15) with the local M at 58° ± 2° from the local BTO c-axis for the (blue) a2 FEL domains and 74° ± 1° from the local BTO c-axis for the (magenta) a1 FEL domains. This yields B2 = 2.5 ± 0.3 MJ/m3, which is significantly smaller than than the bcc-Fe bulk value with the change of sign, with respect to the uncapped Fe film, likely due to a large reduction of the shear strain due to the Al capping layer. Figure 5b shows a composite image with a c domain, created after poling (40 MV/m) the sample. The XMCD-PEEM vector map shows that the introduction of the FEL c domain precipitates a concomitant reorientation of the local Fe magnetisation (figures SM14 and SM16). Figure 5c shows the angular distribution of M in the XMCD-PEEM vector map, before and after poling, indicating that the ME coupling on the a2 domain remains largely unaffected. Conversely, the Fe magnetisation is almost parallel to the [010]Fe direction in the vicinity of the new FEL c domain. Poling the BTO substrate therefore demonstrates that, in the absence of a local shear strain, only the MC anisotropy remains relevant which aligns M close to the expected bulk bcc-Fe easy axes (table SM1). Ferromagnetic resonance (FMR) performed on sample D yielded a value of B2, lower than that for bulk bcc-Fe, but compatible with the PEEM results (figure SM17).
Fig. 5: Poling the BTO substrate.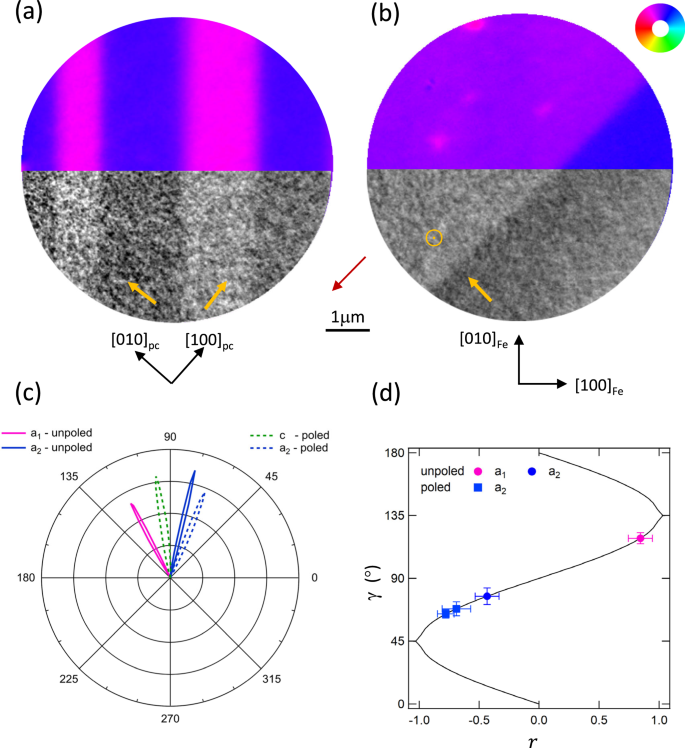
Composite images of the (a) unpoled and (b) poled Al/Fe/BTO surface comprising an XMCD-PEEM vector map of the Fe magnetization (top half) and XLD-PEEM of the FEL domains (bottom half). The red arrow represents the in-plane projection of the x-ray beam. The FEL domain c-axis orientation is indicated in yellow for each domain and the magnetization direction is represented by the colour wheel. The crystallographic axes are shown in black. c Polar plot of the magnetization angle, γ, distribution for the unpoled (solid lobes) and poled (broken lines) states. d γ as a function of r for stable minima of the magnetic free energy (solid black line). The experimental values of γ, determined from the polar plot, are marked as circles/squares for the unpoled/poled states and as magenta/blue symbols for the a1/a2 FEL domains. Error bars represents the FWHM of the magnetization distribution peaks. (Data from Sample C).
Shear strain effects at a FM-FE interface have been quantified using FEL and FM domain structures in Fe ultrathin films grown on BTO using polarized x-ray based PEEM imaging. The Fe film exhibits strain-mediated FEL-FM domain transfer down to the smallest resolvable features (200 nm). The sharp alignment of the local Fe magnetisation direction with the local FEL c-axis, combined with micromagnetic simulations, enabled the detection of a change in magnitude and sign of the MEL coupling constant, B2, with respect to thicker Fe films or films with an Al capping. Our results reveal new routes to understanding MEL coupling in composite heterostructures which combine inverse magnetostriction in thin FM films with shear strain effects from epitaxial growth.