
Study patients and data sources
We implemented a multicentre, prospective cohort study in Nantong City (31°41′−32°42′N, 120°11′−121°54′E), a city in eastern China’s Jiangsu Province that administers four counties (Rudong, Rugao, Hai’an, and Qidong) [13]. The study sample was derived from four county-level hospitals: Affiliated Rudong Hospital of Xinglin College, Nantong University; Affiliated Rugao Hospital of Xinglin College, Nantong University; Hai’an People’s Hospital; and Third People’s Hospital of Qidong.
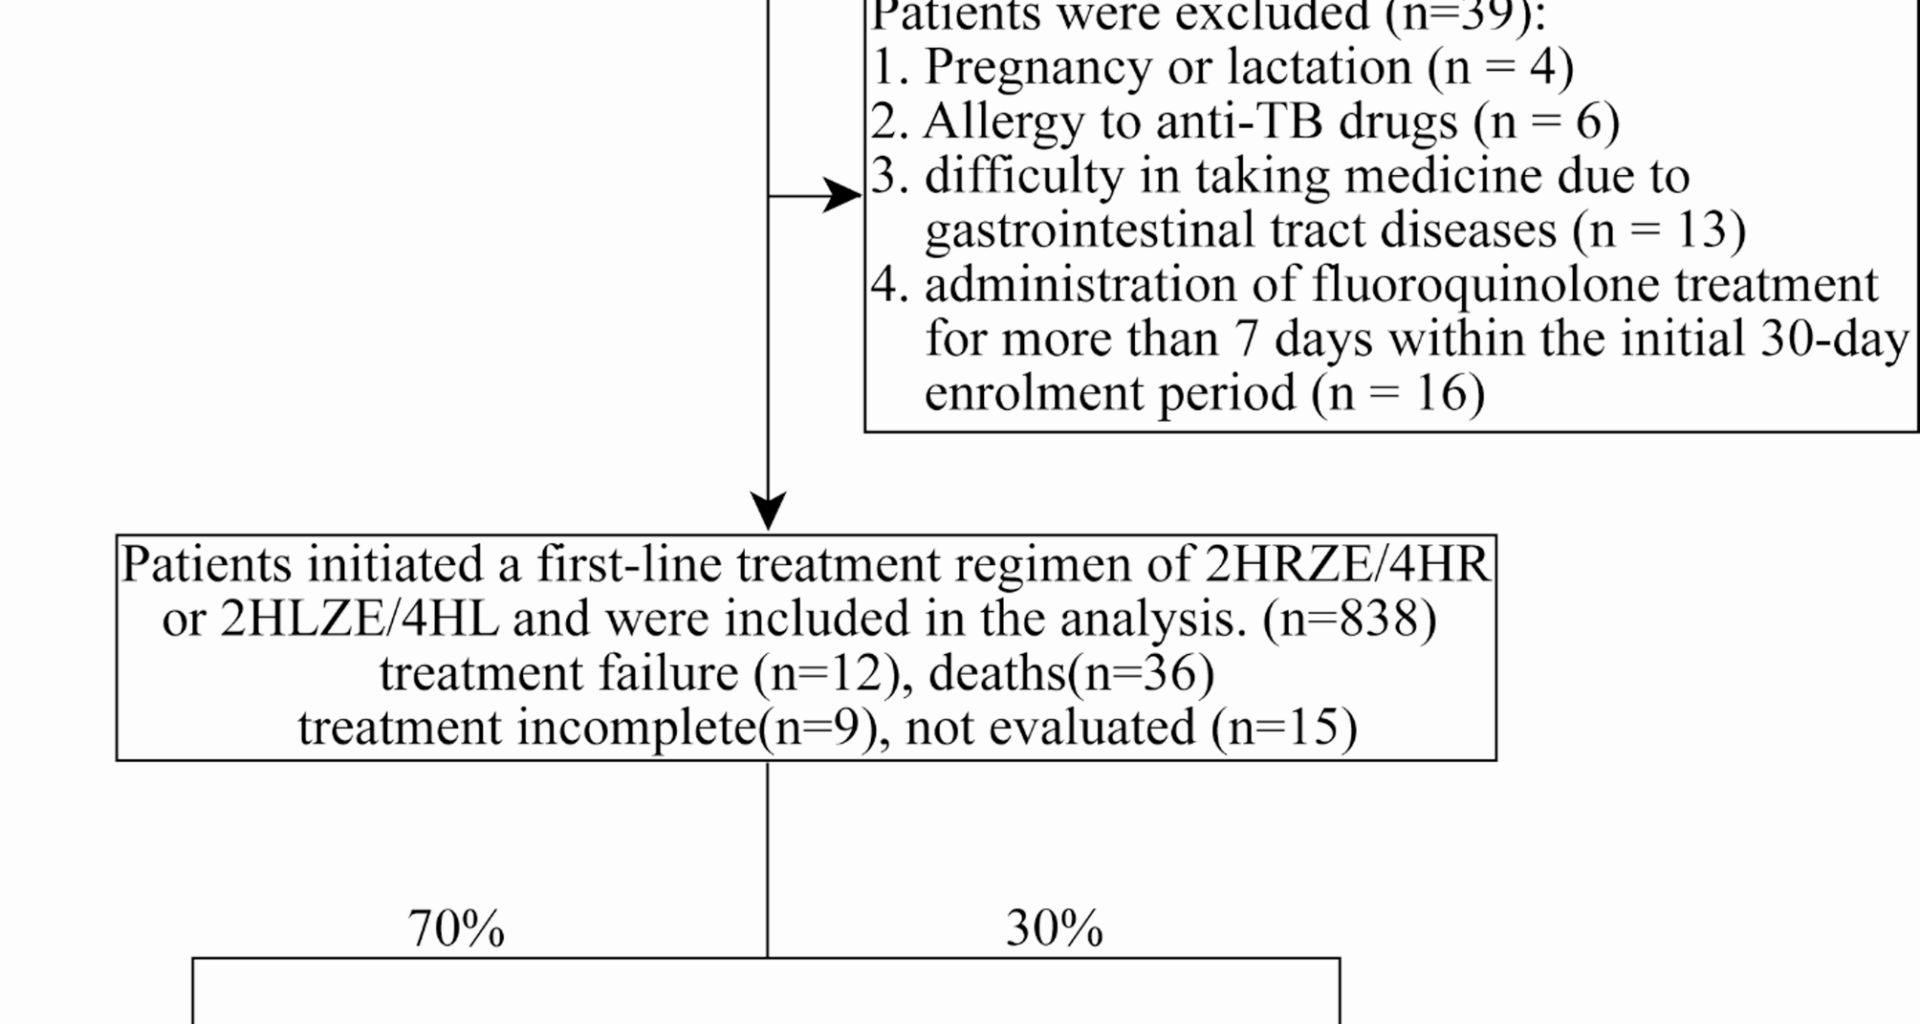
We prospectively screened 877 PTB patients from April 1, 2021, to December 31, 2022, and followed up to June 30, 2023. The enrollment included all tuberculosis patients, comprising confirmed cases and clinically diagnosed cases. Diagnostic methods include bacteriological methods (including sputum smear microscopy, bacterial culture, and molecular diagnostic methods), tuberculin skin testing (TST), T-cell spot assay for tuberculosis (T-SPOT) in combination with epidemiological history, clinical symptoms, chest imaging, and other relevant auxiliary tests [14, 15]. Patients with extrapulmonary tuberculosis (EPTB) were excluded. Also, all screened patients are required to demonstrate either a positive result for acid-fast bacilli on smear microscopy or a medium/high-positive result on Xpert MTB/RIF nucleic acid amplification testing, meeting smear-positive diagnostic criteria [16]. The inclusion criteria were as follows: (1) residents living in four counties; (2) age ≥ 18 years; (3) newly diagnosed TB (both confirmed and clinically diagnosed); (4) DS-TB. Exclusion criteria were: (1) pregnancy or lactation; (2) allergy to anti-TB drugs; (3) difficulty in taking medicine due to gastrointestinal tract diseases; (4) administration of fluoroquinolone treatment for more than 7 days within the initial 30-day enrolment period. A total of 39 (4.4%) patients were excluded. Finally, 838 PTB patients were initiated on first-line anti-TB regimen, consisting of 2-month isoniazid, rifampin or rifapentine, pyrazinamide, and ethambutol, followed by 4-month isoniazid, rifampin or rifapentine (2HRZE/4HR or 2HLZE/4HL), and were subsequently included in the prediction model.
All data were recorded in the electronic TB surveillance system of the Nantong Centre for Disease Control. In this study, we primarily collected patients’ demographic data, including age, gender, and body mass index (BMI), as well as clinical data. Clinical data encompassed comorbidities, smoking and drinking history, sputum smear grades, routine blood test, blood biochemistry test, lung computed tomograph (CT), diagnosis and treatment outcomes.
Definitions of outcomes and variables
TB treatment outcomes were classified according to the WHO guidelines as follows: successful outcomes (cured; treatment completion; treatment success) and unsuccessful outcomes (treatment failure; death; treatment incomplete; not evaluated) [17]. “Unsuccessful treatment” comprised treatment failure (sputum smear or culture remained positive at month 5 or later during 6-month treatment or a new regimen was adopted), death (died for any reason during 6-month treatment), treatment incomplete (TB treatment interrupted for at least two consecutive months), and not evaluated (lost to follow-up) [17, 18].
Logistic regression was used to identify risk factors for unsuccessful treatment outcomes. A total of 14 variables are involved, and the definitions of some are as follows. Diabetes was defined as self-reported history of diabetes, or fasting plasma glucose ≥ 126 mg/dL after no caloric intake for at least 8 h, or 2-h plasma glucose ≥ 200 mg/dL during oral glucose tolerance test, or glycated hemoglobin ≥ 6.5%. Hypertension was defined as blood pressure ≥ 140/90 mmHg. The patients’ personal medical histories were checked for the presence or absence of chronic lung disease, chronic liver disease, cancer, smoking and alcohol use. Chest CT was utilized to detect cavitation. The detailed variables are provided in Table 1.
Table 1 Variables and assignmentsModel development and validation
The data were randomly partitioned by using the Fixed Random Seed method in R software version 4.3.1 (R Foundation for Statistical Computing, Vienna, Austria), with 70% of the total data allocated to a training set and the remaining 30% reserved for a validation set. The training set was used to develop the prediction model within the final logistic regression, and the validation set was used to evaluate its performance.
The variables to be incorporated into the final logistic regression model were carefully selected through forward and backward stepwise selection procedures, with Akaike Information Criterion (AIC) as the stopping rule. A nomogram was formulated based on the outcomes of logistic analysis. Subsequently, we validated the prediction model by examining both nomogram discrimination and calibration using the validation set. To evaluate model discrimination, we calculated the area under the receiver operating characteristic curve (AUC). The Hosmer-Lemeshow goodness-of-fit test was used to evaluate the calibration curves. Decision curve analysis (DCA) helps to determine the net benefit of using the model at different threshold probabilities, providing insights into whether the model can improve clinical decision-making. All statistical analyses were carried out with the utilization of Stata 18.0 (StataCorp LLC, TX, USA) and R software version 4.3.1. P-value < 0.05 were defined as statistically significant.