
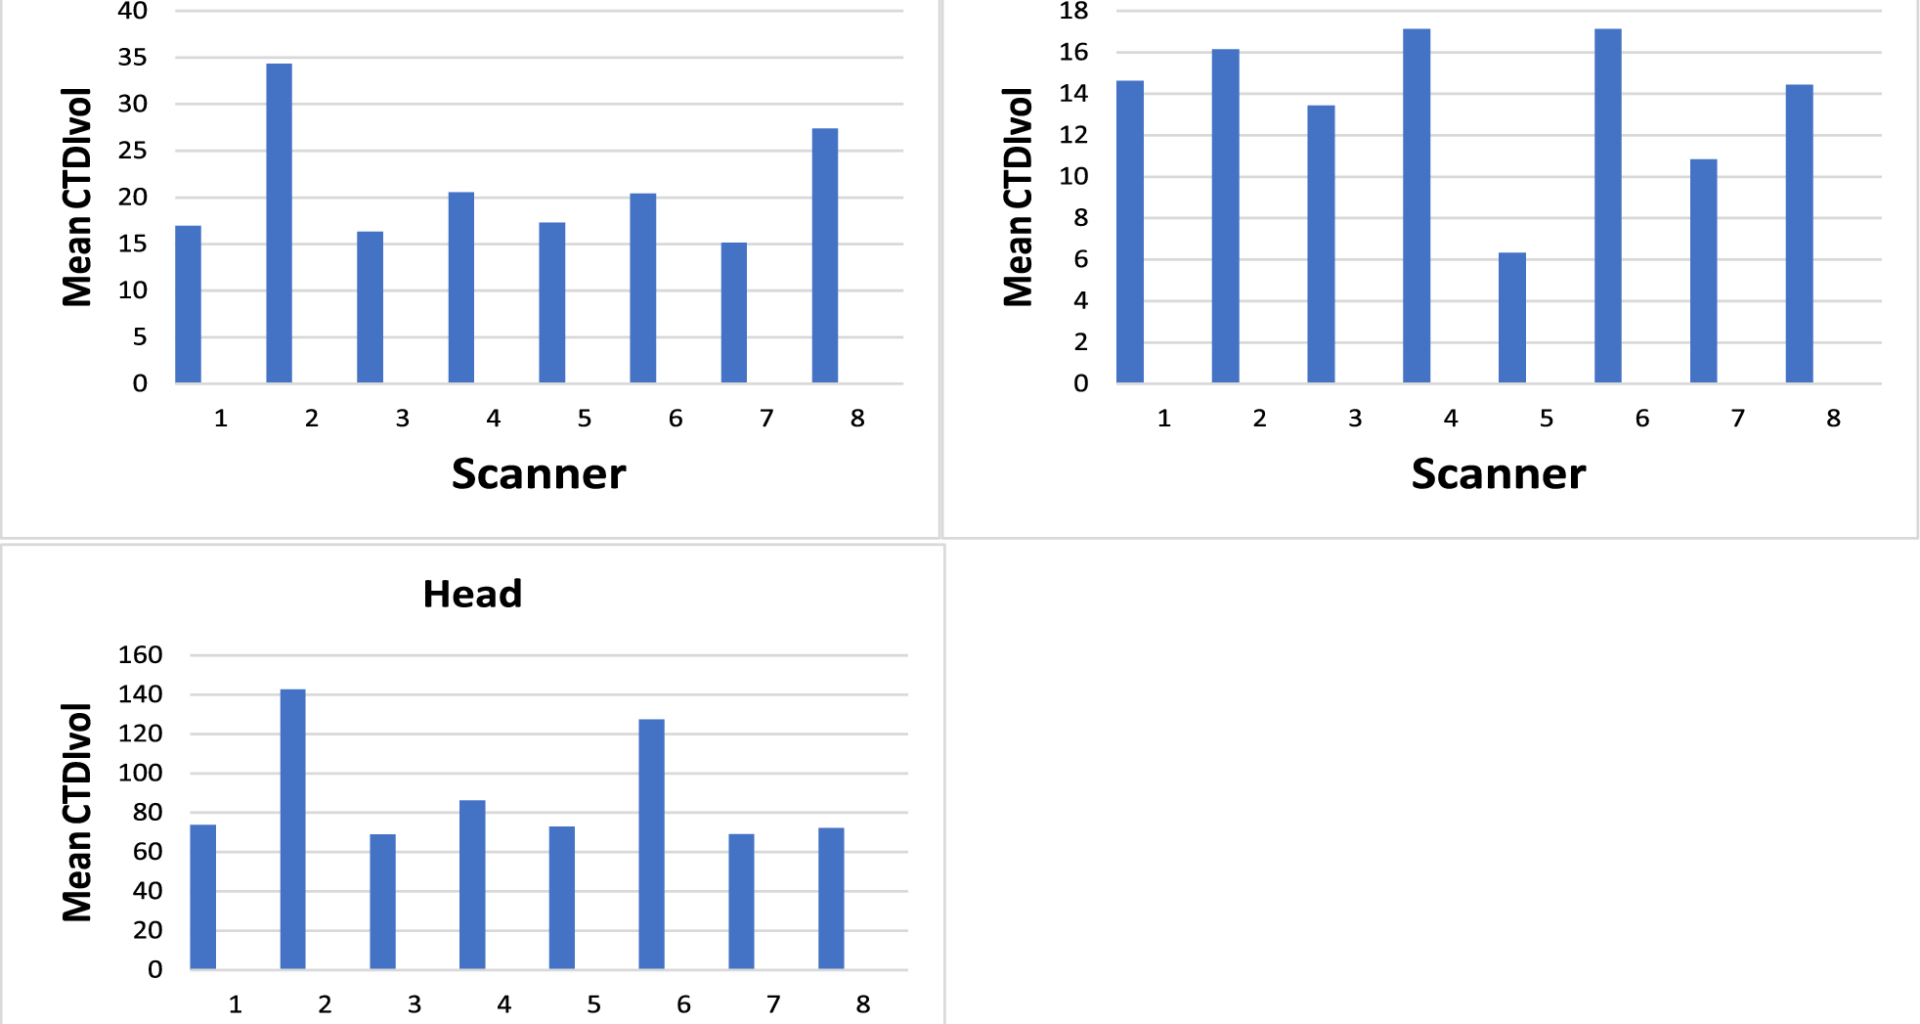
Upon examining the mean values across facilities, significant differences were observed in brain CT examinations, particularly in the DLP, with the most substantial disparity between the minimum and maximum dose values Fig. 2. In contrast, the variation in brain CTDIvol values was minimal, with the mean maximum and minimum recorded at 68 and 142 mGycm Fig. 1. The noticeable discrepancy in brain CTDIvol, especially between scanners Toshiba 16 and Siemens 64, can be attributed to differences in brain CT scan protocols. For example, Toshiba 16 CT scanner used an average of 173 mAs, while Siemens 64 CT scanner employed 111 mAs for brain examinations. Even among scanners of the same brand, such as Philips 64-slice scanners, variations in DLP were noted. The largest dose difference was observed in the brain CT protocol between GE 16 and Siemens 16. Both scanners were of the same slice number, yet GE 16 used 165 mAs, while Siemens 16 used 250 mAs, contributing to the observed difference in DLP (Figs. 1 and 2).
Fig. 1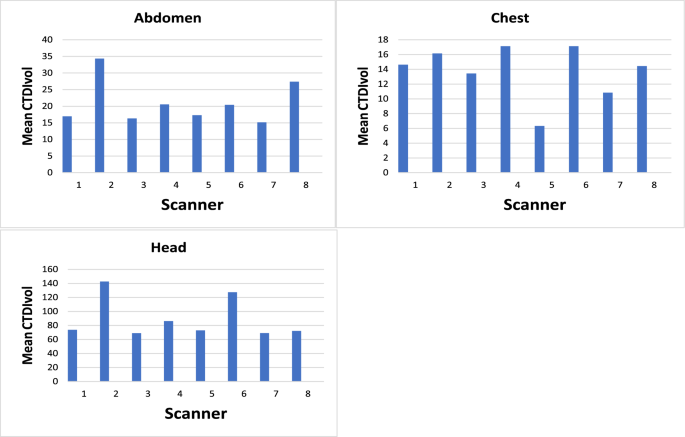
Comparison between CTDIvol of different scanners
Fig. 2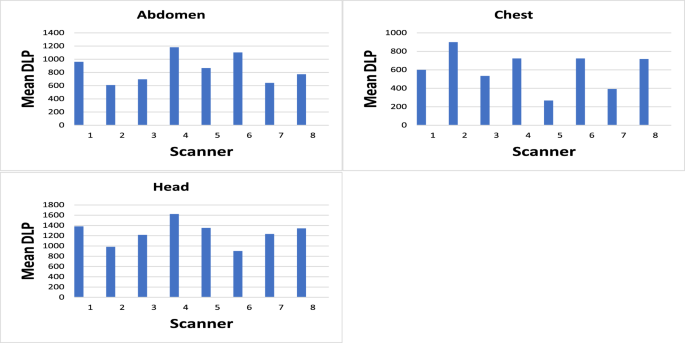
Comparison between DLP of different scanners
In the case of CT chest, the 75th percentile of the median DLP value significantly exceeded those of all countries in Table 4, registering at 662 mGy.cm, with proximity to Japan and Canada. Conversely, the 75th percentile of the median CTDIvol (16 mGy) closely approximated the values for Japan and Australia (15 mGy) [14] (Table 4). Similarly, for CT brain, the 75th percentile CTDIvol (76 mGy) surpassed values from other studies except Canada and Japan, while the 75th percentile of the median DLP (1320.2 mGy.cm) slightly exceeded Japan’s (1350 mGy.cm) [14], attributed to differences in scan length. Regarding CT abdomen, the 75th percentiles of the median for CTDIvol (23 mGy) and DLP (1010 mGy.cm) surpassed those of Portugal and India [9, 10].
Table 4 Comparison with other studies
Figures 3, 4 and 5 present a juxtaposition of DRL, revealing substantial elevations compared to international standards Table 4. The premise underlying the studies mentioned below is that CT examinations conducted in northern Jordanian hospitals warrant reassessment for dose optimization. This, however, necessitates a nuanced consideration of multiple variables, encompassing the make and version of CT scanners, patient dimensions across various nations, image quality, (kVp) settings, slice thickness, and the approach to statistical analysis.
Fig. 3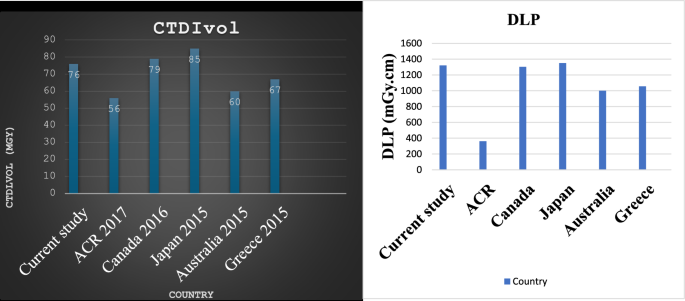
Comparison of CTDIvol (mGy) for brain with other studies
Fig. 4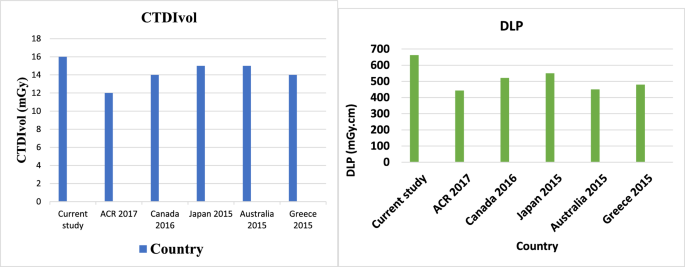
Comparison of DLP (mGy.cm) for chest with other studies
Fig. 5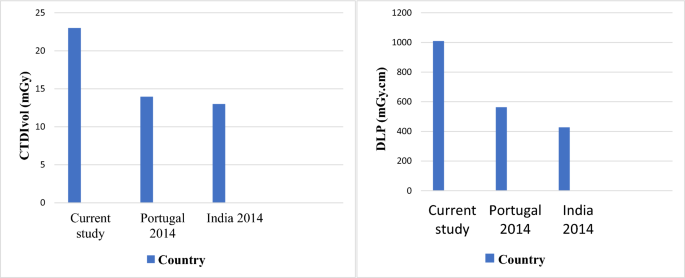
Comparison of CTDIvol (mGy) and DLP (mGy.cm) for abdomen examination with other studies
Variability in radiation dose could occur due to differences in scanner manufacturing and examination protocols, as noted in previous studies [3, 6, 13]. Moreover, the data collection did not consider the study indications, potentially influencing scan parameters and consequently affecting the results of DLP. Additionally, the statistical analysis did not incorporate patient weight as this information is typically not documented by radiology technologists during procedures.
Table 4 presents the comparison between current results and DRL from other nations. While the median DRL values for chest CT and brain CT align within acceptable ranges compared to national DRL Table 4, the median value of dose descriptors for abdomen CT surpasses those of other studies listed in Table 4. Median CTDIvol and DLP values were 19.5 mGy and 863 mGy.cm, respectively, exceeding those for CT abdomen in Portugal and India (13.9 mGy, 562.7 mGy.cm, and 13 mGy, 427 mGy.cm). Consistent findings arise when comparing 75th percentile of the median values with international DRLs. For CTDIvol, brain CT, chest CT, and abdomen CT exhibit doses of 76, 16, and 24 mGy, respectively. Correspondingly, DLP values stand at 1420 mGy.cm, 531 mGy.cm, and 863 mGy.cm. Both CTDIvol and DLP DRL are higher than those of all countries.