
Theory of space-time merons in momentum-energy space
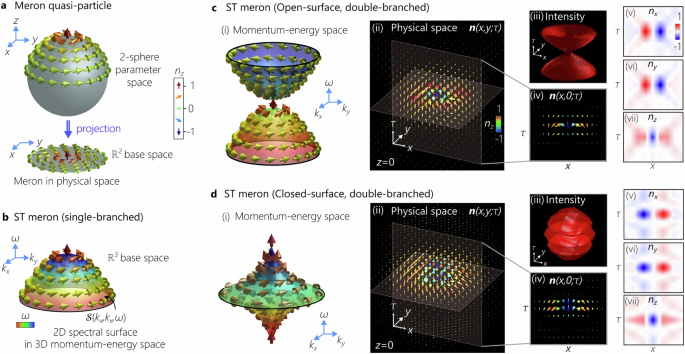
Skyrmions are represented by a continuous three-component unit vector field n(r) = (nx(r), ny(r), nz(r)) on a unit two-sphere parameter space; where r = (x, y, z) and x2 + y2 + z2 = 1. These configurations are distinguished by a non-zero topological Skyrmion number N14, which quantifies the number of times n(r) wraps around the unit sphere. Merons, or half-skyrmions, carry a skyrmion number \(N=\pm \frac{1}{2}\), indicating that n(r) covers only half the unit sphere, from the north pole to the equator (Fig. 1a). The meron texture is explicitly given in polar coordinates by: \({{{\bf{n}}}}(\rho,\phi )\,=\,\frac{1}{\sqrt{{\zeta }^{2}+{\Delta }^{2}}}\left\{\rho \cos (\phi+\gamma ),\rho \sin (\phi+\gamma ),\Delta \right\}\); where \(\rho \,=\,\sqrt{{x}^{2}+{y}^{2}},\quad \phi=\arg (x+iy)\), the parameter Δ specifies the meron radius, and the helicity γ ∈ ( − π, π] determines the chirality of the spin texture, which gives rise to a classification of merons into Néel-type (γ = 0) and Bloch-type (γ = ±π/2)14. Previous experimental realizations of optical skyrmions have relied on one of three strategies for mapping the vector n(r) to physical quantities45: (1) mapping n(r) to the normalized electric field vector6; (2) mapping n(r) to time-averaged spin vector7,22; and (3) mapping n(r) to the normalized Stokes vector in paraxial optical fields24,25,27,46. Whereas the first and second approaches all three field components and are thus associated with non-paraxial fields (for example, surface plasmon polaritons), we make use of the third approach, which is more suitable for transportable beams in paraxial optics. All these demonstrations were realized by mapping the 3D vector field n(r) from the parameter space to a flat 2D surface disk in \({{\mathbb{R}}}^{2}\) as a base space (real space), via a Hopf mapping (hopfions) or a stereographic projection (2D skyrmions)14; see Fig. 1a.
In contrast, here we make use of a curved 2D spectral surface \({{{\mathcal{S}}}}({k}_{x},{k}_{y},\omega )\) as a base space in the \({{\mathbb{R}}}^{3}\) momentum-energy domain of a pulsed optical field in narrowband paraxial regime (Fig. 1b–d); where kx and ky are the transverse components of the wave vector, and ω is the temporal frequency. We map the meron texture from the hemisphere in parameter space to the Stokes vector on \({{{\mathcal{S}}}}({k}_{x},{k}_{y},\omega )\), such that \({{{\bf{n}}}}({{{\bf{r}}}})\,=\,\left({s}_{1}({{{\bf{r}}}}),{s}_{2}({{{\bf{r}}}}),{s}_{3}({{{\bf{r}}}})\right)\); here s1, s2, and s3 are normalized Stokes parameters. Scalar optical fields restricted to simple 2D spectral surfaces are known as STWPs30,47, whose characteristics are useful for a variety of applications30,31. First, note that a one-to-one relation enforced between the transverse radial wave number \({k}_{r}\,=\,\sqrt{{k}_{x}^{2}\,+\,{k}_{y}^{2}}\) and the temporal frequency ω leads to diffraction-free propagation30, thus potentially enabling the transportation of localized topological structures over extended distances47. Moreover, when the space-time coupling takes the form of a paraboloid \(\frac{\Omega ({k}_{r})}{{\omega }_{{{{\rm{o}}}}}}\,\approx \,\frac{{k}_{r}^{2}}{2{k}_{{{{\rm{o}}}}}^{2}(1-c/\widetilde{v})}\) (Fig. 1b), the optical wave packet travels rigidly at a controllable group-velocity \(\widetilde{v}\) in linear optical media32,33; here ωo is a carrier frequency, \({k}_{{{{\rm{o}}}}}\,=\,\frac{{\omega }_{{{{\rm{o}}}}}}{c}\) is the associated wave number, c is the speed of light in vacuum, and Ω = ω − ωo (Fig. 1b). The spatiotemporal spectrum of an azimuthally symmetric STWP can be represented by \(\widetilde{E}({k}_{r},\Omega )\,=\,\widetilde{E}({k}_{r})\delta (\Omega -\Omega ({k}_{r}))\), where \(\widetilde{E}({k}_{r})\) is the spatial spectrum, and the delta function is relaxed in practice and replaced with a narrowband spectral function33. After incorporating the meron polarization texture, the spatiotemporal spectrum of such ST merons in the circular polarization basis is: \(\widetilde{{{{\bf{E}}}}}({k}_{r},{\phi }_{k},\Omega )\,=\widetilde{E}({k}_{r},\Omega ){[\sin \frac{\theta ({k}_{r})}{2},-{e}^{i\chi ({\phi }_{k})}\cos \frac{\theta ({k}_{r})}{2}]}^{{{{\rm{T}}}}}\); here, “T” is the transpose operation, \(\theta \left({k}_{r}\right)\,=\,\pi -\arccos \frac{\kappa }{\sqrt{{k}_{r}^{2}+{\kappa }^{2}}}\), \(\chi \left({\phi }_{k}\right)\,=\,{\phi }_{k}+\gamma -\pi\), and \({\phi }_{k}\,=\,\arg ({k}_{x}+i{k}_{y})\) (see Supplementary Note I), and we set γ = π/2 to produce a Bloch-type topological structure. The vectorial field profile in physical space takes the form \({{{\bf{E}}}}(r,z;\tau )\,\propto \,\iint \,d{k}_{r}d\Omega \,\,\,{k}_{r}\widetilde{{{{\bf{E}}}}}({k}_{r},\Omega ){J}_{0}({k}_{r}r){e}^{-i\Omega \tau }\,=\,{{{\bf{E}}}}(r,0;\tau )\), where J0( ⋅ ) is the 0th-order Bessel function of the first kind33, and \(\tau \,=\,t-z/\widetilde{v}\) is a time frame moving at the group velocity \(\widetilde{v}\).
Using the single-branched paraboloidal spectral surface as a building block, we construct complex surface geometries by modifying the space-time coupling function Ω(kr). We consider two such spectral structures: an open-surface double-branched paraboloid \(\Omega ({k}_{r})\,=\,\pm (a{k}_{r}^{2}+b)\), (Fig. 1c), and a closed-surface spinning-top \(\Omega ({k}_{r})\,=\,\pm (\frac{a}{{k}_{r}}+b)\) (Fig. 1d); where a and b are positive real constants. The meron texture here is the same on both branches of these surfaces in momentum-energy space (Fig. 1c, d, panel (i)). In principle, however, independent spin profiles could be prescribed on the two branches to explore other skyrmionic structures. The structure of the ST merons in physical space E(x, y, z; τ) is calculated via a 3D Fourier transform (at z = 0). First, the 3D structure of the unit vector n(x, y, z; τ) for both ST merons reveals non-trivial Stokes vector distributions localized in the 3D space-time volume of the wave packet; see Fig. 1c, d, panel (ii). This is in striking contrast with the spectral distributions in momentum-energy space, where the Stokes vector is distributed over only the surface \({{{\mathcal{S}}}}({k}_{x},{k}_{y},\omega )\). The 3D plots of the intensity isosurface I = 0.1 (after normalizing the intensity to unity) in panel (iii), reveal that the ST meron corresponding to the closed spectral surface is more localized (Fig. 1d), whereas the open-surface ST meron shows the characteristic X-shaped structure of free-space STWPs (Fig. 1c)30,47. To clearly visualize the spatiotemporal structure of the polarization texture in physical space, we plot the Stokes vector n(x, y = 0, z = 0; τ) in panel (iv), and the projections nx, ny, and nz in panels (v–vii) in the 2D space-time plane (x, τ). These plots reveal a swerve of the Stokes vector in the ST meron on a spatial scale smaller than the beam size, and on a shorter temporal scale than the pulse width, corresponding to the sub-wavelength spatial features of 2D skyrmions in evanescent fields22.
Experimental setup
The key to successfully synthesizing ST merons in momentum-energy space is twofold: sculpting a spectral surface \({{{\mathcal{S}}}}({k}_{x},{k}_{y},\Omega )\) through introducing a space-time coupling Ω(kr) into a pulsed optical field, and exercising high efficiency, point-by-point control over the polarization profile on this spectral surface. This task is particularly challenging in the case of a closed spectral surface. Our strategy for synthesizing ST merons from a generic optical pulse follows the four-stage scheme illustrated in Fig. 2a, comprising: (1) spectral analysis; (2) spectral transformation; (3) coordinate transformation; and (4) spin-texture implementation. To construct a prescribed spectral surface, the first step is to spatially resolve the incoming spectrum (spectral analysis). At this point, the field is endowed with linear spatial chirp x1(Ω), whereby the frequencies are arranged in a fixed sequence along the x1 axis (inset I). Realization of a prescribed spectral surface (such as that in Fig. 1b) requires arranging the frequencies in a particular sequence x1(Ω) → x2(Ω) (spectral transformation). Moreover, achieving double-branched open or closed spectral surfaces (Fig. 1c, d) necessitates a two-to-one spectral mapping ±x1 → x2, thereby re-positioning two spectral lines at two distinct locations at the input to one location at the output, which is in contrast to previous realizations of optical conformal mappings that have all been one-to-one. The result is two precisely overlapped spatially resolved spectra with opposite chirp rates x2(∣Ω∣) that were initially contiguous (inset II). The last step for constructing the spectral surface \({{{\mathcal{S}}}}({k}_{x},{k}_{y},\Omega )\) is the coordinate transformation that maps the rectilinear chirp x2(∣Ω∣) into a radial chirp r(∣Ω∣); i.e., lines corresponding to different wavelengths at the input are converted into circles at the output plane (inset III). Finally, imprinting the meron polarization texture onto the radially resolved spectrum generates the ST meron in momentum-energy space (inset IV).
Fig. 2: Schematic of the experimental setup to synthesize and characterize ST merons.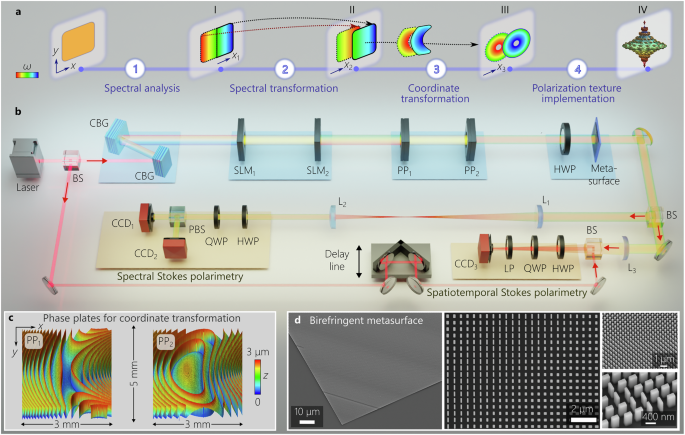
a Evolution of the field structure through four stages of the ST meron synthesis system. b Experimental setup for synthesizing and characterizing ST merons. In the first stage, the spectral components of an incoming ultrafast pulse are spatially separated via a pair of chirped volume Bragg gratings (CBGs) to introduce a linear spatial chirp x1(Ω) (inset I in a). In the second stage, a two-to-one spectral transformation ∣x1∣ → x2 implemented via a pair of spatial light modulators (SLMs) maps a pair of spectral lines at the transverse positions ± x1 to the same transverse position x2, producing two spatially overlapping spectra x2(∣Ω∣) (inset II in b). A conformal coordinate transformation stage (implemented by a pair of phase plates PP1 and PP2) transforms the linear chirp into a radial chirp r(∣Ω∣) (inset III in a). A birefringent metasurface then imparts the target Stokes vector n(r(Ω)) to the radially spread spectrum (inset IV in a). The spatiotemporal structure of the ST meron is characterized in the spectral domain (after the 4f-system comprising lenses L1 and L2) via spectral Stokes polarimetry, and in real space (after the Fourier-transforming lens L3) by performing spatiotemporally resolved Stokes polarimetry. c Surface profilometry micrographs of the central part of the phase plates (PP1 and PP2). d Scanning electron microscope (SEM) micrographs of the birefringent dielectric metasurface at different spatial scales. HWP half-wave plate, QWP quarter-wave plate, PP phase plate, CCD charge-coupled device, LP linear polarizer, BS beam splitter.
The setup for synthesizing ST merons from a generic optical pulse is depicted in Fig. 2b. Starting with linearly polarized pulses from a mode-locked Ti:Sapphire laser of width 100 fs, central wavelength λo ≈800 nm, bandwidth Δλ ≈10 nm, and beam width ≈3 mm, the spectrum is spatially resolved (spectral analysis) via a pair of chirped volume Bragg gratings (CBGs)48. The first CBG spatially spreads the spectrum (spatial chirp) of the obliquely incident pulse, but simultaneously stretches the pulse in time (temporal chirp). A second identical but reversed-orientation CBG eliminates the temporal chirp while doubling the spatial chirp (see Methods)33.
The second stage comprises a pair of spatial light modulators (SLMs) that impart two phase distributions to implement an afocal conformal spatial transformation from the input plane x1 to the output plane x2 = f(x1)49,50. Because the spectrum is spatially resolved at its input plane x1(Ω), such a spatial transformation corresponds to a spectral transformation. This mapping modifies three aspects of the resolved spectrum. First, it pre-compensates for unwanted scaling that occurs in a subsequent stage (coordinate transformation). Second, it enables the realization of any prescribed spectral structure in real time by tuning the transformation function f(x1). Third, it allows us to implement a two-to-one spectral mapping x2(∣Ω∣), thus producing the surfaces in Fig. 1c, d. To perform this mapping, two phase distributions are concatenated on the first SLM to map the two halves of the input field in the input plane onto the same spatial domain in the output plane f(∣x1∣), and the two phase patterns at the output plane are interleaved on the second SLM (Supplementary Note II.B). Consequently, each position in the output plane is now associated with two wavelengths, i.e., x2(Ω) = x2(−Ω), whereas each position in the input plane was associated with one wavelength x1(Ω). This is a key attribute needed for constructing two-branched spectral surfaces in momentum-energy space.
In the third stage (coordinate transformation), a pair of phase plates implements another conformal mapping in the form of a log-polar coordinate transformation that maps each vertical line at its input plane into a circle at its output49,51. Restricting the implementation of such a coordinate transformation to two phase plates (rather than three or more) necessitates exponentiating the radial coordinate at the output plane49, which is pre-compensated by introducing the logarithmic scaling in the preceding spectral transformation stage, as discussed above. The conjunction of spectral and spatial transformations produces two spatially overlapping spectra that are spread radially with oppositely signed radial chirps r(∣Ω∣); see Supplementary Note II.C. Success in producing closed spectral surfaces in momentum-energy space is hindered by an intrinsic feature of the log-polar coordinate transformation; namely, a singularity at the center of the second phase distribution that leads to a null at the center of the spatiotemporal spectrum at kr = 0. Minimizing the singularity region while remaining in the paraxial regime necessitates fabricating large-area phase plates (14 × 14 mm2 here), which are produced using an analog photolithographic process52 (Fig. 2c and Supplementary Note II.C).
Lastly, realizing the meron polarization texture requires a wavefront shaping platform that imparts a point-by-point birefringent response. Dielectric metasurfaces are an ideal candidate for this task by virtue of their sub-wavelength resolution, compact footprint, and highly efficient polarization-dependent modulation of the phase and amplitude at each point in an optical field by utilizing form birefringence, while operating away from resonances to mitigate errors arising from fabrication inaccuracies53,54,55. We introduce the metasurface at this point in the synthesis procedure to impart to the incident linearly polarized, spatially resolved double-spectrum a spatially varying polarization profile corresponding to the polarization texture of a meron. The large area of the phase plates used in the coordinate transformation stage necessitates, in turn, fabricating a record-size metasurface comprising ≈ 109 unit cells of 520 × 520 nm2 area each, containing an 800-nm-tall nanofin of TiO2 on a SiO2 substrate. The geometry of each meta-atom in the metasurface is tuned to achieve form birefringence (Fig. 2d). We adopt a phase-retrieval-like algorithm53,54,56,57 to realize the requisite far-field complex amplitude profiles for two orthogonal polarization components58, which yields the requisite parameters of each unit cell. The metasurface was produced via standard planar fabrication processes (see Methods), and the measured spatially resolved Stokes parameters confirm that it imparts the target polarization texture (Supplementary Fig. S11). Finally, a Fourier-transforming lens converts this double-valued spatially resolved spectrum endowed with polarization texture from momentum-energy space (kx, ky, ω) to physical space spanned by (x, y, z; τ).
Measurement results
We carried out the measurements for the two ST merons in Fig. 1c, d: the open-surface ST meron with a spatiotemporal spectrum comprising oppositely oriented paraboloids of revolution (Fig. 3), and the closed-surface ST meron with the spectrum that takes the shape of a spinning-top (Fig. 4). Switching between these two spectral surfaces and modifying their parameters requires only changing the SLM phase distributions in the spectral transformation stage.
Fig. 3: Characterizing an ST meron whose polarization distribution is imprinted on a two-sheet paraboloid spectral surface.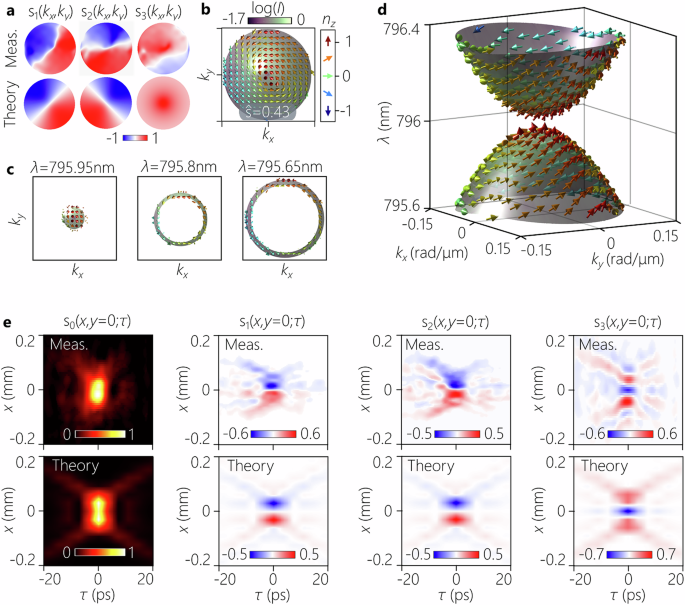
a Measured (top row) and calculated (bottom row) spectral Stokes parameters s(kx, ky) in (kx, ky)-space (integrated over all temporal frequencies ω). b A plot of the Stokes vector distribution (arrows) reconstructed from the measurements in (a), overlaid with the measured spectral intensity profile I(kx, ky) measurements (colormap). c Cross-sectional plots of b at different iso-frequency planes corresponding to λ = 795.95, 795.8, and 795.65 nm. d Measured Stokes vector n(kx, ky, λ) (arrows) plotted in the 3D spatiotemporal spectral domain (momentum-energy space), plotted over the ST spectral surface overlaid with the measured spectral intensity profile I(kx, ky). e Spatiotemporal Stokes parameters (s0, s1, s2, s3) at a fixed axial plane z = 0, where s0 corresponds to the total intensity. The panels are plotted in the (x, τ) plane corresponding to y = 0. The first row presents the measurements and the second row the corresponding theoretical predictions. In d the measured temporal bandwidth is Δλ ≈0.8 nm, and the spatial bandwidth is Δkr ≈0.18 rad/mm; in e the measured pulse width at the beam center is Δτ ≈6 ps, and the beam size at the pulse center is Δx ≈56 μm.
Fig. 4: Characterization of an ST meron whose polarization texture is imprinted on a spinning-top spectral surface.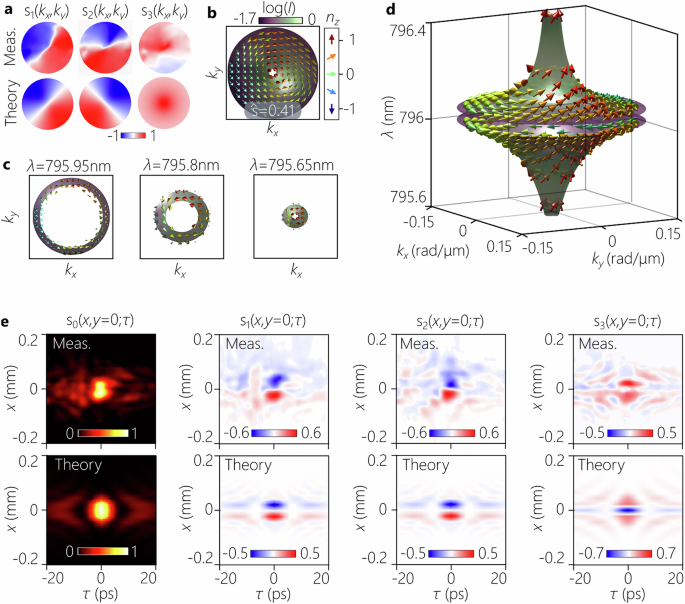
a Measured (top row) and calculated (bottom row) spectral Stokes parameters s(kx, ky) in (kx, ky)-space. b A plot of the Stokes vector (arrows) reconstructed from the measurements in a, overlaid with the measured spectral intensity profile I(kx, ky) measurements (colormap). c Cross-sectional plots of b at different iso-frequency planes corresponding to λ = 795.95, 795.8, and 795.65 nm. d Measured Stokes vector n(kx, ky, λ) (arrows) plotted in the 3D spatiotemporal spectral domain (momentum-energy space), plotted over the ST spectral surface overlaid with the measured spectral intensity profile I(kx, ky). e Spatiotemporal Stokes parameters (s0, s1, s2, s3) at a fixed axial plane z = 0, where s0 corresponds to the total intensity. The panels are plotted in the (x, τ) plane corresponding to y = 0. The first row presents the measurements and the second row the corresponding theoretical predictions. In d the measured temporal bandwidth is Δλ ≈ 0.8 nm, and the spatial bandwidth is Δkr ≈0.17 rad/mm; in e the measured pulse width at the beam center is Δτ ≈6.6 ps, and the beam size at the pulse center is Δx ≈63 μm.
We first characterize the polarization texture of ST merons in momentum space (kx, ky) by spatially resolved Stokes polarimetry carried out before the Fourier-transforming lens L3 in Fig. 2b, which reveals the momentum-space Stokes parameters si(kx, ky), i = 1, 2, 3 (Figs. 3a, 4a). From these measurements, we construct the polarization distribution n(kx, ky) for two ST merons (arrows in Figs. 3b, 4b) and plot them overlaying the measured spectral intensity I(kx, ky) (colormap in Figs. 3b, 4b). From these measurements, we extract Skyrmion numbers of N = 0.41 and N = 0.42 for the open- and closed-surface ST merons, respectively, which are close to the target value of N = 0.416 (see Supplementary Note III.C). An additional measurement of the correlation between the radial wave number \({k}_{r}\,=\,\sqrt{{k}_{x}^{2}+{k}_{y}^{2}}\) and the temporal frequency ω allows us to isolate the wavelength dependence of these Stokes parameters (Figs. 3c, 4c), thereby enabling the reconstruction of the ST meron polarization structure over the entire spectral surface (Figs. 3d, 4d); see Supplementary Note III.
In addition, we have characterized the polarization texture of the ST merons in physical space by measuring the spatiotemporally resolved Stokes parameters after the Fourier-transforming lens L3 via linear interferometry (Fig. 2b). The ST meron synthesis setup is placed in one arm of a Mach-Zehnder interferometer, and the initial 100-fs pulses are employed as a reference that traverses an optical delay line τ placed in the other interferometer arm. The visibility of the spatially resolved interference fringes recorded by a camera placed in the common path helps reconstruct the spatiotemporal intensity profile of the ST meron at a fixed relative delay τ40. Sweeping the delay line τ thus yields the full spatiotemporally resolved intensity profile I(x, y, z; τ) at the observation plane z = 0 (Figs. 3e, 4e, s0(x; τ)). The visibility of the interference fringes is maximized only after projecting the combined light fields onto one polarization state. Therefore, by repeating the procedure for different polarization components, we retrieve the spatiotemporally resolved Stokes parameters sj(x, y, z = 0; τ) for the ST merons, j = 1, 2, 3. (Figs. 3e, 4e). We plot the 2D intensity profiles and the Stokes parameters in the (x, τ)-plane corresponding to y = 0 for clarity, as we have done in Fig. 1c, d, without loss of crucial information. These measurements are in good agreement with the theoretical predictions plotted in Figs. 3e, 4e (second row), corresponding to s1, s2, and s3. The measured spatiotemporal evolution of polarization texture is observed within a localized region of ≈ 6 ps temporal width and ≈60 μm transverse spatial width. It is clear that ST merons with an identical topological polarization structure in momentum-energy space (produced by the metasurface) can be endowed with distinct spatiotemporal polarization configurations in physical space by virtue of the modified spectral surface (Figs. 3d, 4d). This suggests that ST merons may enable on-demand modulation of the spatial distribution of Stokes vector at ultrafast speeds within a localized transverse space, which may be useful for optical sensing and data storage applications45. Note that the spatiotemporal profile of the open-surface ST meron is X-shaped, as it is characteristic of STWPs in free space (Fig. 3e), and that of the closed-surface ST meron is circularly symmetric with respect to space and time, which is characteristic of closed spatiotemporal spectral supports (Fig. 4e), as recently verified for the restricted-dimensional case of light sheets37.