
Introduction to the ‘pMSBOS-TS’ CDSS
In our previous work, we introduced an AI algorithm named ‘precision maximum surgical blood ordering schedule-thoracic surgery (pMSBOS-TS)’28. This extreme gradient-boosting model precisely predicts the demand for red blood cells (RBC) in thoracic surgery patients. This algorithm demonstrates promising performance in improving both the efficient use of blood products and patient safety by reflecting patient-specific decision processes. We developed an AI-powered CDSS using this model as the reasoning engine. The output of the pMSBOS-TS CDSS includes the predicted blood requirement AI outcome value, SHAP and a clinical explanation of the top three features from the SHAP value (Fig. 4).
Fig. 4: Configuration of the output section of the pMSBOS-TS CDSS (Reused with permission from the authors’ prior work: Hur et al.28).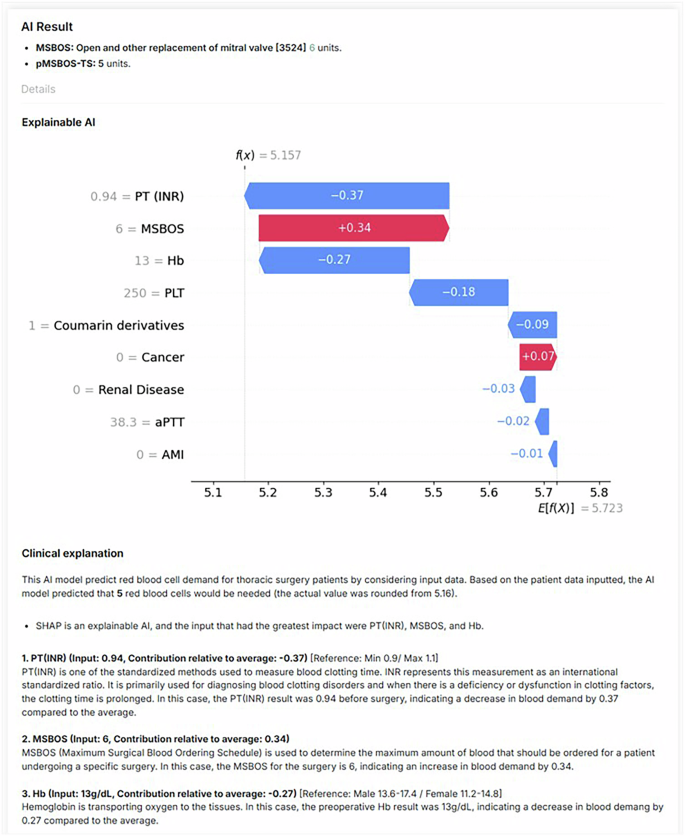
Abbreviations: AMI acute myocardial infarction, aPTT activated partial thromboplastin time, Hb haemoglobin, MSBOS maximum surgical blood order schedule, PT (INR) prothrombin time-international normalised ratio.
Study setting
The simulation study was conducted at a tertiary academic hospital in Seoul, Republic of Korea. The inclusion criteria were surgeons and physicians who had prescribed any blood product before surgery within the past 5 years. This recruitment criterion was intentionally set to ensure participants could make realistic and clinically meaningful judgements in perioperative transfusion scenarios presented through the vignettes, based on their direct clinical experience. Clinicians without experience in prescribing blood products were excluded.
The sample size was calculated using G*Power software (version 3.1.9.7)29, considering that participants would repeatedly evaluate all three methods. An initial sample size of 55 participants was calculated based on an moderate effect size (F) of 0.20, a significance level (α) of 5%, a power (β) of 0.9, correlation among repeated measures of 0.50 and assuming perfect sphericity (ε = 1.0). Considering a dropout rate of 20%, the final target sample size was 66.
Study protocol and vignette experiment
Eighteen distinct clinical vignettes were created, simulating patients scheduled for thoracic surgery. Our study employed a repeated-measures, within-subject experimental design, wherein each participant experienced all three experimental conditions: (1) Results Only (RO), (2) Results with SHAP visualisations (RS) and (3) Results with SHAP visualisations and Clinical explanations (RSC). Specifically, each participant reviewed six distinct vignettes per condition, totalling 18 vignettes per participant. For each vignette, participants initially estimated the number of RBC packs required, then made a final decision after reviewing the advice from the CDSS presented in one of the three explanation formats.
To minimise potential order effects30, such as learning or fatigue, we employed a systematically counterbalanced design (Fig. 5). Participants were randomly assigned to one of six groups, each experiencing the three explanation conditions in a different sequence. After reviewing each condition (block of six vignettes), participants completed questionnaires measuring trust, satisfaction and usability related to the CDSS explanation method they had just experienced. This process was repeated until all three conditions were completed.
Fig. 5: Counterbalancing study design to control order effect.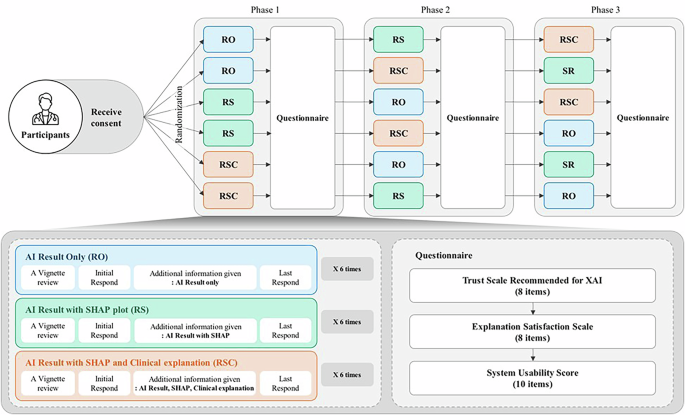
Participants were randomly assigned to one of six groups, each experiencing the three explanation conditions in a different sequence. After reviewing each condition (block of six vignettes), participants completed questionnaires measuring trust, satisfaction and usability related to the CDSS explanation method they had just experienced.
Upon completing the study, participants were compensated with 50,000 Korean won (approximately $36). The compensation was determined based on our institutions’ standard practice and the average hourly rate for clinicians’ time.
Outcomes
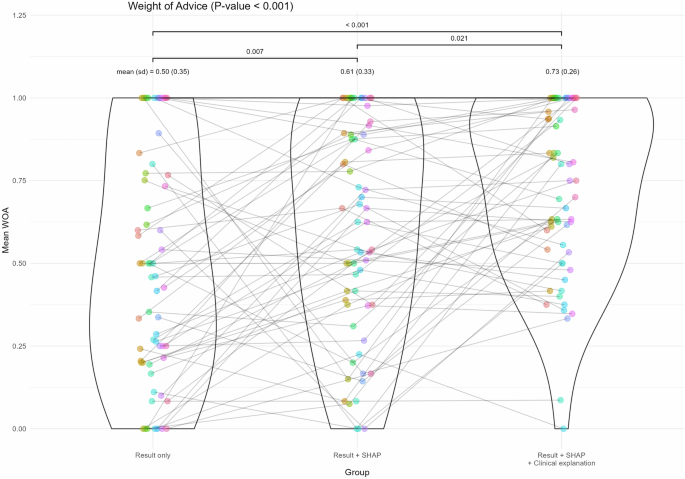
The primary outcome was the WOA, which measures the degree of acceptance of decision-making before and after receiving CDSS suggestions16.
The formula for calculating WOA is as:
$$WOA{=}\frac{{|}{F}{i}{n}{a}{l}\,{e}{s}{t}{i}{m}{a}{t}{e}{-}{I}{n}{i}{t}{i}{a}{l}\,{e}{s}{t}{i}{m}{a}{t}{e}{|}}{{|}{A}{d}{v}{i}{c}{e}{-}{I}{n}{i}{t}{i}{a}{l}\,{e}{s}{t}{i}{m}{a}{t}{e}{|}}$$
In this calculation, if the initial estimate equals the value obtained by the algorithm, the denominator becomes zero and the WOA cannot be calculated; therefore, it is excluded from the analysis and the average for each part is derived. The WOA ranges from 0 to 1, where 0 implies that the initial and final estimates are identical, indicating that the CDSS does not influence the decisions. In cases where the WOA value was >1 (e.g. when the initial estimate was 3, the AI’s advice was 5, while the clinicians’ final estimation was 7, resulting WOA of 2), the WOA is capped at 1, indicating full acceptance of the AI’s advice.
The secondary outcomes were trust, satisfaction and usability, measured using the ‘Trust Scale Recommended for XAI’, ‘Explanation Satisfaction Scale’ and SUS, respectively17,31. All instruments used in this study were rated on a 5-point Likert scale.
An additional exploratory outcome, termed the ‘mean absolute decision change’ was proposed as a post-hoc measure to evaluate decision changes even in cases where WOA was not calculable. This index was defined as the mean absolute difference between each participant’s final and initial decisions.
Statistical analysis
First, for each type of AI advice, the mean WOA was calculated for each participant. Trust and satisfaction with the explanations were scored based on individual items using the respective instruments. Additionally, the SUS score was computed for each type of AI advice.
The differences between the types of AI advice were tested accordingly. Considering that all participants were required to respond to all three types of AI advice, the data comprised repeated measures. Given that the assumptions of normality and homogeneity of variance were not met for all variables, the Friedman test was applied as a nonparametric alternative to assess the differences. When significant differences were confirmed, a post-hoc Conover test was conducted to identify specific group differences. A p value of 0.05 was used to determine the statistical significance of all analyses.
Then, we applied a repeated-measures correlation (RMCORR) to examine the relationships between acceptance and trust, explanation satisfaction and usability18.
Explorative descriptive subgroup post-hoc analysis were conducted. Participants were stratified according to the clinician experience level (resident, fellow, faculty member) and the clinical department (surgical department, internal medicine, emergency medicine and miscellaneous department). Within each subgroup, we re-examined the WOA as well as trust, explanation satisfaction and usability. Additionally, the mean absolute decision change was analysed as a post-hoc measure, allowing inclusion of previously excluded cases due to identical initial estimates and AI advice.
All statistical analyses were performed using R software (version 4.1.1; R Core Foundation, Vienna, Austria)32.
Ethics declarations
The study protocol was reviewed and approved by the Institutional Review Board of Samsung Medical Centre (approval No. 2023-09-123). Written informed consent was obtained from all the participants.