
Principle of the experiment
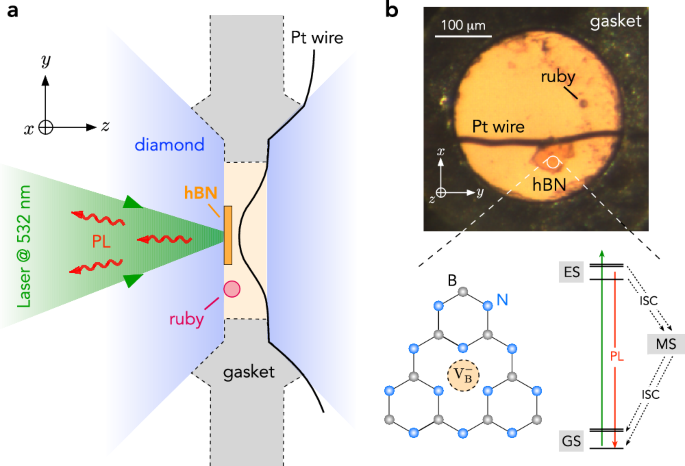
We start by studying how the optical and spin properties of \({{{\rm{V}}}}_{{{\rm{B}}}}^{-}\) centers in hBN evolve with pressure. To this end, we rely on a monoisotopic h10BN crystal in which \({{{\rm{V}}}}_{{{\rm{B}}}}^{-}\) centers are created through neutron irradiation27,28,29 (Methods). As sketched in Fig. 1(a), a piece of this bulk hBN crystal is loaded into the sample chamber of a membrane-driven DAC, which is defined by a hole drilled in a rhenium gasket that is compressed by two opposing diamond anvils. The sample chamber is filled with a pressure-transmitting medium, consisting of NaCl or Daphne oil30, to provide a quasi-hydrostatic pressure environment and a ruby crystal is used as a local pressure gauge31 (see Supplementary Fig. 1). The optical response of \({{{\rm{V}}}}_{{{\rm{B}}}}^{-}\) centers under pressure is studied at room temperature with a scanning confocal microscope employing a green laser excitation, a long-working distance objective with a numerical aperture NA = 0.42 and a photon counting module (Methods). To perform ODMR spectroscopy, a microwave excitation is applied through a platinum wire crossing the DAC chamber [Fig. 1(b)].
Optical properties of \({{{\rm{V}}}}_{{{\rm{B}}}}^{-}\) centers in hBN under pressure
Photoluminescence (PL) raster scans of the neutron-irradiated hBN crystal recorded at different pressures are shown in Fig. 2a. The PL signal of \({{{\rm{V}}}}_{{{\rm{B}}}}^{-}\) centers is drastically reduced with increasing pressure and becomes almost undetectable above 7 GPa [Fig. 2b]. This behavior is confirmed by measurements of PL spectra, which feature the characteristic broadband emission of \({{{\rm{V}}}}_{{{\rm{B}}}}^{-}\) centers in the near infrared with an intensity decreasing with pressure [Fig. 2c]. The process is reversible, the PL signal being recovered when pressure is released. To gain insight into the mechanism underlying this pressure-induced PL quenching, the lifetime of the \({{{\rm{V}}}}_{{{\rm{B}}}}^{-}\) center’s excited state was measured using a pulsed laser source. After optical excitation, the relaxation of \({{{\rm{V}}}}_{{{\rm{B}}}}^{-}\) centers is dominated by non-radiative decay channels involving intersystem crossing (ISC) to a metastable state [Fig. 1b]. These processes lead to an excited-state lifetime on the order of ~1 ns under ambient conditions, the precise value of which depends on the density of \({{{\rm{V}}}}_{{{\rm{B}}}}^{-}\) centers, the quality of the hBN crystal and the method used to create \({{{\rm{V}}}}_{{{\rm{B}}}}^{-}\) centers32,33,34,35. In our neutron-irradiated hBN crystal, the excited-state lifetime is around 0.6 ns under ambient conditions. Time-resolved PL decays recorded at different pressures indicate that the excited-state lifetime is significantly reduced with increasing pressure [Fig. 1d]. A quantitative analysis of this effect can hardly be performed since the PL decay of \({{{\rm{V}}}}_{{{\rm{B}}}}^{-}\) centers cannot be distinguished from the instrument response function (IRF) of our photon counting module ( ~300 ps) for pressure above 2 GPa. However, these measurements clearly indicate that pressure-induced PL quenching is linked to an enhancement of non-radiative decay rates in the optical cycles of \({{{\rm{V}}}}_{{{\rm{B}}}}^{-}\) centers.
Fig. 2: Optical properties of \({{{\rm{V}}}}_{{{\rm{B}}}}^{-}\) centers in hBN under hydrostatic pressure.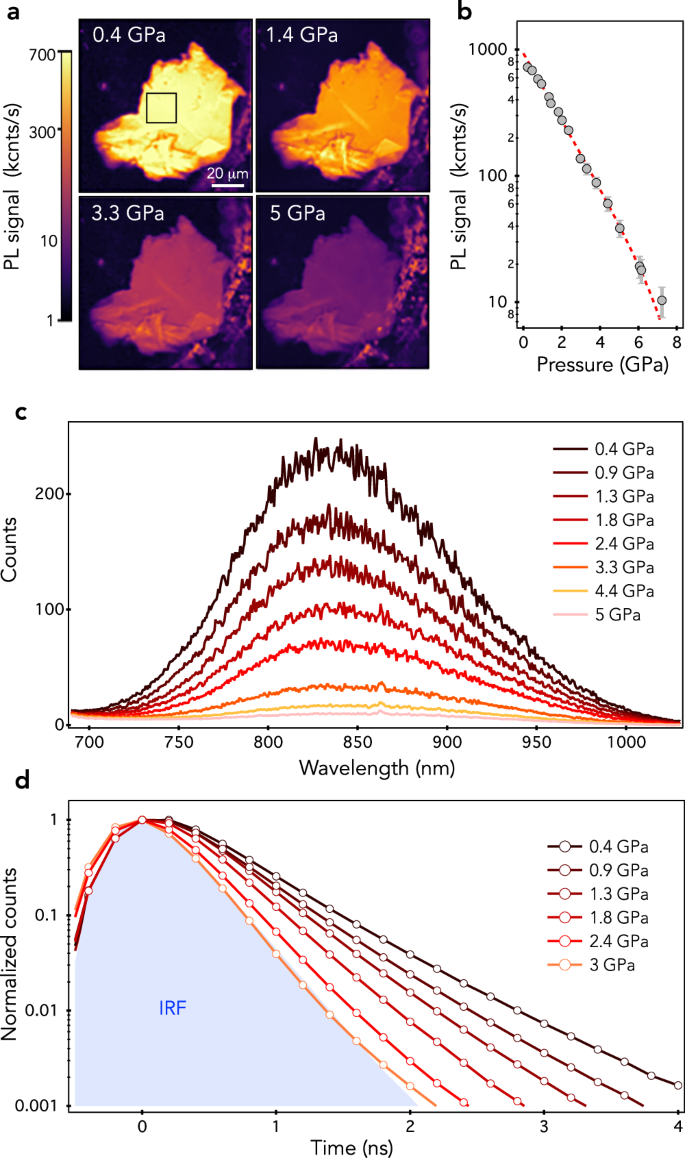
a PL raster scans of the hBN crystal recorded at different pressures using a green laser power of 1 mW. b PL signal averaged within the black square shown in (a) as a function of pressure. The error bars correspond to one standard deviation uncertainty. c Series of PL spectra and (d) time-resolved PL decays of \({{{\rm{V}}}}_{{{\rm{B}}}}^{-}\) centers recorded at different pressures. The shaded area in (d) corresponds to the instrument response function (IRF) of the photon counting system measured with 60-ps laser pulses.
Electron spin properties of \({{{\rm{V}}}}_{{{\rm{B}}}}^{-}\) centers in hBN under pressure
We then investigate the impact of hydrostatic pressure on the spin triplet ground state (S = 1) of the \({{{\rm{V}}}}_{{{\rm{B}}}}^{-}\) center, whose Hamiltonian is expressed in frequency units as
$$\hat{{{\mathcal{H}}}}={D}_{0}{\hat{S}}_{z}^{2}+E({\hat{S}}_{x}^{2}-{\hat{S}}_{y}^{2})+{\hat{{{\mathcal{H}}}}}_{{{\rm{s}}}}\,,$$
(1)
where \(\{{\hat{S}}_{x},{\hat{S}}_{y},{\hat{S}}_{z}\}\) are the dimensionless electron spin operators. The first term describes the spin-spin interaction that leads to an axial zero-field splitting D0 ~3.47 GHz at ambient pressure between the \(\left\vert {m}_{s}=0\right\rangle \) and \(\left\vert {m}_{s}=\pm 1\right\rangle \) spin sublevels18, where ms denotes the electron spin projection along the c axis (z) of the hBN crystal. The second term results from the coupling of the \({{{\rm{V}}}}_{{{\rm{B}}}}^{-}\) center with a local electric field produced by surrounding charges22,36,37. As sketched in Fig. 3a, this interaction mixes the \(\left\vert {m}_{s}=\pm 1\right\rangle \) spin sublevels, leading to new eigenstates \(\left\vert \pm \right\rangle \) separated by an orthorhombic splitting 2E, whose amplitude is linked to the volumic density of charges in the hBN crystal that increases with the density of \({{{\rm{V}}}}_{{{\rm{B}}}}^{-}\) centers22,36. Finally, the third term \({\hat{{{\mathcal{H}}}}}_{{{\rm{s}}}}\) describes the spin-stress coupling. Considering a hydrostatic pressure environment, the stress tensor is diagonal with identical principal components σxx = σyy = σzz = P, where P is the applied pressure. The electron spin density of the \({{{\rm{V}}}}_{{{\rm{B}}}}^{-}\) center is mainly localized in the (x, y) plane38,39. Since the stress component σzz has a small impact on the in-plane hBN structure, its coupling to the \({{{\rm{V}}}}_{{{\rm{B}}}}^{-}\) center can be safely neglected. In this framework, the Hamiltonian term describing the effect of hydrostatic pressure can be simply written as22
$$\hat{{{{\mathcal{H}}}}_{{{\rm{s}}}}}=\alpha ({\sigma }_{xx}+{\sigma }_{yy}){\hat{S}}_{z}^{2}=2\alpha P{\hat{S}}_{z}^{2}\,,$$
(2)
where α denotes the stress coupling coefficient. Hydrostatic pressure thus leads to a global shift of the \(\left\vert \pm \right\rangle \) spin sublevels, resulting in an increase of the zero-field splitting parameter D = D0 + 2αP [Fig. 3a].
Fig. 3: Spin properties under hydrostatic pressure.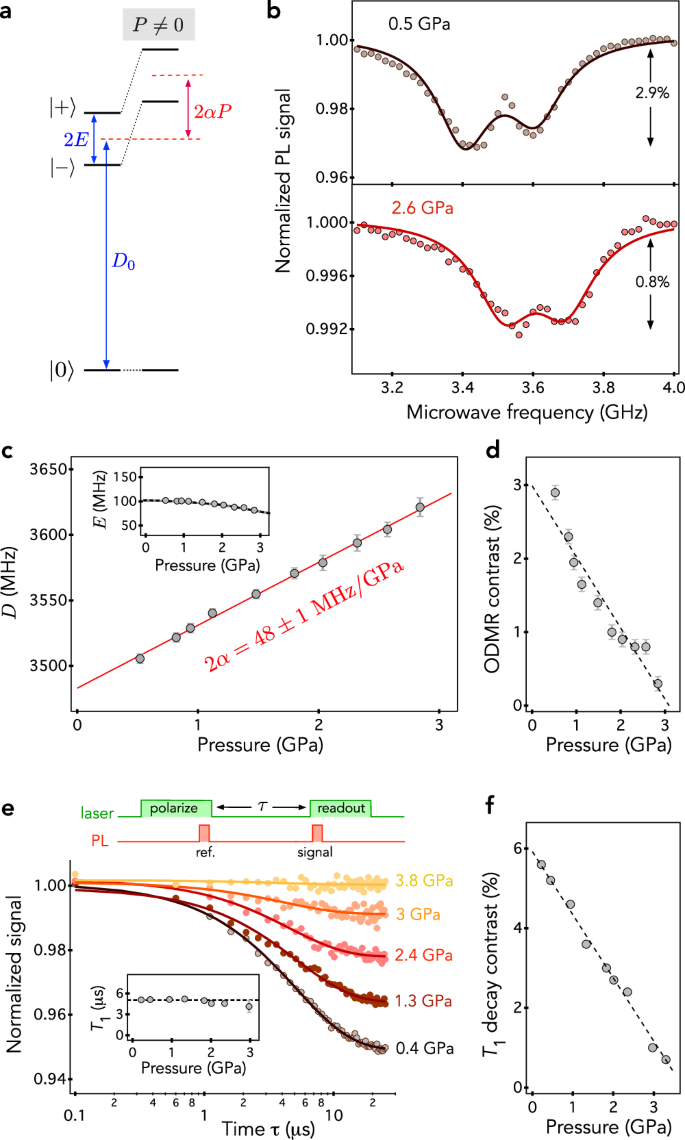
a Energy level structure of the spin triplet ground state illustrating the impact of hydrostatic pressure P. All notations are defined in the main text. b ODMR spectra recorded at 0.5 GPa (top) and 2.6 GPa (bottom). The solid lines are data fitting with Lorentzian functions from which the parameter D and E are extracted. c Zero-field splitting parameter D as a function of P. The solid line is a fit with a linear function yielding 2α = 48 ± 1 MHz/GPa. Inset: Evolution of the E-splitting parameter with P. The dashed line is a guide for the eye. d ODMR contrast as a function of P. The error bars in (d) and (e) correspond to one standard error in the fitting of ODMR spectra with Lorentzian functions. e Optically-detected spin relaxation curves recorded at different pressures using the experimental pulse sequence shown on top. The solid lines are data fitting with an exponential decay (see “Methods”). Inset: Evolution of the spin relaxation time T1 with P. f Contrast of the spin relaxation decay as a function of P. All experiments are performed at the same laser excitation power of 1 mW.
Typical ODMR spectra recorded at two different pressures are shown in Fig. 3b. We detect the characteristic magnetic resonances of the \({{{\rm{V}}}}_{{{\rm{B}}}}^{-}\) spin triplet ground state with frequencies given by ν± = D ± E, which are shifted to higher frequency upon increasing pressure. The variation of the zero-field splitting parameter D with pressure is plotted in Fig. 3c. Data fitting with a linear function yields a stress coupling coefficient 2α = 48 ± 1 MHz/GPa. This value is in very good agreement with recent first-principles calculations predicting 2α = 49 ± 2 MHz/GPa for \({{{\rm{V}}}}_{{{\rm{B}}}}^{-}\) centers embedded in a bulk hBN crystal22. The E-splitting remains almost unchanged though a slight reduction is observed at the highest applied pressures [see inset in Fig. 3c]. This effect, that cannot be explained by non-hydrostatic pressure components, is tentatively attributed to a decreased density of charges in the hBN crystal upon increasing pressure, which might result from pressure-induced charge state conversion of \({{{\rm{V}}}}_{{{\rm{B}}}}^{-}\) centers.
Besides the hydrostatic shift of the magnetic resonances, our measurements also reveal that the contrast of the ODMR signal decreases with pressure [Fig. 3d] and fully vanishes above 3 GPa, a pressure at which the PL signal still remains easily detectable with a high signal-to-background ratio [Fig. 2b]. Such a reduction in ODMR contrast cannot be explained by a strain gradient within the hBN flake because the ODMR linewidth is not significantly modified by pressure (See Supplementary Fig. 2). The reduced ODMR contrast could simply result from a degradation of the platinum wire used for microwave excitation at high pressure. This hypothesis is excluded by microwave-free measurements of the longitudinal spin relaxation of \({{{\rm{V}}}}_{{{\rm{B}}}}^{-}\) centers [Fig. 3(e) and Methods]. At low pressure, the optically-detected spin relaxation curve is highly contrasted ( ~ 5%) and data fitting with an exponential decay yields a longitudinal spin decay time T1 = 5.1 ± 0.1 μs. When pressure increases, T1 is not significantly modified while the contrast of the spin decay strongly decreases and vanishes completely above 3 GPa [Fig. 3f]. These results confirm those obtained by ODMR spectroscopy. The spin readout contrast is linked to the combination of (i) an efficient polarization of the \({{{\rm{V}}}}_{{{\rm{B}}}}^{-}\) center in the \(\left\vert {m}_{s}=0\right\rangle \) ground state by optical pumping and (ii) a spin-dependent PL emission. These two effects result from the spin selectivity of non-radiative ISC transitions to and from a metastable state during optical cycles32,33,34. While pressure-induced PL quenching discussed above is linked to an enhancement of non-radiative decay rates during optical cycles, the reduced ODMR contrast reveals a loss in spin selectivity of ISC transitions upon increasing pressure [Fig. 1b].
Magnetic imaging of a van der Waals magnet under pressure
Having established how the optical and spin properties of \({{{\rm{V}}}}_{{{\rm{B}}}}^{-}\) centers in hBN evolve with hydrostatic pressure, we now turn to magnetic imaging under pressure with \({{{\rm{V}}}}_{{{\rm{B}}}}^{-}\) centers integrated in a van der Waals heterostructure. As a proof of principle, we image the magnetic field produced by 1T-CrTe2, a layered ferromagnet with in-plane magnetic anisotropy and a Curie temperature Tc ~320 K under ambient pressure23,24,25,26. The van der Waals heterostructure deposited inside the high-pressure chamber of the DAC is described by Figs. 4a, b. A thin hBN flake exfoliated from a neutron-irradiated crystal is first transferred on one of the diamond anvils and used as a magnetic detection layer. A micrometer-sized flake of CrTe2 is then deposited on top of the sensing layer and capped with a hBN flake without \({{{\rm{V}}}}_{{{\rm{B}}}}^{-}\) centers for protection. All layers of the heterostructure are few tens of nanometers thick.
Fig. 4: Magnetic imaging under pressure with \({{{\rm{V}}}}_{{{\rm{B}}}}^{-}\) centers integrated in a van der Waals heterostructure.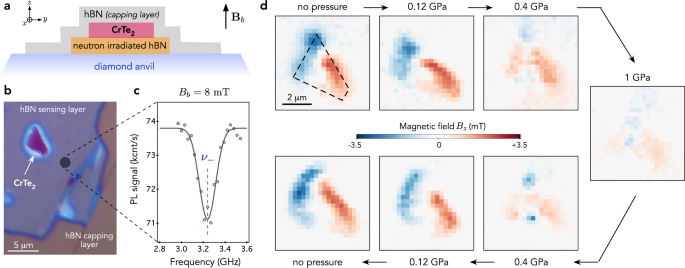
a Sketch and (b) optical image of the heterostructure deposited in the DAC chamber. All layers of the heterostructure are few tens of nanometers thick. c Spectrum of the low-frequency magnetic resonance of the \({{{\rm{V}}}}_{{{\rm{B}}}}^{-}\) center recorded far from the CrTe2 flake at zero external pressure with a bias field Bb = 8 mT. d Images of the magnetic field component Bz produced by the CrTe2 flake for increasing (top) and decreasing (bottom) pressure. For all images, the pixel size is 300 × 300 nm2 and the acquisition time per pixel is 60 s. The pixel-to-pixel noise estimated in small regions outside the CrTe2 flake is around ~150 μT, a value roughly in line with the estimation of the magnetic sensitivity using ODMR spectra. All experiments are performed at room temperature with a green laser power of 2 mW.
In what follows, a bias magnetic field Bb = 8 mT is applied along the z axis to split the electron spin resonances of the \({{{\rm{V}}}}_{{{\rm{B}}}}^{-}\) center via the Zeeman effect and we track the low-frequency component ν− by ODMR spectroscopy. Neglecting the orthorhombic splitting parameter E, this frequency is given by ν−(P) ≈ D(P) − γe(Bb + Bz), where γe = 28 GHz/T is the electron spin gyromagnetic ratio and Bz denotes the magnetic field produced by the CrTe2 flake along the z axis (See Supplementary Note 1). An ODMR spectrum recorded far from the ferromagnetic layer (Bz = 0) without applying external pressure is shown in Fig. 4c. From such a spectrum, the shot-noise limited magnetic field sensitivity η of the hBN-based sensing layer can be estimated by \(\eta \approx 0.7\times \frac{1}{{\gamma }_{e}}\times \frac{\Delta \nu }{{{\mathcal{C}}}\sqrt{{{\mathcal{R}}}}}\), where \({{\mathcal{R}}}\) is the rate of detected photons, \({{\mathcal{C}}}\) the ODMR contrast and Δν the linewidth40. We obtain η ~400 μT/\(\sqrt{{{\rm{Hz}}}}\) for a diffraction-limited laser excitation spot below 1 μm2. The same experiment performed at P = 1 GPa leads to a degraded magnetic sensitivity η ~ 800 μT/\(\sqrt{{{\rm{Hz}}}}\) due to the reduction in both spin readout contrast and PL signal (see Supplementary Fig. 3). Although NV centers implanted beneath the culet of a diamond anvil provide a better magnetic field sensitivity ( ~10 μT/\(\sqrt{{{\rm{Hz}}}}\)) and can operate up to megabar pressure16,17, the key advantage of the hBN-based sensing unit is its ability to be integrated in a van der Waals heterostructure, thus offering atomic-scale proximity to any type of 2D material placed in the high-pressure chamber of the DAC.
Magnetic field imaging is carried out by recording an ODMR spectrum at each point of a scan across the van der Waals heterostructure. By fitting the spectra, we infer the Zeeman shift of the spin resonance frequency, from which a map of the magnetic field component Bz is obtained. Images of the stray field distribution generated by the CrTe2 flake at different pressures are shown in Fig. 4d. At low pressure, a magnetic field with reversed sign is mostly produced at opposite edges of the flake, as expected for a ferromagnetic material with uniform in-plane magnetization26. As pressure increases, the amplitude of the stray magnetic field reduces and almost vanishes at 1 GPa. The magnetic images also indicate a sudden variation of the stray field distribution around 0.4 GPa, which suggests the formation of magnetic domains within the flake that results from pressure-induced variations of magnetic interactions. This process is reversible, the initial magnetic configuration of the CrTe2 flake being restored when the applied pressure is decreased [Fig. 4d]. Such measurements, which could not be carried out with conventional magnetometry techniques based on superconducting quantum interference devices (SQUID) or inductively coupled coils, illustrate the potential of \({{{\rm{V}}}}_{{{\rm{B}}}}^{-}\) centers in hBN for in situ magnetic imaging of van der Waals magnets under pressure.
Analysis of the pressure-induced shift of the Curie temperature
The pressure-dependent magnetization of CrTe2 is explained by a reduction of the magnetic exchange interaction upon increasing pressure, which leads to a decreased Curie temperature. In CrTe2, the exchange interaction between nearest Cr neighbors is dominated by the superexchange coupling mediated by a Te ion. The strength of this interaction is very sensitive to the angle θ of the Cr-Te-Cr bond. If θ = 90°, the superexchange interaction is ferromagnetic with maximal coupling strength6,7. First principles calculations of the cell parameters of CrTe2 indicate that θ is very close to 90° under ambient conditions (Methods). Upon increasing pressure, the angle θ decreases leading to a reduced strength of the superexchange coupling (see Supplementary Fig. 5), which in turn results in a decreased Curie temperature. A similar effect was reported for the van der Waals magnet Cr2Ge2Te66 and for other Cr1−δTe compounds41,42. To obtain an estimate of the pressure-induced shift of the Curie temperature, we rely on the empirical analysis described in Fig. 5b. Using a measurement of the magnetization M of a bulk CrTe2 crystal as a function of temperature, we first artificially infer its variations at room temperature by considering a pressure-induced shift of Tc with a slope β = dTc/dP < 0 [Fig. 5b]. We then compare the resulting pressure-dependent magnetization curves Mβ(P) with the maximum magnetic field Bz produced at the edges of a CrTe2 flake, which is proportional to the magnetization. This analysis is done for a series of magnetic images recorded at different pressure on a second heterostructure [Fig. 5c]. Note that an analysis of the spatial variation of the ODMR frequency away from the CrTe2 flake does not reveal a significant spatial gradient of the in-plane stress component across the hBN sensing layer (see Supplementary Fig. 4). For this second CrTe2 flake, we did not observe the formation of magnetic domains upon increasing pressure, making the comparison of the field at the edges more reliable. The results are shown in Fig. 5d. Our simple analysis reproduces fairly well the experimental results for β = − 40 ± 10 K/GPa.
Fig. 5: Pressure-induced shift of Tc.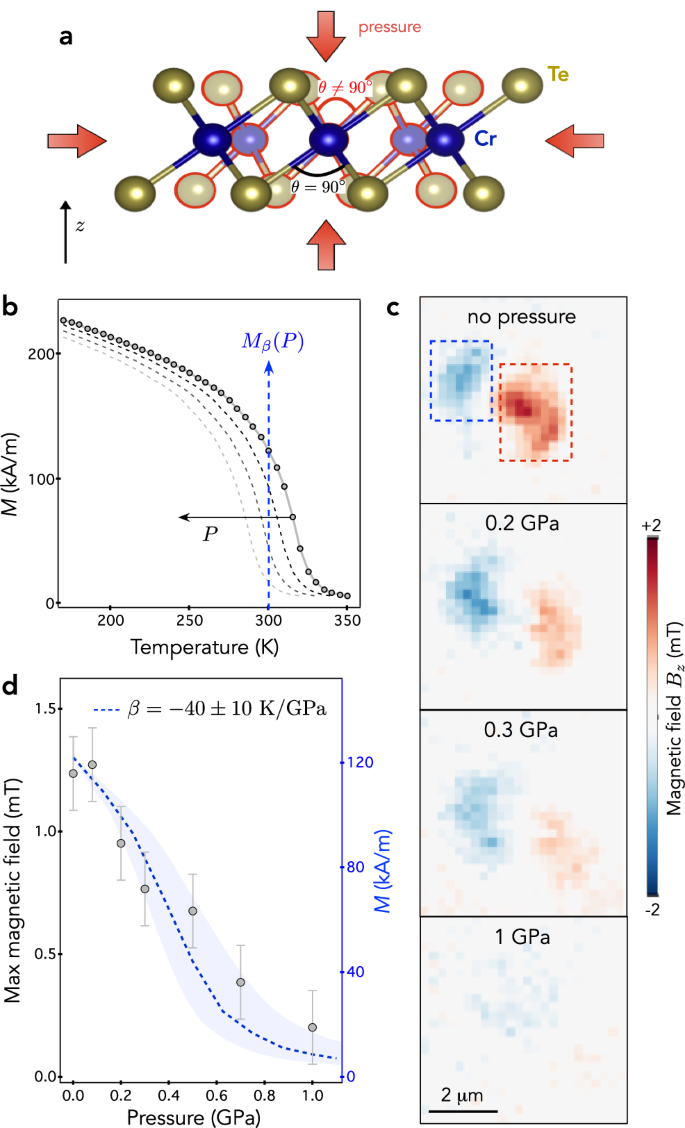
a Crystal structure of CrTe2 illustrating the variation of the Cr-Te-Cr bond angle with applied pressure. b Temperature dependence of the magnetization M of a bulk CrTe2 crystal recorded by vibrating sample magnetometry (circular markers). The dotted lines correspond to artificial shifts in the data to account for a pressure-induced shift in Curie temperature with a slope β = dTc/dP < 0. The blue dashed line indicates the resulting pressure-dependent magnetization Mβ(P) at room temperature. c Pressure-dependent magnetic field map of a second CrTe2 flake recorded at room temperature. The pixel size is 250 × 250 nm2 and the acquisition time per pixel is 60 s. The magnetic field produced at the edges of the CrTe2 flake is inferred within the regions indicated by the dashed rectangles in the top panel. In these regions, histograms of positive (red square) and negative (blue square) magnetic field values are fitted with a Gaussian function to obtain the maximum stray fields. d Maximum magnetic field measured at the edges of the CrTe2 flake as a function of pressure. The error bars correspond to one standard deviation uncertainty. The shaded area correspond to the variation of M with pressure at room temperature, which is obtained by using the data shown in (b) and a pressure-induced shift of the Curie temperature β = − 40 ± 10 K/GPa.
To conclude, we have shown that \({{{\rm{V}}}}_{{{\rm{B}}}}^{-}\) centers in hBN constitute a promising quantum sensing platform for local magnetic imaging in van der Waals heterostructures under hydrostatic pressures up to few GPa, a pressure range for which the properties of a wide variety of 2D magnets are efficiently altered4,5,6,7,8,9,10. Besides providing a new path for studying pressure-induced control of magnetic phases in 2D magnets, the hBN-based magnetic imaging unit also opens up interesting perspectives for exploring the physics of 2D superconductors43 under pressure via local measurements of the Meissner effect. Of particular interest could be the study of superconductivity in twisted bilayer graphene, whose critical temperature is very sensitive to pressures in the GPa range44. After completion of this work, we became aware of complementary studies exploring the properties of \({{{\rm{V}}}}_{{{\rm{B}}}}^{-}\) centers in hBN under pressure45,46.