Ankush Bajaj’s top three stock picks for 3 OctoberBuy: Shriram Finance Ltd — Current Price: ₹648.70
Why it’s recommended: Shriram Finance is sustaining above support zones with positive momentum. The daily RSI at 57.8 signals steady bullish momentum, while the MACD at +2.2 confirms a positive crossover. The ADX at 35.7 highlights strong underlying trend strength. Price action above ₹640 maintains a constructive technical setup with potential for further upside.
Key metrics:
RSI (14-day): 57.8 — stable bullish momentum
MACD (12,26): +2.2 — positive crossover
ADX (14): 35.7 — strong trend strength
Technical view: Sustaining above ₹640 keeps the bullish bias intact, opening the path toward ₹664.
Risk factors:
-Exposure to the credit cycle and NBFC sector regulations
-Asset quality deterioration could weigh on valuations
Buy at: ₹648.70
Stop loss: ₹640
Target price: ₹664
Buy: L&T Finance Ltd — Current Price: ₹258.60
Why it’s recommended: L&T Finance is consolidating near support levels, offering a potential risk-reward opportunity. The RSI at 42.3 reflects neutral momentum, while the MACD at -0.66 shows early signs of weakness but flattening. The ADX at 24.9 suggests a trend that is developing and could strengthen if the price sustains above key levels.
Key metrics:
RSI (14-day): 42.3 — neutral zone
MACD (12,26): –0.66 — showing early weakness
ADX (14): 24.9 — trend in early buildup
Technical view: Sustaining above ₹251 will be crucial to validate strength, with room for a rebound toward ₹272.
Risk factors:
-Sensitive to interest rate movements
-Higher credit risks in lending portfolios
Buy at: ₹258.60
Stop loss: ₹251
Target price: ₹272
Buy: Muthoot Finance Ltd — Current Price: ₹3,144.50
Why it’s recommended: Muthoot Finance is trading near highs with robust momentum. The RSI at 71.4 indicates strong bullish momentum, while the MACD at +33.4 reinforces positive trend strength. The ADX at 41.8 signals a very strong underlying trend. Supported by higher gold prices, the stock’s structure favours further upside.
Key metrics:
RSI (14-day): 71.4 — strong bullish momentum
MACD (12,26): +33.4 — trend continuation
ADX (14): 41.8 — very strong trend
Technical view: Sustaining above ₹3,116 keeps the setup bullish, with potential to move toward ₹3,198.
Risk factors:
-Vulnerability to gold price volatility
-Regulatory risks in NBFC lending
Buy at: ₹3,144.50
Stop loss: ₹3,116
Target price: ₹3,198
Stock market wrap
The NIFTY 50 climbed 225.20 points (0.92%) to close at 24,836.30, while the BSE SENSEX surged 715.69 points (0.89%) to settle at 80,983.31. The NIFTY BANK also added 174.85 points (+0.32%) to finish at 54,635.85.
Sectoral performance tilted positive. Financial services rose 1.38%, banking gained 1.30%, and healthcare advanced 1.30%, while PSU Bank was the only sectoral laggard, easing 0.37%.
In stock-specific action, Tata Motors (+5.61%), Shriram Finance (+5.29%), and Kotak Bank (+3.54%) provided strong support to the indices. On the downside, Bajaj Finance (-1.12%), Ultratech Cement (-1.04%), and SBI (-0.96%) weighed on the broader market.
Nifty technical analysis: Daily and hourly
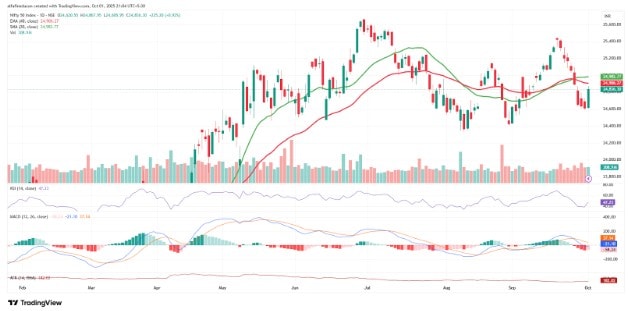
The Nifty 50 staged a strong rebound on 1 October, closing at 24,836.30, higher by 225.20 points or 0.92%, after three consecutive sessions of weakness. The recovery was broad-based, with bulls regaining control near the lower support zones and short-covering adding to the momentum.

View Full Image
Source: Trading View
On the daily timeframe, Nifty is still trading below its medium-term averages. The 20-DMA at 24,982 and 40-DEMA at 24,906 remain overhead resistances, which the index has yet to reclaim. Momentum indicators are showing signs of stabilization—the RSI improved to 47, recovering from near-oversold levels, while the MACD remains in negative territory at -21, but is flattening, indicating a potential bottoming process.
This suggests that while the broader structure is still fragile, the rebound is gaining traction and could continue if follow-through buying emerges.

View Full Image
Source: Trading View
On the intraday charts, momentum looks better. The index sustained above the 20-HMA (24,700) and 40-HEMA (24,814), reinforcing the recovery trend. The hourly RSI at 58 points to improving bullish momentum, while the MACD at -12 shows that bearish pressure is easing, though not yet fully reversed. Sustaining above 24,800 is critical for the next leg higher.
Derivatives setup
The options data signals a bullish tilt:
Total Put OI (140.5 million) is higher than Call OI (113.4 million), leaving a positive OI differential of +27.1 million.
Fresh OI changes further strengthen the bullish stance — Put OI rose by 84.6 million against a Call OI rise of 36.2 million, creating a positive change differential of +48.4 million.
The 25,000 strike continues to hold the highest Call OI, confirming it as the immediate supply zone, while aggressive additions at 25,500 CE suggest traders are already positioning for higher resistance.
On the Put side, the heaviest OI concentration has shifted to 24,700-24,800 strikes, making this the immediate support base.
The Nifty has shown encouraging signs of recovery after testing lower supports. The immediate challenge lies in reclaiming the 25,000 mark, which is now the key hurdle for bulls. A decisive close above 25,000 will open the path towards 25,200-25,350 in the near term. On the downside, 24,700-24,650 is the immediate support zone, followed by 24,500 as a critical base.
With intraday momentum improving, derivatives positioning turning supportive, and daily indicators stabilizing, the short-term outlook has shifted to cautiously bullish. Dips toward support zones are likely to attract buying, but unless the Nifty sustains above 25,000, the uptrend will remain vulnerable to pullbacks.
Bias: Cautiously bullis
Support: 24,700-24,650/24,500
Resistance: 25,000-25,200/25,350
Ankush Bajaj is a Sebi-registered research analyst. His registration number is INH000010441.
Investments in securities are subject to market risks. Read all the related documents carefully before investing.
Registration granted by Sebi and certification from NISM in no way guarantee the performance of the intermediary or provide any assurance of returns to investors.
Disclaimer: The views and recommendations given in this article are those of individual analysts. These do not represent the views of Mint. We advise investors to check with certified experts before making any investment decisions.

