
Friday, October 3, 2025
Weekly Digest
You’re reading the Benton Institute for Broadband & Society’s Weekly Digest, a recap of the biggest (or most overlooked) broadband stories of the week. The digest is delivered via e-mail each Friday.
Round-Up for the Week of September 29-October 3, 2025
A constellation of socioeconomic factors influences a household’s ability to pay for broadband service. Often, broadband affordability is the final barrier to adoption, and the amount of affordable broadband options can vary greatly from community to community.
New research by Ambika Nair, Community Development Analyst at the Federal Reserve Bank of New York, introduces a novel measure—Relative Broadband Affordability—that can be used to compare a community’s broadband affordability relative to other communities in the same city. Nair’s research highlights how affordability varies across neighborhoods and how these disparities can limit access to essential digital resources.
The following includes portions of Nair’s research in “Broadband Affordability: Assessing the Cost of Broadband for Low- and Moderate-Income Communities in Cities.”
Introducing Relative Broadband Affordability
According to Nair, Relative Broadband Affordability is the cost of broadband as it relates to a household’s or community’s average ability to pay for service. Viewing broadband affordability in this holistic context, and on the community-to-community level, enables policymakers and funders to have the information necessary to address local broadband affordability gaps.1
Average prices for broadband range from $39 to $101 per plan, but are largely between $50 and $65 in most census tracts. However, to understand relative broadband affordability experienced by communities, Nair looked at monthly broadband prices as a share of median household income. This measure is more reflective of a household’s ability to pay for broadband, particularly in the context of their existing income constraints. Broadband prices may not be significantly different in adjacent or nearby census tracts, but these prices as a share of household income in a low- and moderate-income census tract relative to a middle- to high-income census tract will likely influence whether a household is more or less likely to adopt broadband while balancing other important household costs.
Relative Broadband Affordability as calculated at the census tract or census place level:
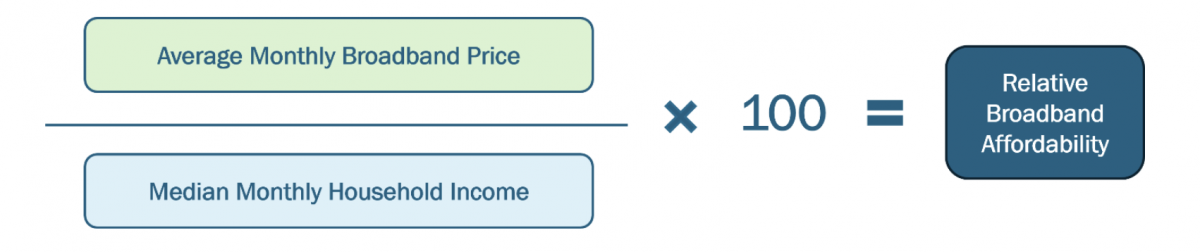
Relative Broadband Affordability is helpful for understanding the ability of households within a census tract or census place to pay for broadband relative to their median household income. However, to understand just how affordable broadband is to a community, Nair compared subscription costs to those of other communities within the city.
To do so, this study organizes communities by their relative broadband affordability into quartiles, indicating whether they have the most to the least relative broadband affordability within the city. This approach accounts for local costs of living, as quartiles are computed using only data points from the city being examined.
Broadband Affordability and Broadband Technologies
Overall, the less affordable broadband service is, the more likely consumers in cities will have poorer quality plans. This may be for one of two reasons:
Households are opting for poorer quality plans simply to be able to afford them, or
Broadband service providers in these neighborhoods may only use lower-quality broadband technology and charge a less affordable price.
Regarding different broadband technologies, Nair’s study notes that fiber remains the most expensive option (although its price has decreased in recent years), followed by fixed wireless, then hybrid-fiber coaxial (HFC), and finally DSL. Low- and moderate-income households that choose to purchase a monthly broadband subscription may opt for cheaper, lower-quality plans that rely on poorer-performing technologies (like DSL) given their budgetary constraints.
This study finds that, broadly speaking, low- and moderate-income households in urban areas often face the two-pronged issue of lower quality broadband and higher prices relative to their monthly median incomes.
What About Those Who Only Have Mobile?
Broadband affordability may also influence whether households opt to be exclusively dependent on their mobile devices for an internet connection or choose to take on a fixed-broadband subscription.
Opting to use only a mobile device is a very common alternative to broadband for low- and moderate-income individuals, particularly with the advancement of app-based services that make it easier to transact and communicate with just a mobile phone. However, exclusive reliance on a mobile phone can often limit low- and moderate-income individuals’ ability to reliably access vital services and opportunities for economic and professional advancement. Mobile connections typically come with data caps, slower speeds, and less reliable service, making completing tasks like applying for jobs, accessing remote education, attending telehealth appointments, and using online banking and financial tools difficult.
What Does Broadband Affordability Look Like in Cities?
For urban households in low- and moderate-income census tracts relative to the overall population, broadband costs generally make up a higher percentage of the household budget, but pale in comparison to other household expenses, such as utilities and rent.
Compared to the overall population in metropolitan areas, low- and moderate-income households spend a higher share of their income on broadband and other expenses: over four times as much on broadband, more than twice as much on utilities, and almost twice as much on rent.
A Case Study: New York
As of 2023, approximately 75 percent of households in New York City had a broadband Internet subscription. Roughly one in four households in New York City remained unconnected. The digital divide is especially severe in low-income communities in New York City, where broadband adoption lags significantly.
Affordability is one of the biggest challenges facing households in New York City, primarily due to the price for broadband being higher in boroughs with higher populations of low- and moderate-income New Yorkers. The lowest relative broadband affordability in the city is experienced in Upper Manhattan, the Bronx, Southern and Eastern Brooklyn, and Queens. These areas are largely low- and moderate-income communities of color, with aging housing infrastructure.
For many residents, high-quality broadband infrastructure is available, but the cost is too high. In some cases, families pay hundreds of dollars per month for subpar service, with plans offering 50 Megabits per second (Mbps) speeds costing as much as $299/month. This affordability issue is more prevalent in neighborhoods with high poverty rates, particularly in the South and Central Bronx.
Nair’s study lists the Bronx as having the highest average price and the lowest relative broadband affordability due to its lower median household income relative to the rest of the city. As of 2023, the Bronx also had the highest share of households with income below the Federal Poverty Level in New York City, with no broadband access and with access using cellular plans only. Brooklyn is next, with the second-highest share of households without broadband access.
To address these disparities, New York City has initiated several efforts to improve access to free and affordable broadband throughout the city. Namely, community-led broadband solutions have gained traction. New York City Mesh (NYC Mesh), for example, is a nonprofit building an open, affordable wireless network across the city that is now the largest community-based network in the United States. LinkNYC also provides free high-speed Wi-Fi via public kiosks, and speed test data from Ookla has shown that LinkNYC has offered faster average download and upload speeds than New York City’s average download and upload speeds over mobile Wi-Fi (74% and 165% respectively). Additionally, local initiatives like the Red Hook Initiative have installed mesh networks in public housing to help bridge the gap for underserved residents in the aftermath of Hurricane Sandy.
Understanding the Landscape of Broadband Affordability in Order to Change it
Broadband adoption brings economic and social returns to households, particularly low- and moderate-income households. In many places, particularly low- and moderate-income metropolitan neighborhoods, broadband affordability is the final barrier to broadband adoption. This means that interventions that bring down the cost of broadband for these families can have compounding social and economic returns for them and their communities.
Relative Broadband Affordability is more reflective of a household’s ability to pay for broadband, particularly in the context of existing income constraints. In cities, broadband prices may not be significantly different in adjacent or nearby census tracts; however, the prices as a share of household income in a low- and moderate-income census tract will likely influence whether a household adopts and sustains a broadband connection while balancing other important household costs.
Data on broadband pricing continues to be limited for smaller geographies and rural areas, which highlights the need for local, state, and national data collection efforts on broadband price offers at the community level to advance research on broadband pricing and accessibility, especially for low- and moderate-income populations.
Read the full report by Ambika Nair at the Federal Reserve Bank of New York here.
Notes:
To measure Relative Broadband Affordability, Nair’s study uses address-level internet service plan pricing data from The Markup’s dataset, “How We Uncovered Disparities in Internet Deals.” Address-level pricing data is aggregated and averaged at the census tract and census place levels for this analysis.
More on Affordability
Quick Bits
Weekend Reads
ICYMI from Benton
Upcoming Events
Oct 7––Western North Carolina Digital Opportunity Pitch Party (Blue Ridge Broadband Alliance)
Oct 7––Digital Opportunity Workshop (Maine’s Digital Equity Alliance)
Oct 8––Shut Your App: How Uncle Sam Jawboned Big Tech Into Silencing Americans (Senate Commerce Committee)
Oct 9––Connected NYC: Advancing Digital Equity (New York City Office of Technology and Innovation)
Oct 9––Crisis Connectivity: Digital Inclusion Before, During, and After Disasters (National Digital Inclusion Alliance)
Oct 9––Strategies for Advancing Broadband Affordability and Broadband Adoption (Public Knowledge)
Oct 10––A Conversation with Dr. Nicol Turner Lee (Georgetown Institute for Technology Law & Policy)
Oct 14––Employer Workforce Preparedness in the Fiber Broadband Industry: How Build-Ready Are We? (Fiber Broadband Association)
Oct 15––2025 Maryland Digital Opportunity Summit (University of Maryland Extension)
Oct 16––KINBERCON (KeystoneREN)
Oct 21––A Catalyst for Economic Growth: Why Broadband Adoption Matters (Fiber Broadband Association)
Oct 22––Building Network Infrastructure to Deliver the AI Revolution (Wireless Infrastructure Association)
Oct 30––43rd Annual Parker Lecture and Awards Ceremony (United Church of Christ Media Justice Ministry)