

If you find yourself wondering whether Cabot stock is a buy, hold, or sell right now, you are not alone. Over the past year, the price has certainly kept investors on their toes, dropping nearly 30% from where it stood twelve months ago. Even with that sizable slide, though, Cabot’s five-year return is an eye-popping 106.5%. This means that long-term holders have seen some remarkable gains. That mix of short-term uncertainty and long-term success makes Cabot an interesting case for anyone weighing their next move.
The stock’s performance lately has reflected a market grappling with new risks and shifting expectations. The price is down over 14% year-to-date but has held mostly steady over the past week. This recent volatility has drawn more attention to how the company is valued, especially in light of sector-wide shifts and ongoing global developments that do not always make the headlines but do filter through to investor sentiment. Cabot has earned a valuation score of 4 out of 6, indicating it is undervalued on most (but not all) checks that matter to analysts and value-focused investors.
So, how do these valuation signals actually stack up, and which methods offer the clearest picture of what Cabot is truly worth? Let’s break down the standard approaches first, as there may be a more insightful way to think about Cabot’s value beyond the usual metrics.
Why Cabot is lagging behind its peers
Approach 1: Cabot Discounted Cash Flow (DCF) Analysis
The Discounted Cash Flow (DCF) model is a tool that estimates a company’s intrinsic value by projecting its future cash flows and then discounting them back to their present value. This approach helps investors determine what a company is truly worth today based on its ability to generate cash in the years ahead.
For Cabot, the DCF model uses a two-stage Free Cash Flow to Equity approach. The company’s most recent twelve-month free cash flow stands at $388.6 million. Analysts have provided direct cash flow estimates for the next several years, with projections showing free cash flow at $322 million by the year ending September 2027. After these analyst estimates, further annual projections are extrapolated with free cash flow expected to moderate but remain robust over the next decade, reaching approximately $314 million in 2035.
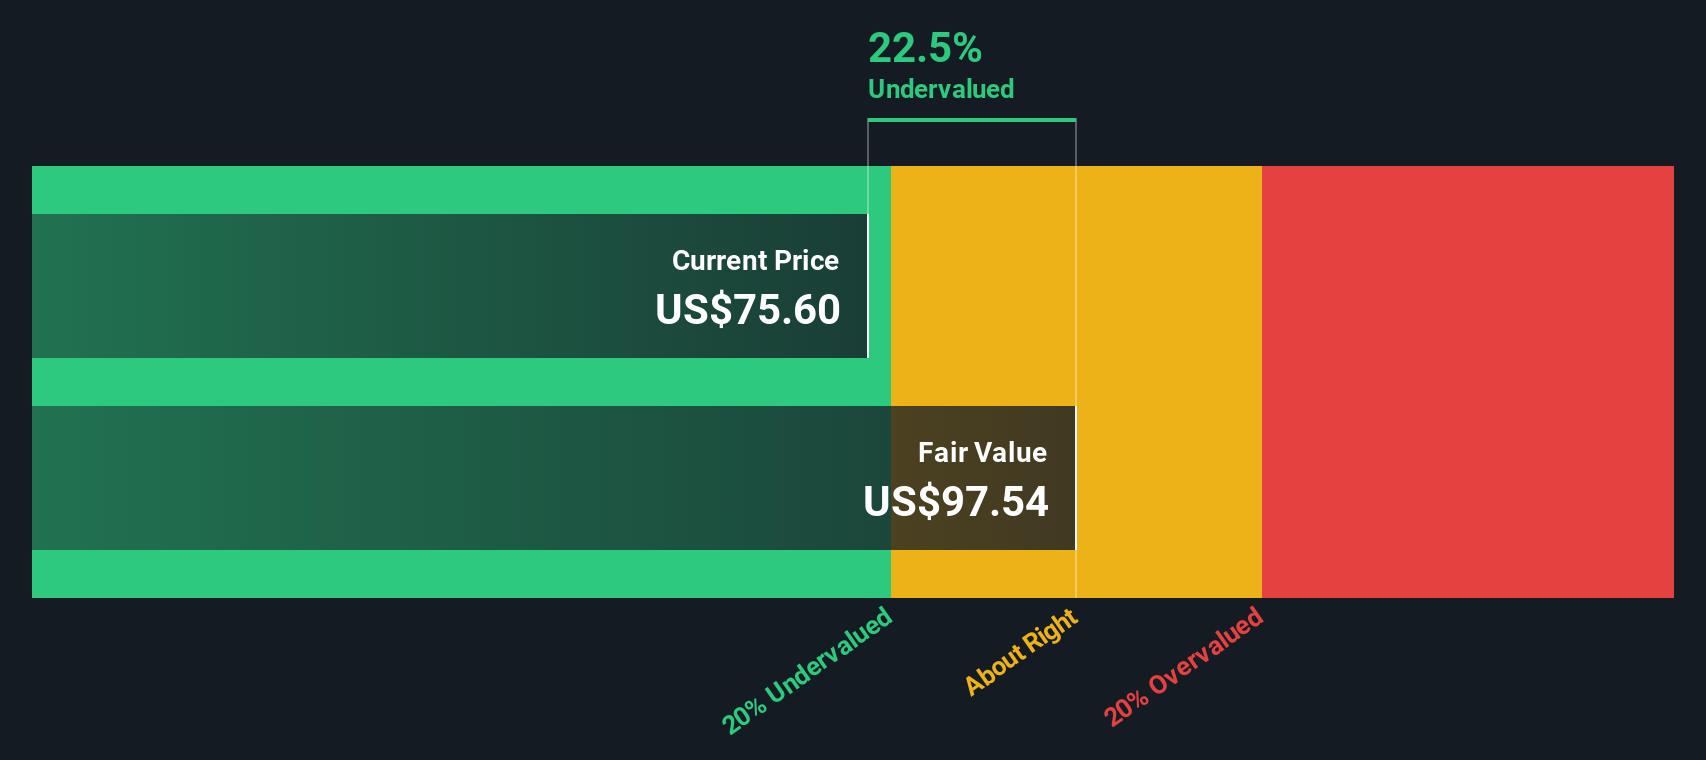
Taking these projections into account, the resulting intrinsic value for Cabot is $97.54 per share. With the stock currently trading at a 22.5% discount to this calculated fair value, the model suggests that the stock is significantly undervalued at today’s price.
Result: UNDERVALUED
 CBT Discounted Cash Flow as at Oct 2025
Our Discounted Cash Flow (DCF) analysis suggests Cabot is undervalued by 22.5%. Track this in your watchlist or portfolio, or discover more undervalued stocks.
Approach 2: Cabot Price vs Earnings (PE)
The Price-to-Earnings (PE) ratio is a widely used metric for valuing profitable companies like Cabot, as it reflects how much investors are willing to pay for each dollar of a company’s earnings. It is particularly relevant for companies with stable and consistent profitability, making it a strong fit for Cabot’s current financial situation.
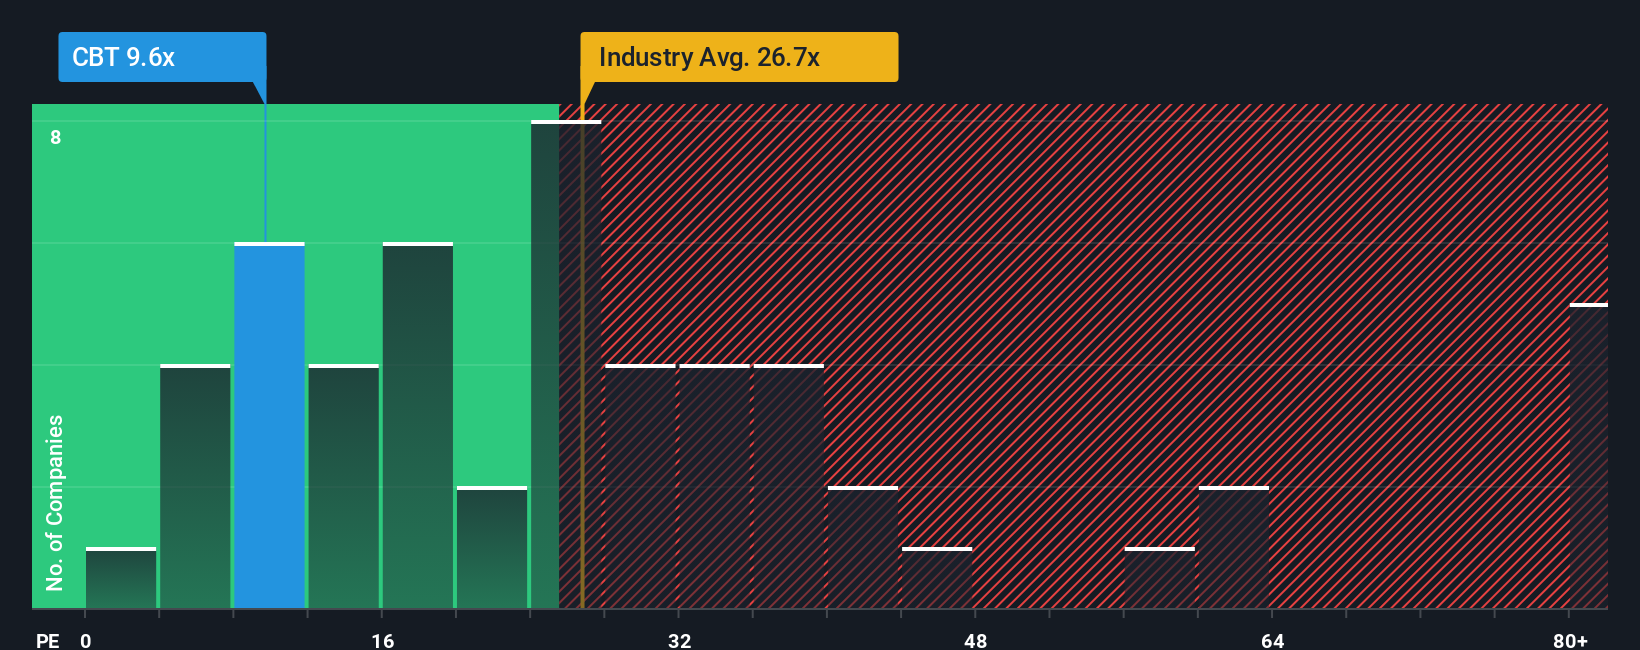
Growth expectations and risk profile play a critical role in what constitutes a “normal” or “fair” PE ratio. Higher expected growth typically supports a higher PE, while greater risks can push the fair PE lower. Assessing Cabot, its current PE ratio stands at 9.62x, which is well below both the industry average of 26.66x and the peer average of 43.64x. According to these standard benchmarks, Cabot appears attractively valued relative to its peers.
Simply Wall St’s “Fair Ratio” takes this a step further. Instead of relying solely on peer or industry comparisons, the Fair Ratio incorporates a range of factors including Cabot’s earnings growth outlook, industry specifics, profit margins, market size, and underlying risks. This proprietary approach provides a more nuanced and balanced perspective on what investors should reasonably pay for the stock, given its particular circumstances.
Comparing Cabot’s actual PE of 9.62x to its Fair Ratio, which is also 9.62x, suggests the stock is priced about right based on the company’s unique profile and outlook.
Result: ABOUT RIGHT
 NYSE:CBT PE Ratio as at Oct 2025
PE ratios tell one story, but what if the real opportunity lies elsewhere? Discover companies where insiders are betting big on explosive growth.
Upgrade Your Decision Making: Choose your Cabot Narrative
Earlier we mentioned that there is an even better way to understand valuation, so let’s introduce you to Narratives. A Narrative is a story you create that connects your personal view of a company’s future, including fair value estimates and forecasts for revenue, earnings, and margins, with the numbers in your financial analysis. Simply put, it ties together what you believe about a company’s outlook, how you think it will perform, and what that means for its true value.
Narratives are available to everyone on Simply Wall St’s Community page and are designed to make sophisticated investing both easier and more accessible. By linking company stories to financial forecasts and then to fair value, Narratives help you decide when Cabot is a buy or sell by comparing your fair value to the market price. Best of all, Narratives are updated automatically whenever there is breaking news or a fresh earnings report, so your analysis stays relevant.
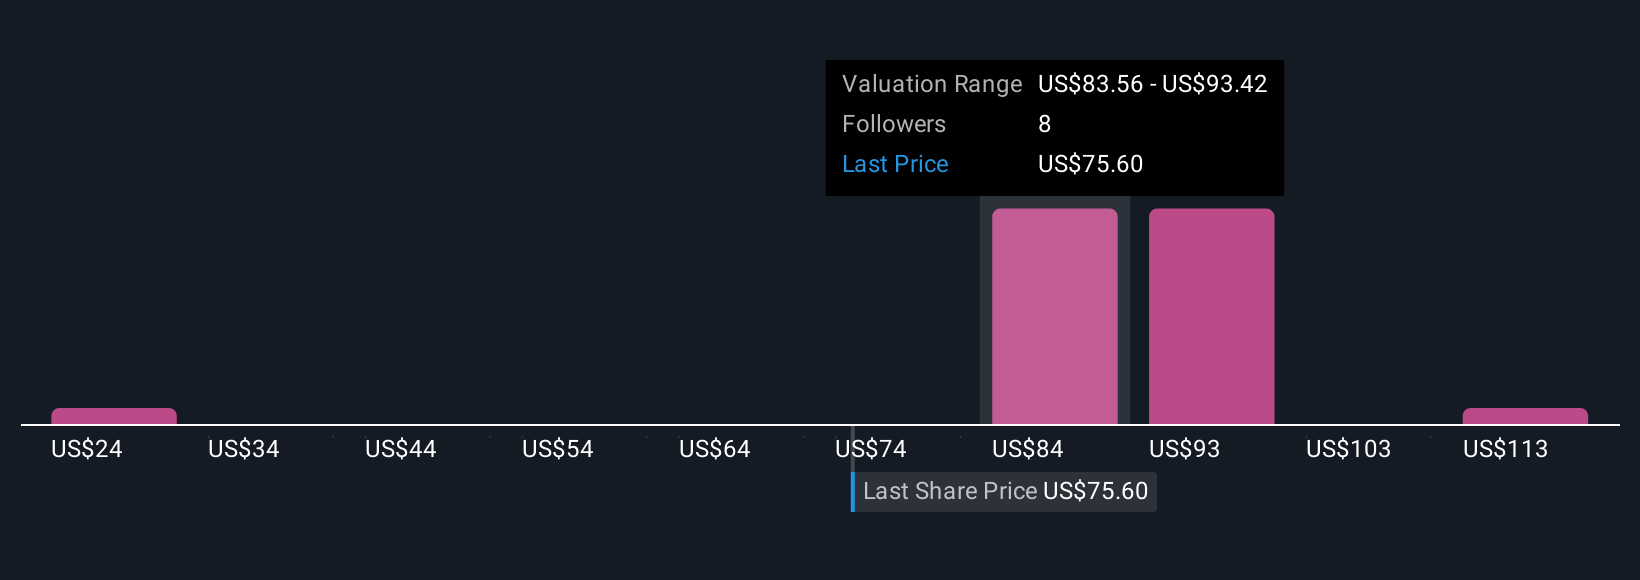
For example, in Cabot’s Community, you will see some investors forecasting a fair value as high as $120 per share, while others are more cautious and peg it at just $85, showing how different stories and assumptions can drive distinct investment decisions.
Do you think there’s more to the story for Cabot? Create your own Narrative to let the Community know!
 NYSE:CBT Community Fair Values as at Oct 2025
This article by Simply Wall St is general in nature. We provide commentary based on historical data
and analyst forecasts only using an unbiased methodology and our articles are not intended to be financial advice. It does not constitute a recommendation to buy or sell any stock, and does not take account of your objectives, or your
financial situation. We aim to bring you long-term focused analysis driven by fundamental data.
Note that our analysis may not factor in the latest price-sensitive company announcements or qualitative material.
Simply Wall St has no position in any stocks mentioned.
New: AI Stock Screener & Alerts
Our new AI Stock Screener scans the market every day to uncover opportunities.
• Dividend Powerhouses (3%+ Yield)
• Undervalued Small Caps with Insider Buying
• High growth Tech and AI Companies
Or build your own from over 50 metrics.
Have feedback on this article? Concerned about the content? Get in touch with us directly. Alternatively, email editorial-team@simplywallst.com