
Low Earth orbit is getting crowded, and it’s not just about the satellites and debris everyone can picture.
Even hundreds of miles up, in air so thin it barely qualifies as atmosphere, enough drag exists to quietly nudge satellites off course over time.

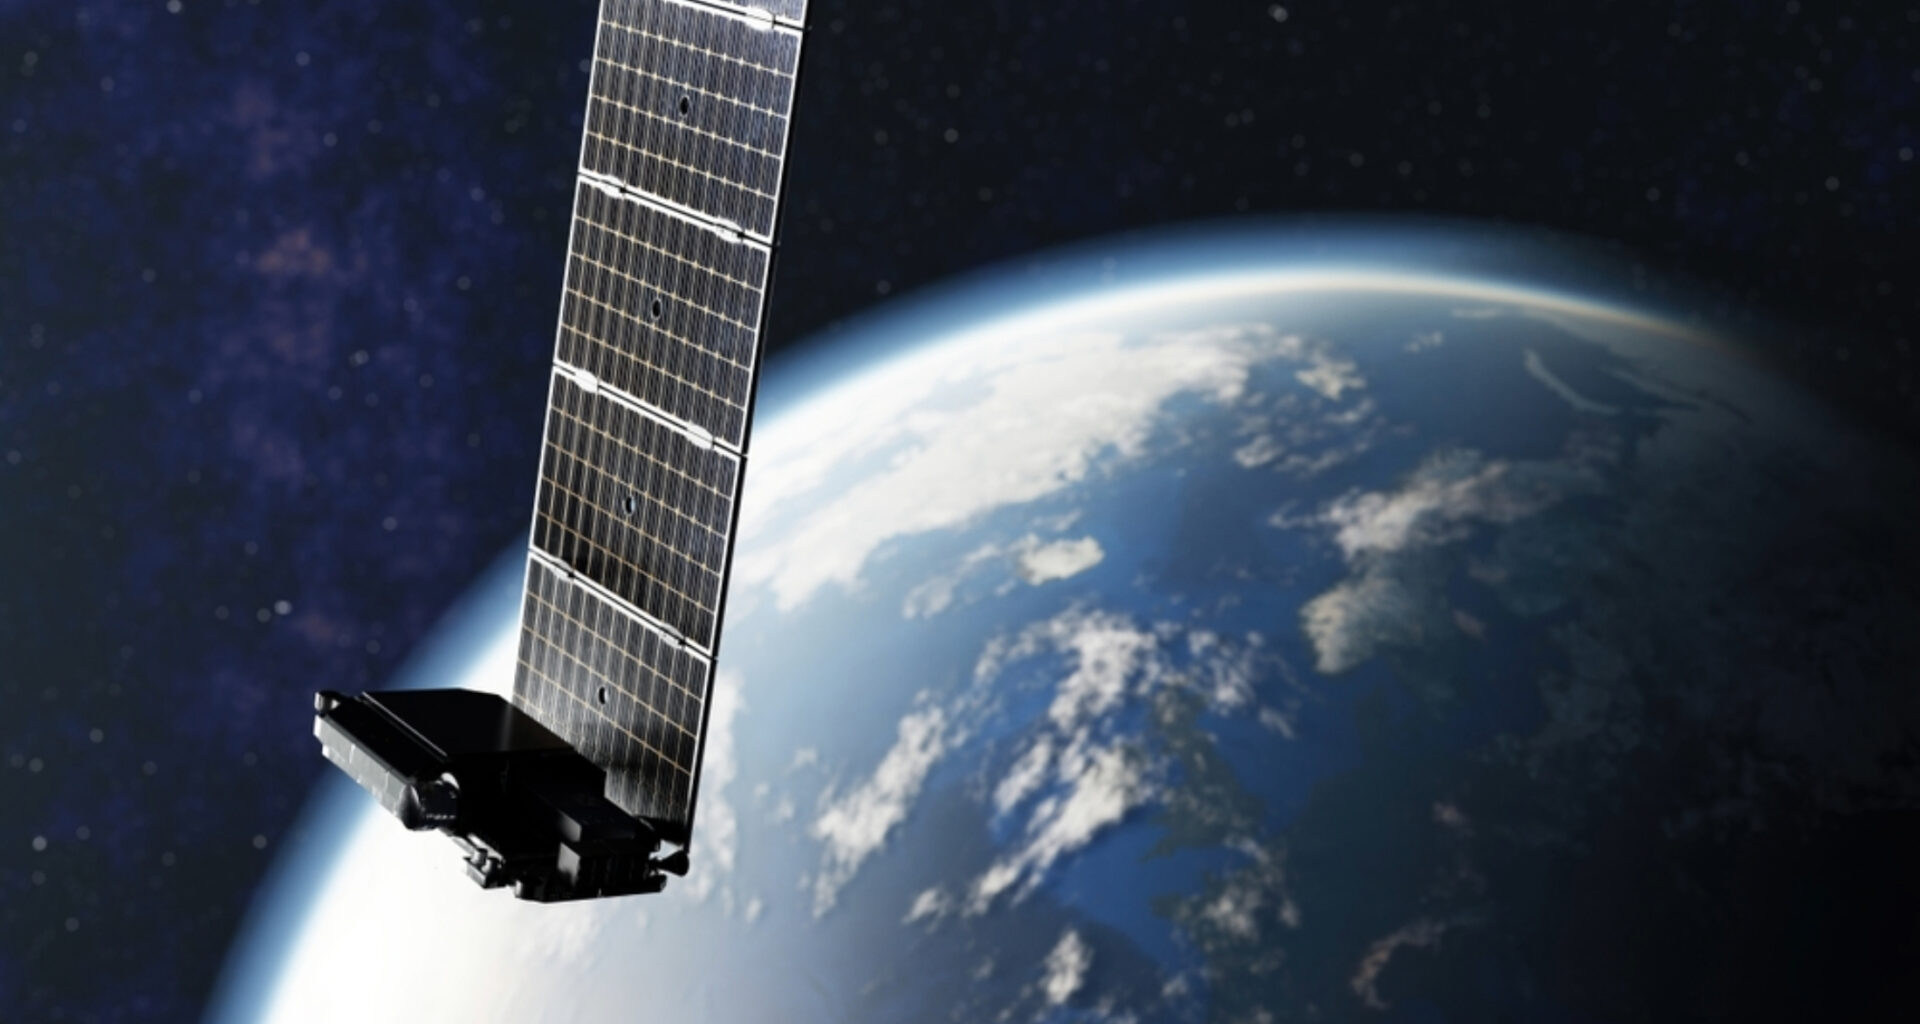
A new study turns that problem into a tool, using thousands of Starlink satellites as an accidental sensor network to map that invisible layer of sky in unprecedented detail.
The research was led by Mamoru Yamamoto at Kyoto University’s Research Institute for Sustainable Humanosphere.
Earth’s invisible upper atmosphere
More than 99 percent of the upper atmosphere is made up of electrically neutral gas known as the thermosphere. It stretches from about 60 to 620 miles (100 to 1,000 kilometers) above Earth’s surface.
The remaining sliver is ionized gas, the ionosphere, and because that ionized layer interferes with radio waves, it’s relatively straightforward to observe.
Neutral thermospheric gas offers no such shortcut. It doesn’t interact with radio signals the same way, which has historically made it one of the hardest parts of the atmosphere to measure.
However, knowing its density is critical for predicting how satellites drift and when collisions might become a risk.
Borrowing a trick from medical imaging
Yamamoto’s approach leans on Starlink, the SpaceX satellite constellation that now numbers in the thousands, as an unlikely research instrument.
Every satellite orbiting through the thermosphere experiences a small amount of atmospheric drag, which very slightly decays its orbit over time.
By carefully measuring that orbital decay using detailed data that SpaceX makes publicly available, Yamamoto estimated the density of the atmosphere surrounding roughly 1,200 Starlink satellites.
The satellites orbit at an altitude of about 300 miles (482 kilometers) above Earth.
From there, he applied tomography, the same technique used to reconstruct 3D images in medical scans. He used it to build a latitude-longitude snapshot of thermospheric density at that altitude.
It’s the first time this kind of tomographic reconstruction has been attempted for the thermosphere using real satellite data rather than simulated inputs.
Checking against independent satellites
To test whether the technique held up, Yamamoto compared his results with independent density measurements from the European Space Agency’s SWARM satellites.
Those satellites use onboard GPS positioning to track atmospheric density along their flight paths.
SWARM’s two satellites orbit at altitudes both above and below the 300-mile (482-kilometer) band of the atmosphere Yamamoto was mapping, giving him a useful bracket for checking his results.
The comparison held up well. Across 19 analyses of data collected between September 1 and 7, 2025, the tomographic estimates closely tracked SWARM’s measurements.
On average, they reached 95 percent of the values observed by SWARM, with individual estimates ranging from about 60 to 120 percent.
The technique also correctly located the thermosphere’s density peak within a well-defined band of longitude and latitude. That matched the pattern predicted by an established atmospheric model used as a baseline for comparison.
Space science meets engineering
Yamamoto describes the project as sitting squarely between two fields that don’t always talk to each other as much as they probably should.
“This is a multidisciplinary study between space science and space engineering,” Yamamoto said.
“Reading papers from both research fields, we realized that deeper dialogue between researchers from both fields is necessary.”
Expanding earlier Starlink research
This isn’t Yamamoto’s first attempt to extract atmospheric data from Starlink’s orbital records.
Earlier research from the same team used more general orbital information, known as Two-Line Element data, to estimate how thermospheric density changes over time and with altitude.
This new study builds on that work by mapping the latitude-longitude structure of the thermosphere rather than just how it varies with altitude and time.
Helping satellites avoid collisions
The stakes here aren’t purely academic. Better thermospheric density data improves predictions of satellite motion. That helps operators avoid collisions in an orbital environment that keeps getting more crowded each year.
Down the line, the method could support near-real-time monitoring of atmospheric density around satellites.
This would strengthen space weather forecasting and make operating in orbit a little safer and more predictable.
Building a better map
Yamamoto is upfront that the current results are still preliminary and relatively low resolution.
The method currently works best at capturing broad, day-to-day patterns in density rather than fine-grained fluctuations.
Starlink’s satellites orbit at an inclination of 53 degrees, leaving gaps in coverage at high latitudes.
Future refinements will need to address those gaps, possibly by adding data from satellites that sample different parts of the upper atmosphere from other orbital shells and inclinations.
Still, this is the first demonstration that this type of tomography works with real, publicly available satellite data rather than simulations alone.
The result opens a promising path for both space scientists and space engineers.
The study is published in the journal Earth, Planets, and Space.
—-
Like what you read? Subscribe to our newsletter for engaging articles, exclusive content, and the latest updates.
Check us out on EarthSnap, a free app brought to you by Eric Ralls and Earth.com.
——