
Literature search results and basic characteristics
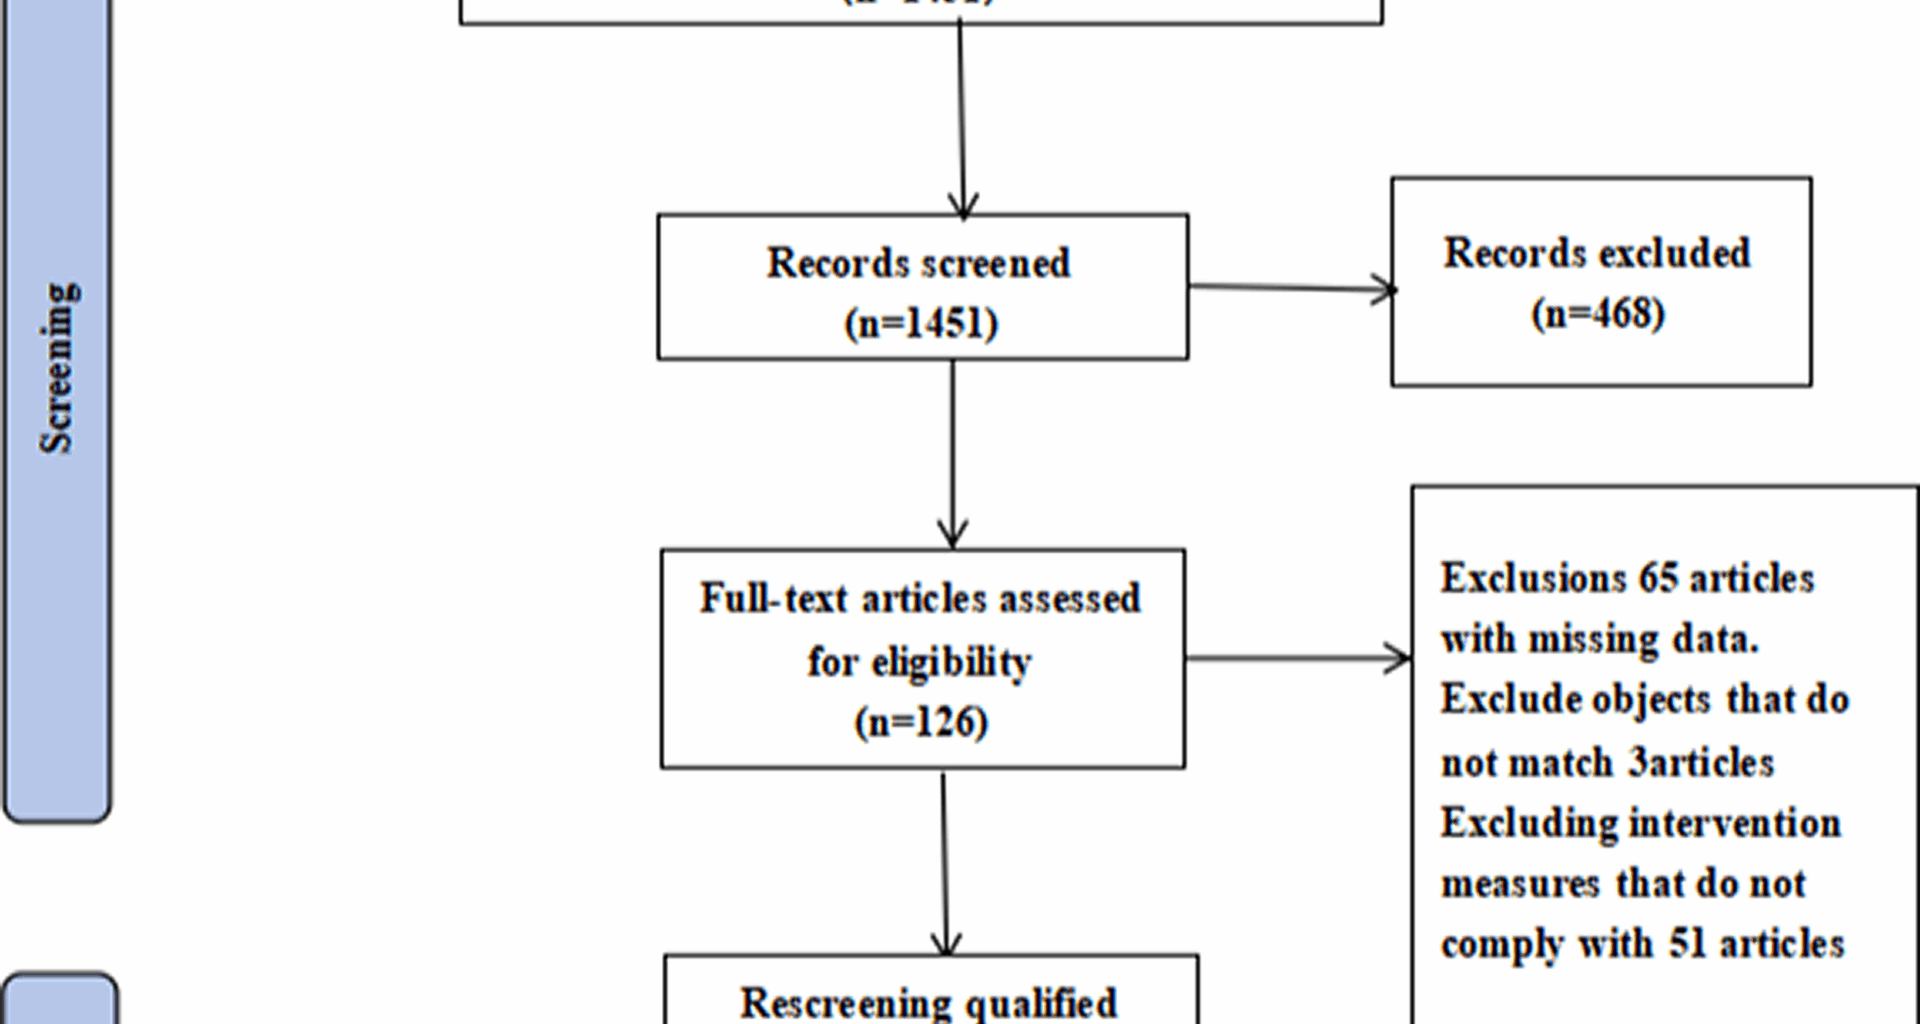
The researchers retrieved a total of 1,919 articles from the following databases: PubMed, Web of Science, Embase, Scopus, Cochrane Library, China Biological Medicine Database, CNKI, Wanfang Database, and VIP Database. Figure 1 illustrates the detailed search process. After screening the titles and abstracts, the researchers excluded duplicates, theoretical reviews, and irrelevant studies. After a comprehensive full-text review, seven RCTs were included in the final analysis. Table 1 summarizes the basic characteristics of the included studies.
Fig. 1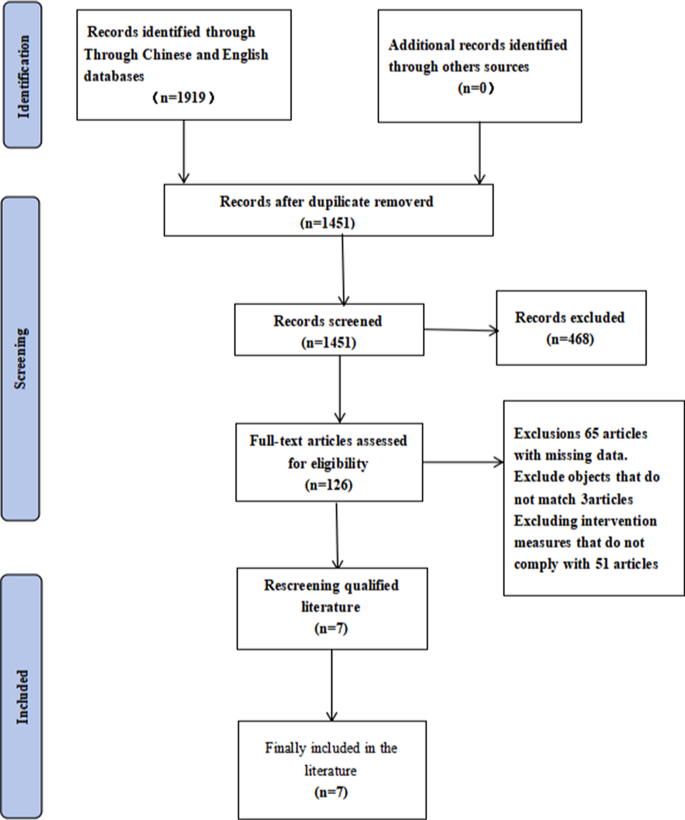
Flowchart of literature screening
Table 1 Basic characteristics of the included literatureAssessment of the quality of the included studies
The researchers used RevMan 5.4 software to assess the risk of bias in the included studies, as shown in Fig. 2. Several studies have indicated varying degrees of risk. The primary issues stemmed from strict participant selection criteria during randomization and insufficient allocation concealment, both of which contributed to a higher risk of bias. With respect to blinding, one study was considered to have a low risk of bias because it employed either single- or double-blinding [22]. In contrast, six studies either failed to report their blinding procedures or relied entirely on objective instrument measurements [8, 13, 15, 23,24,25]. As shown in Fig. 2, these issues led to an unclear or high risk of bias in those studies.
Fig. 2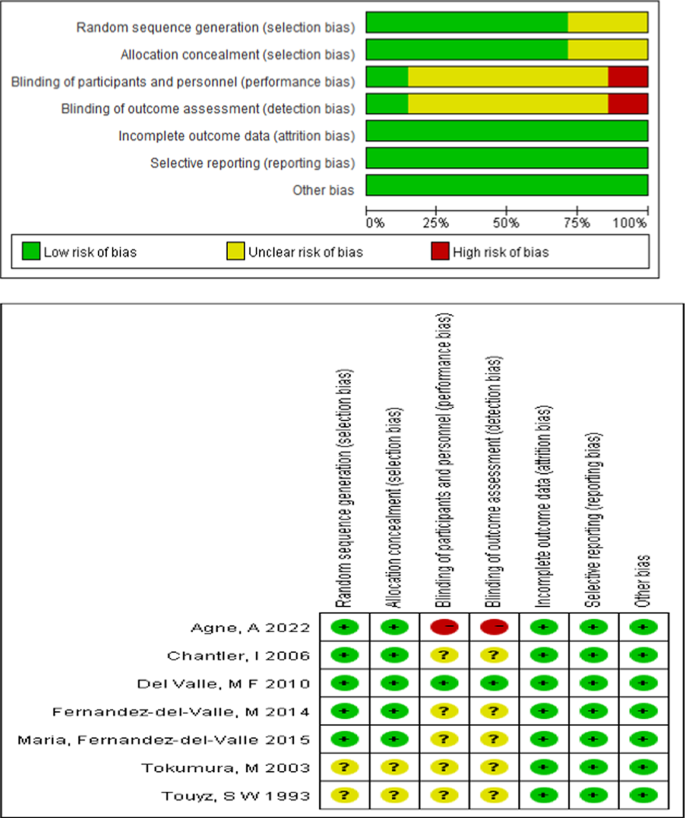
Risk assessment table for inclusion of literature bias
Meta-analysis results
Four studies examined the effects of exercise interventions on weight in adolescents with AN [8, 22, 24, 25]. The overall effect size analysis revealed no heterogeneity across these studies (P = 0.57, I² = 0), allowing for the use of a fixed-effects model. The results revealed a statistically significant difference in weight between the experimental and control groups (SMD = −0.43; 95% CI [−0.81, −0.06]; P = 0.02), as shown in Fig. 3.
Fig. 3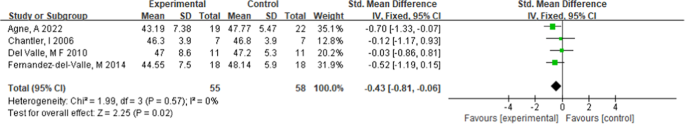
The effect of physical activity intervention on weight
Six studies investigated the impact of exercise interventions on BMI in adolescents with AN [8, 13, 15, 22, 24, 25]. The overall effect size analysis revealed significant heterogeneity among the studies (P = 0.002, I² = 74%). Sensitivity analysis identified the study by Tokumura, M. (2003) [13] as the primary source of heterogeneity. After excluding this study, heterogeneity decreased substantially (P = 0.36, I² = 8%), and a fixed-effects model was subsequently applied. The results revealed no statistically significant difference in BMI between the experimental and control groups (SMD = −0.10; 95% CI [−0.42, 0.22]; P = 0.53), as shown in Fig. 4.
Fig. 4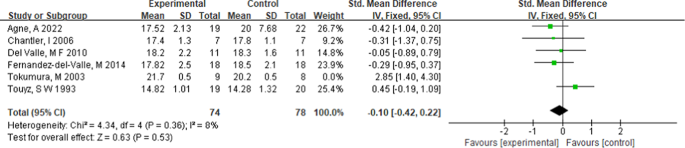
The effect of sports activity intervention on body mass numbers
Two studies explored the effects of exercise interventions on lean body mass [22, 25]. The overall effect size analysis indicated no heterogeneity between the studies (P = 0.92, I² = 0), and a fixed-effects model was therefore used. The results revealed no statistically significant difference in lean body mass between the experimental and control groups (SMD = 0.10; 95% CI [−0.55, 0.75]; P = 0.76), as illustrated in Fig. 5.
Fig. 5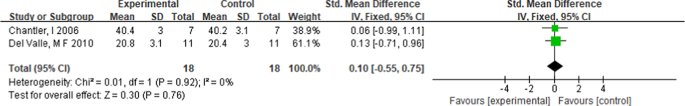
The effect of physical activity intervention on lean body mass
Two studies examined the effects of exercise interventions on fat mass in adolescents with AN [22, 25]. The analysis revealed no heterogeneity between the studies (P = 0.64, I² = 0), allowing for the use of a fixed-effects model. The results revealed no statistically significant difference in fat mass between the experimental and control groups (SMD = −0.19; 95% CI [−0.85, 0.46]; P = 0.57), as illustrated in Fig. 6.
Fig. 6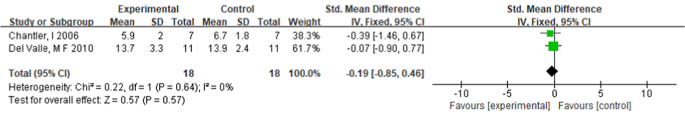
The effect of physical activity intervention on fat weight
Two studies assessed the impact of physical activity on thigh muscle dimensions in adolescents with AN [8, 23]. The test for overall effect size revealed no heterogeneity (P = 0.74, I² = 0), permitting the application of a fixed-effects model. The results revealed a statistically significant difference in thigh muscle dimensions between the experimental and control groups (SMD = −0.55; 95% CI [−0.99, −0.11]; P = 0.01), as shown in Fig. 7.
Fig. 7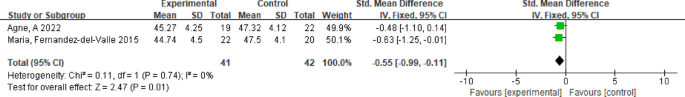
The effect of physical activity intervention on the circumference of the middle thigh muscles
Two studies explored the effect of physical activity on thigh muscle skinfold thickness in adolescents with AN[8, 23]. The effect size analysis revealed no heterogeneity (P = 0.85, I² = 0), leading to the use of a fixed-effects model. The results revealed a statistically significant difference in thigh muscle skinfold thickness between the intervention and control groups (SMD = −0.56; 95% CI [−1.00, −0.12]; P = 0.01), as illustrated in Fig. 8.
Fig. 8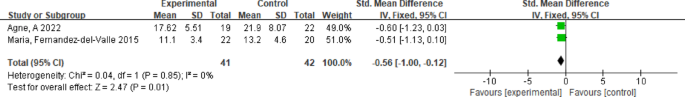
The effect of physical activity intervention on the wrinkling degree of muscles and skin in the middle of the thigh
Two studies investigated the impact of physical activity on quality of life in adolescents with AN [8, 22], examining subscales including physical functioning, role-physical, bodily pain, general health, vitality, social functioning, role-emotional, mental health, physical component summary, and mental component summary scores. The analysis revealed no heterogeneity among the studies (P = 0.73, I² = 0), so a fixed-effects model was employed. The results revealed a statistically significant improvement in quality of life indicators in the experimental group compared with the control group (SMD = 0.26; 95% CI [0.11, 0.42]; P = 0.001), as shown in Fig. 9.
Fig. 9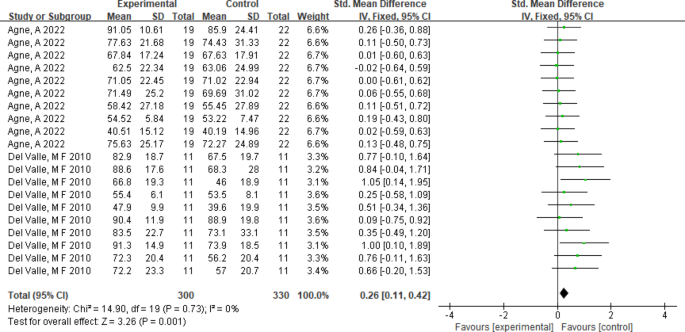
The impact of physical activity intervention on quality of life
Subgroup analysis results
Four studies examined the effects of exercise intervention duration on weight in adolescents with AN [8, 22, 24, 25]. Subgroup analyses yielded the following results: intervention duration: interventions lasting 8 weeks or less significantly affected weight (SMD = −0.60; 95% CI [−1.02, −0.17]; P = 0.006), whereas those exceeding 8 weeks did not result in significant changes (SMD = −0.03; 95% CI [−0.86, 0.81]; P = 0.95). Frequency: a frequency of 2 sessions per week showed no significant effect on weight (SMD = −0.06; 95% CI [−0.72, 0.59]; P = 0.85), whereas 3 sessions per week led to significant improvements (SMD = −0.61; 95% CI [−1.07, −0.15]; P = 0.009), as illustrated in the figure below. Session length: Interventions lasting ≥ 60 min per session had no significant effect (SMD = −0.06; 95% CI [−0.72, 0.59]; P = 0.85), whereas those ≤ 50 min per session had significant effects (SMD = −0.61; 95% CI [−1.07, −0.15]; P = 0.009), as presented in Table 2.
A total of six studies explored the impact of exercise intervention duration and frequency on BMI in adolescents with AN [8, 13, 15, 22, 24, 25]. However, one study [15] was excluded because of missing data on intervention duration or frequency, leaving five studies for subgroup analysis. The results are as follows: intervention duration: neither interventions ≤ 8 weeks (SMD = −0.11; 95% CI [−0.46, 0.24]; P = 0.59) nor those > 8 weeks (SMD = −0.05; 95% CI [−0.89, 0.79]; P = 0.91) had significant effects on BMI.Frequency: Interventions administered twice per week (SMD = −0.15; 95% CI [−0.81, 0.51]; P = 0.65) or three times per week (SMD = −0.07; 95% CI [−0.50, 0.36]; P = 0.74) did not significantly affect BMI.Session duration: Interventions lasting ≤ 50 min (SMD = −0.07; 95% CI [−0.50, 0.36]; P = 0.74) and ≥ 60 min (SMD = −0.15; 95% CI [−0.81, 0.51]; P = 0.65) both showed no significant effects.Intervention type: anaerobic exercise did not significantly affect BMI (SMD = −0.10; 95% CI [−0.42, 0.22]; P = 0.53), whereas combined aerobic and anaerobic interventions significantly improved BMI (SMD = 2.85; 95% CI [1.40, 4.30]; P = 0.001). Further details are provided in Table 3.
Two studies assessed the effects of physical activity interventions on quality of life, as measured by the 10 subdimensions of the SF-36 scale, in adolescents with AN [8, 22]. Subgroup analysis revealed no statistically significant effect on any subdimension (all P > 0.05).Both the Bonferroni and Holm corrections were applied. The Holm correction, which employs a stepwise descending approach, provided stricter control over the familywise error rate while improving statistical power. However, both methods yielded adjusted p-values of 1, indicating no significance (reported as “No”). These findings suggest that, even after correcting for multiple comparisons, physical activity interventions did not significantly affect any quality-of-life subdimension. The detailed results are available in Figs. 10 and 11; Table 4.
Fig. 10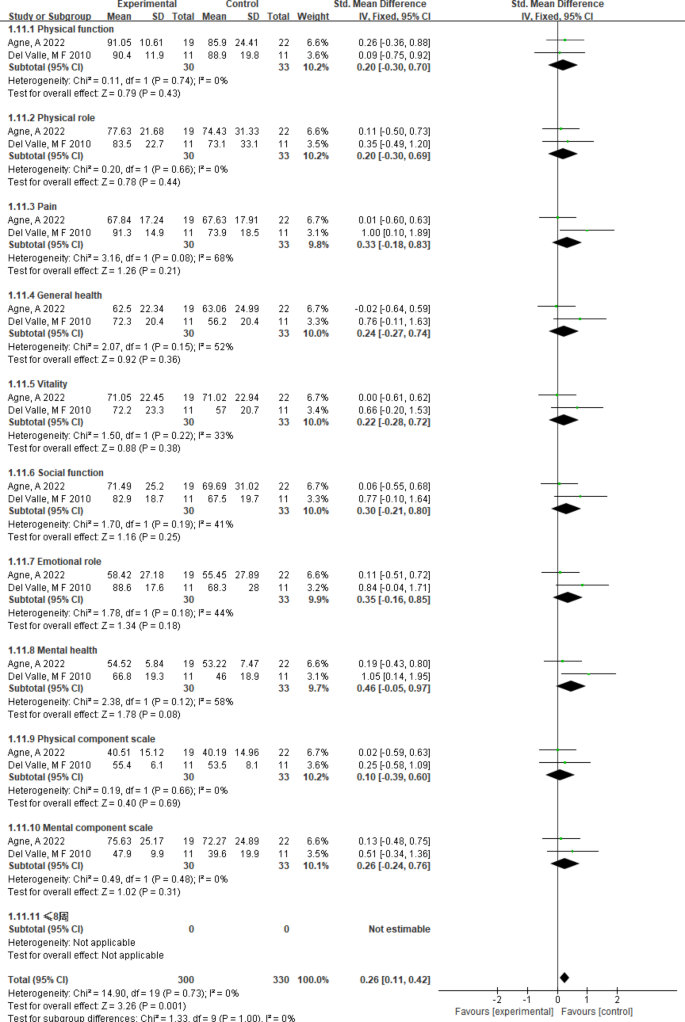
The impact of physical activity intervention on sub items of quality of life
Fig. 11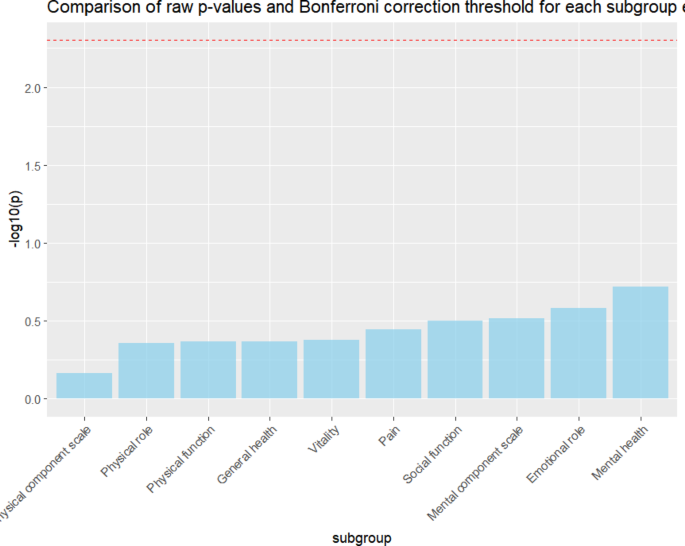
Bonferroni correction and Holm correction plots for quality of life outcome indicators
Table 2 Subgroup analysis of the impact of exercise intervention on weight in adolescents with anorexia nervosaTable 3 Subgroup analysis of the effect of exercise intervention on BMI in adolescents with anorexia nervosaTable 4 Bonferroni and Holm calibration of the impact of exercise intervention on the quality of life of adolescents with anorexia nervosaSensitivity analysis
The researchers performed sensitivity analyses via Stata software, and the results are presented in Figs. 12, 13, 14, 15, 16, 17 and 18. The meta-analysis findings for outcomes including weight, BMI, lean body mass, fat mass, thigh muscle circumference, thigh skinfold thickness, and quality of life indicators remained stable, with no heterogeneity detected.
Fig. 12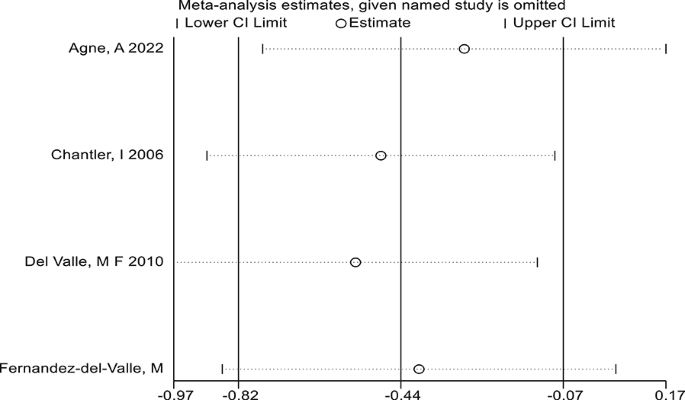
Sensitivity analysis of weight outcome indicators
Fig. 13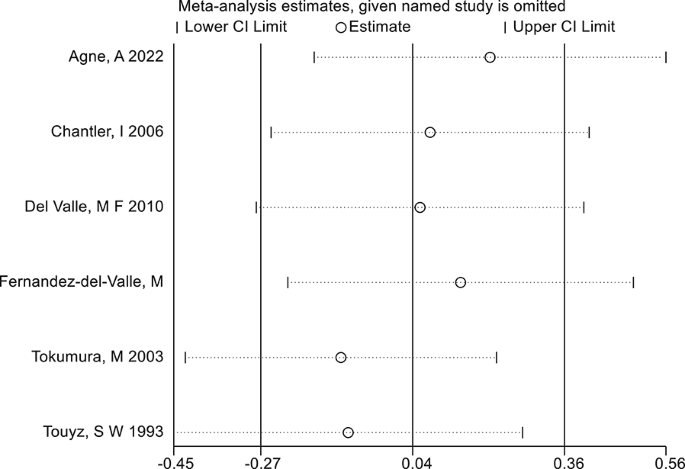
Sensitivity analysis of body mass index (BMI) outcome indicators
Fig. 14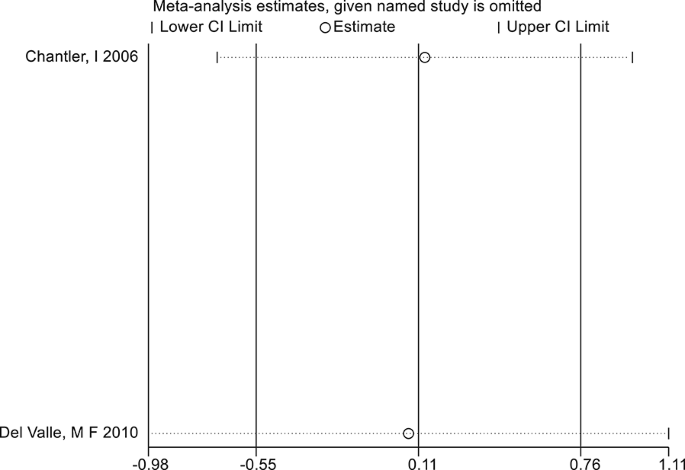
Sensitivity analysis of outcome indicators for lean body mass
Fig. 15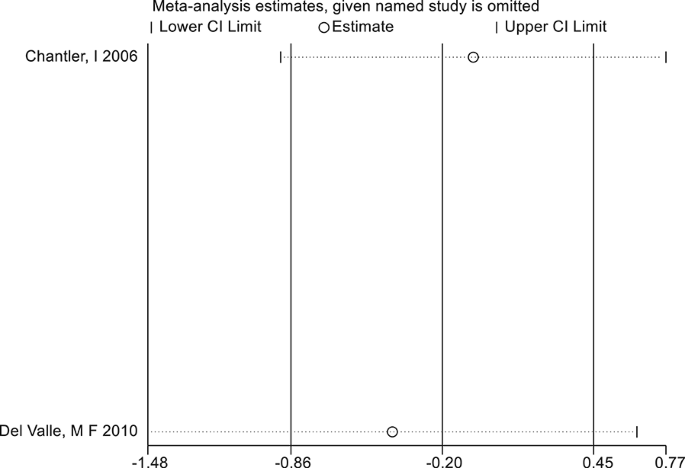
Sensitivity analysis of fat weight outcome
Fig. 16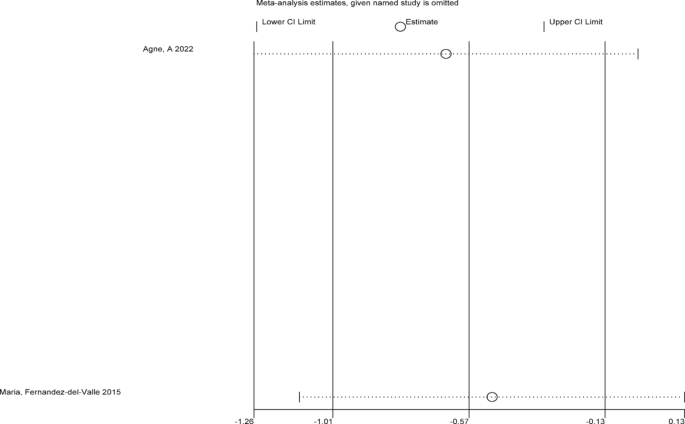
Sensitivity analysis of outcome indicators for mid thigh muscle circumference
Fig. 17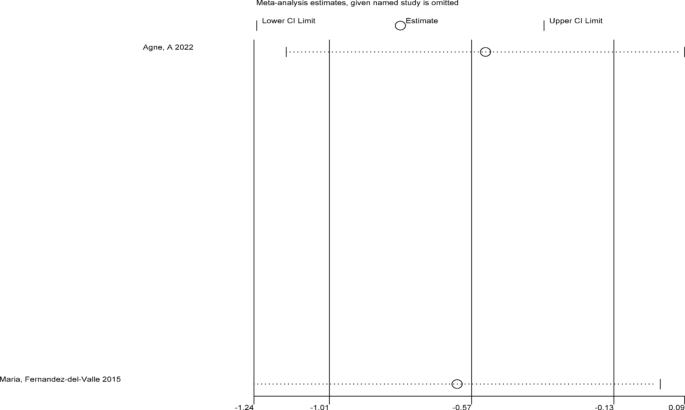
Sensitivity analysis of outcome indicators for mid thigh skin wrinkling degree
Fig. 18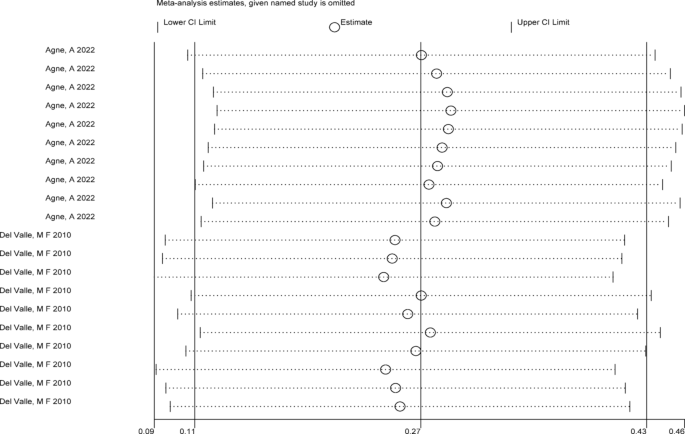
Sensitivity analysis of quality of life outcome indicators
Publication bias test
The researchers used Stata software to construct funnel plots and performed Egger’s tests to assess publication bias for weight and BMI outcomes in adolescents with AN. As shown in Figs. 19, 20, 21, 22, 23, 24 and 25, Appendix 5, and Table 5, no publication bias was detected for weight, BMI, lean body mass, fat mass, thigh muscle circumference, or thigh skinfold thickness (all P > 0.05). However, publication bias was identified for the quality of life outcome (P < 0.05).
Fig. 19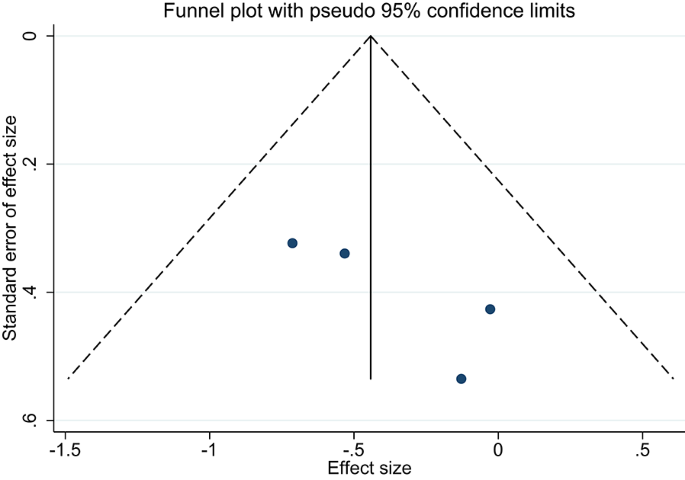 Fig. 20
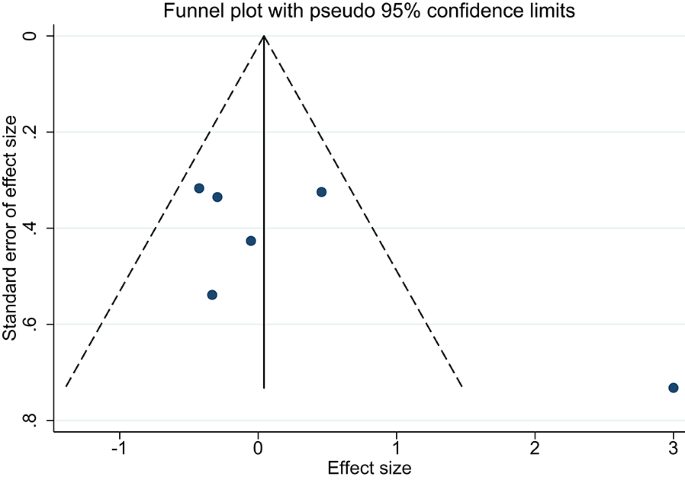 Fig. 21
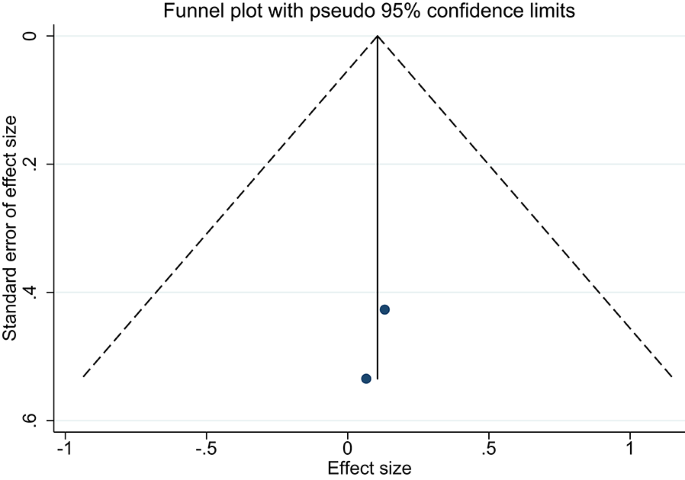
Funnel plot of lean body mass
Fig. 22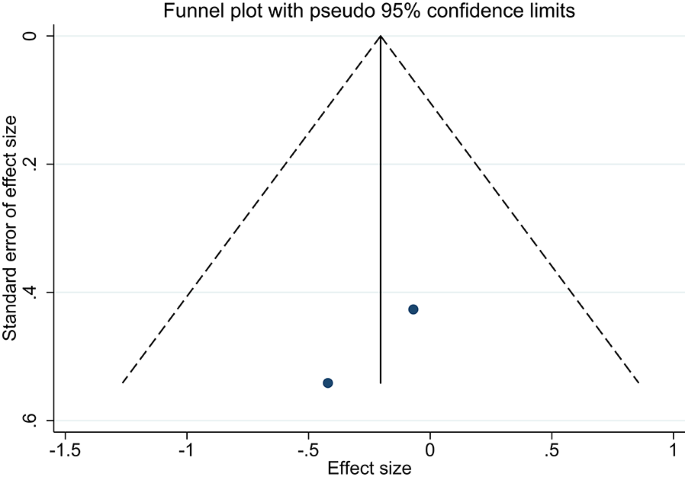 Fig. 23
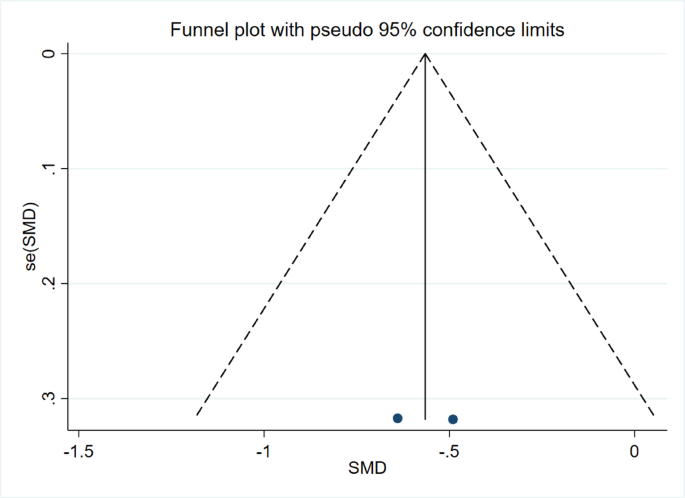
Funnel plot of mid thigh muscle dimensions
Fig. 24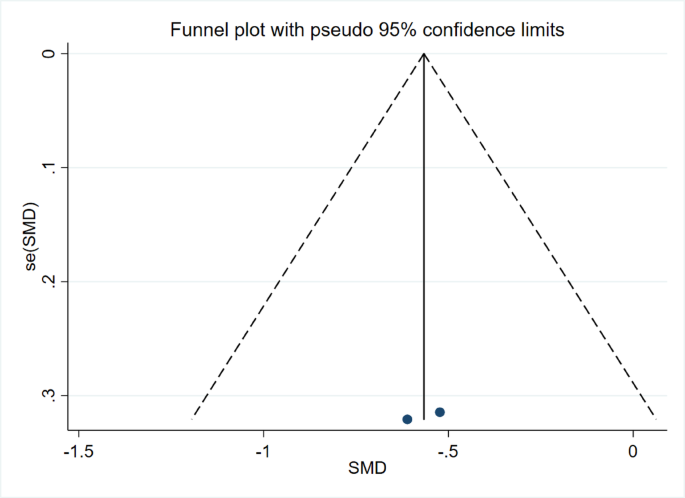
Funnel plot of skin folds in the middle of the thigh
Fig. 25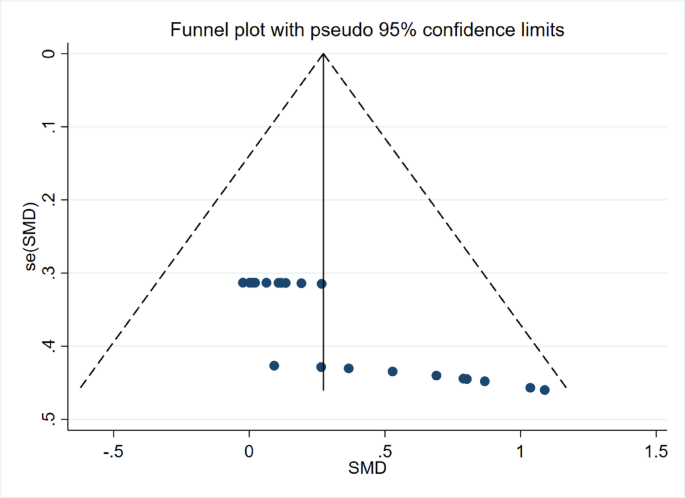
Quality of life funnel chart
Table 5 Publication bias test for adolescent anorexia nervosaRegression analysis
The researchers used Stata software to perform a meta-regression analysis to investigate potential sources of heterogeneity among the included studies. The combined effect size was used as the dependent variable, with intervention duration, frequency, and intensity entered as covariates in the meta-regression model. For outcomes such as weight, BMI, lean body mass, fat mass, thigh muscle circumference, and thigh skinfold thickness, no significant sources of heterogeneity were identified (all P > 0.05). However, a significant source of heterogeneity was found for the quality of life outcome (P < 0.05), as shown in Table 6.
Table 6 Meta regression analysis of adolescent anorexia nervosaAssessment of evidence quality
The researchers used the GRADE system to assess the quality of the included outcome measures. Two distinct levels of evidence quality were identified: low for weight, mid-thigh muscle circumference, mid-thigh skinfold thickness, and quality of life and very low for BMI, lean body mass, and fat mass. For detailed information, refer to Appendix 3.