
Study design and eligibility criteria
Infants were selected from a database of data recorded by our research group between 2017 and 2025 at the John Radcliffe Hospital, Oxford University Hospitals NHS Foundation Trust, Oxford, UK. Ethical approval was obtained from the National Research Ethics Service (references: 12/SC/0447, 23/NW/0155 and 19/LO/1085), and informed written parental consent was obtained prior to each study. All studies were in accordance with the standards of the Declaration of Helsinki and adhered to Good Clinical Practice guidelines.
We included studies in which continuous vital-sign recordings were obtained from preterm infants. The eligibility criteria for recording sessions and apnoea episodes were:
Age: Postmenstrual age (PMA) < 37 weeks at the time of recording (study focus: preterm infants).
Mode of ventilation: Infants were included if they were self-ventilating in air (SVIA) or receiving low-flow or high-flow oxygen therapy (the latter delivered via Vapotherm Precision Flow). Infants receiving other forms of respiratory support were excluded to ensure that extracted apnoea episodes and their physiological responses were not influenced by mechanical ventilation.
Apnoea detection: A recording was included only if at least one apnoea (pause in breathing >5 s) was detected.
Stable cardiorespiratory baseline: Apnoea episodes were excluded if, during the 90 s before apnoea onset, oxygen saturation fell below 85%, heart rate fell below 100 bpm, or heart rate exceeded 200 bpm. This requirement ensured that included apnoeas began from a reasonably stable cardiorespiratory baseline so subsequent changes could more plausibly be attributed to the apnoea itself.
Medication: Infants receiving antibiotics, morphine or fentanyl at the time of the apnoea episode were excluded.
Of note, some infants receiving high-flow oxygen received this using automated oxygen control (delivered via the Vapotherm oxygen assist module), which automatically titrates the FiO2 according to the infant’s oxygen saturations to achieve a preset target saturation. This was initiated in our unit from 2021 onwards and is locally recommended in all preterm infants <32 weeks (until 36 weeks PMA) and infants with PPHN (persistent pulmonary hypertension of the newborn), under clinician discretion. For the rest of the infants receiving high-flow oxygen, FiO2 is manually controlled by clinical staff.
Participants and recordings
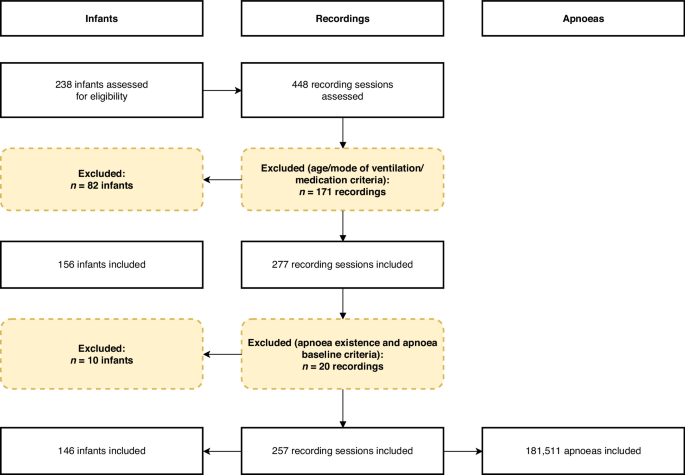
Based on age, ventilation mode and medication criteria, there were 277 recordings from 156 infants eligible for inclusion in the study. After next including the apnoea criterion, the eligible sample size decreased to 257 recording sessions in 146 infants. 181,511 eligible apnoeas were detected from these included recordings (detailed apnoea detection rules are in section ‘Identification and classification of apnoea events’).
The 257 included recording sessions totalled 23,854 h of vital signs recordings (median: 50.2, range: 0.7–634.3 h per recording). Of the included 146 infants, 99 had one recording session only, 19 had two sessions and 28 had three or more. The length of recording varied considerably due to differences in study design at the time of data collection. Some infants took part in a research study where multiple test occasions were conducted, with vital signs recorded continuously throughout the hospital stay. This subset included 39 infants, contributing 133 test occasions, with a median recording length of 155.9 h per session (range: 0.9–634.3 h). Other research studies recorded single epochs of vital signs, with a median duration of 19.6 h (range: 0.7–242.0 h). Nine recordings from nine unique infants had a recording duration longer than 2 weeks. To ensure that these extended recordings did not disproportionately influence the results, we conducted a sensitivity analysis, repeating the statistical analysis using only those recordings with a duration of less than 2 weeks (i.e. the nine recordings from nine infants that exceeded 2 weeks in duration were excluded from this sensitivity analysis). No meaningful differences were observed between the findings from the complete dataset and those from the restricted dataset (Supplementary Table 1). Therefore, all recordings were included in the analysis regardless of recording length.
Data collection
Each infant had continuous vital signs monitoring as part of standard clinical care. Monitoring was conducted using Philips IntelliVue MX800 or MX750 monitors, and data were continuously downloaded using an electronic data capture system (iXtrend, ixitos, Germany). Vital signs including heart rate, oxygen saturation and respiratory rate (as calculated by the monitor) were recorded at a sampling rate of 0.97 Hz. Additionally, high-resolution physiological signals were captured: the electrocardiograph (ECG), used to determine heart rate, was sampled at 250 Hz and recorded via three chest electrodes; the impedance pneumography (IP), used to assess respiration, was sampled at 62.5 Hz via the same chest electrodes; and the photoplethysmography (PPG), used to monitor oxygen saturation and pulse, was sampled at 125 Hz from a probe placed on the infant’s hand or foot.
Relevant demographic and clinical information for each infant was extracted from medical records for each recording session. The demographic and clinical indicators investigated as potential modulating factors are defined as follows:
Sex: the biological sex at birth.
PMA: postmenstrual age in weeks at the time of recording.
GA: gestational age in weeks at the time of birth.
Weight z-score: the infant’s weight z-score at the time of recording, relative to their PMA, calculated according to the guideline published by the RCPCH,23 using the UK-WHO preterm weight data24 as reference.
Ventilation: the mode of respiratory support the infant was receiving at the time of recording (self-ventilating, low flow, or high flow).
Apgar (5 min): Apgar score at 5 min after birth.25
The dynamic features considered as modulators are defined as follows:
HR baseline: the mean heart rate during the baseline period (90 s preceding the apnoea).
SpO2 baseline: the mean oxygen saturation during the baseline period (90 s preceding the apnoea).
Time since last apnoea: the interval between the end of the most recent apnoea and the start of the apnoea of interest in seconds.
5-min apnoea rate: the number of apnoeas within the last 5 min preceding an apnoea.
Data analysisIdentification and classification of apnoea events
Pre-processing and analyses were performed in MATLAB (ver. 2024a; MathWorks Inc., Natick, Massachusetts) and Python (ver. 3.11.5; Python Software Foundation, Wilmington, Delaware). Inter-breath intervals (IBIs) were identified from the impedance pneumograph (IP) signals, by applying a previously validated algorithm.26 Briefly, the algorithm first filters the signal to reduce the noise introduced by movements and cardiac activity. It then identifies individual breaths using an adaptive amplitude threshold. Finally, the algorithm eliminates false positive apnoeas (e.g. due to shallow breathing or poor signal) using a Support Vector Machine (SVM) classifier (trained on a data set independent from the current data). The machine learning classifier developed in this algorithm was validated on IBIs greater than 15 s only.26,27 Since we were also interested in short pauses in breathing in this study, IBIs between 5 and 15 s were filtered using a new independent machine learning algorithm (Supplementary Methods A).
All IBIs lasting between 5 and 40 s that were identified by the machine learning algorithms as true apnoeas were included in this study as apnoea events. IBIs exceeding 60 s were manually checked before including as apnoea events, as clinical experience indicates these are more likely to be false positives than true apnoea episodes. IBIs between 40 and 60 s were manually reviewed if they were associated with less than 20% drop in either heart rate or oxygen saturation, as these were also more likely to be false positives. During the manual review, both the original and filtered IP signals were examined to determine whether the detected pauses in breathing were due to potential connection issues causing abnormal signals, or genuine apnoeas characterised by a clear cessation of breathing.
Definition of cardiorespiratory outcomes and analysis windows
Desaturation events were defined as a decrease in oxygen saturation to below 85% lasting for at least five consecutive seconds. Bradycardia was defined as a decrease in heart rate of more than 30% from baseline lasting for at least five consecutive seconds. Whilst bradycardia in neonates is often defined as a heart rate below 100 or 110 beats per minute, older infants have baseline heart rates close to this range without any physiological compromise. Consequently, using a definition of bradycardia as less than 100 beats per minute meant that bradycardia rates increased with increasing PMA, distorting results (Supplementary Methods B, Supplementary Fig. 1). In contrast, when using a definition of 30% from the baseline, consistent with definitions used in other literature,28,29 rate of bradycardia does not change with PMA (Supplementary Fig. 1).
The baseline period was defined as the 90 s preceding the start of each apnoea episode, and the post-event period was defined as the interval from the onset of an apnoea episode to 10 s after its end. These time frames were chosen to capture delayed cardiorespiratory effects, as changes in heart rate and oxygen saturation may lag behind apnoea due to physiological response times and pulse oximeter delay, and are typically fully captured within 10 s after the end of the apnoea.17 The window was not extended further to minimise potential confounding and to ensure that observed changes were associated with the apnoea.
Resampling and capping
As the number of apnoeas per infant and per recording had a very wide range, to ensure the results were not overly influenced by infants with higher numbers of apnoeas, we generated 500 resampled datasets by randomly sampling apnoea events within each recording, capping the number at 200 per recording. This approach reduced the influence of recordings with large numbers of events while allowing estimation of parameter variability. All the statistical and machine learning analysis were performed on resampled datasets and aggregated using the methods below. A flowchart of the analysis steps and modelling procedure is presented in Supplementary Fig. 2.
Descriptive analysis of physiological responses by apnoea duration
For visualisation purposes, the associated physiological responses were compared with apnoea duration using sliding windows of 5 s’ duration with 70% overlap. Windows with fewer than 20 data points, or derived from fewer than three unique recordings, were excluded from the plots. Within each window, summary statistics were estimated on 500 resampled datasets. For each resampled dataset and duration window, the mean change in heart rate, mean minimum oxygen saturation and the proportion of apnoeas associated with bradycardia and/or desaturation (apnoea with bradycardia/desaturation) were calculated. Across replicates, the distribution of each statistic was used to derive the mean estimate and corresponding 95% confidence intervals. In addition, Pearson’s correlation coefficients were computed to quantify the linear association between apnoea duration and each physiological outcome.
Mixed-effects modelling of factors associated with apnoea-related instability
This analysis aimed to distinguish between overall effects of each factor on the risk of cardiorespiratory instability (i.e. the likelihood of an apnoea of any duration being associated with bradycardia and/or desaturation), and interaction effects indicating whether a factor modulates the relationship between apnoea duration and instability. In other words, we examined both general risk differences between infants and whether specific characteristics alter the duration–response association.
Logistic mixed-effects models were employed on the resampled datasets to analyse the influence of factors on the relationship between apnoea duration and cardiorespiratory responses. Each observation in the model represented a single apnoea event. The two-way interaction terms between apnoea duration and each factor of interest (sex, PMA, GA, weight z-score, ventilation, Apgar score at 5 min, heart rate baseline, oxygen saturation baseline, time since last apnoea and the number of apnoeas in the past 5 min) were included as fixed effects in separate models. Recording session ID and infant ID were included as random effects to account for repeated measures within infants. The response variable was binary, indicating whether the apnoea was associated with bradycardia and/or oxygen desaturation occurring from the onset of the apnoea until 10 s after its end (0 = no associated bradycardia or desaturation; 1 = associated bradycardia and/or desaturation). The model coefficients and associated p-values from all replicates were extracted and combined across resampled datasets. For each fixed-effect term, we calculated the mean coefficient (representing the average effect size). The mean coefficient corresponded to the log-odds ratio, and its exponential transformation was used to obtain the odds ratio. We also derived the 95% confidence intervals (CIs) for each coefficient and determined whether the aggregated coefficients were significant by assessing whether the 95% CI crossed the null value. In addition, figures were generated using the resampled datasets in a similar manner to that described in section ‘Descriptive analysis of physiological responses by apnoea duration’, but stratified by each feature. Stratification thresholds were selected to reflect either clinically meaningful cut-offs or values close to the median of the respective feature.
Machine-learning prediction of apnoea-related instability
We constructed binary classification models using the eXtreme Gradient Boosting (XGBoost) algorithm to predict apnoea-related bradycardia and/or desaturation events using clinical/demographic and dynamic features. Model development was restricted to a complete-case subset with no missing feature values (N = 153,947 apnoeas), and apnoea episodes with missing features were excluded (N = 27,564). The response variable was binary, again defined as 0 for apnoea episodes not associated with bradycardia or desaturation (N = 146,053; 94.9%) and 1 for apnoea associated with bradycardia and/or desaturation (N = 7894; 5.1%). The dataset was partitioned at the subject level into a training set (N = 131,638) and a held-out test set (N = 22,309), stratified by apnoea duration (<10 s or ≥10 s), PMA and the response variable to ensure a similar proportion of apnoeas across these variables in the training and test set. All recording sessions from the same infant were allocated in the same set. Sub-models were trained on 10 independently resampled versions of the training data and combined via averaging. Model training involved tuning of hyperparameters (Supplementary Method C) via random search with 500 iterations, using internal 10-fold cross-validation on the training set. Out-of-fold (OOF) predicted probabilities were generated on the training set. Classification thresholds were selected by evaluating all candidate thresholds on the OOF predictions and choosing the threshold that maximised balanced accuracy. An ensemble model was constructed from the models trained on all resampled versions of the training data. Model performance was then evaluated on the independent test set using balanced accuracy and area under the receiver operating characteristic curve (AUROC).
Permutation testing of model performance
To evaluate whether the XGBoost classification model performs significantly better than chance, permutation tests were conducted for every model. This method involves generating a null distribution of predictive performance by training the classifier on data (1000 permutations) in which the class labels in the training set were randomly permuted. For each permutation, a new XGBoost model was trained and evaluated on the same test set. The p-value was then calculated as the proportion of permuted models that achieved an accuracy equal to or greater than that of the original model. The evaluation was done on the fixed, held-out test set, which was not used in any stage of model training or tuning.
Model-interpretation analysis of predicted risk profiles using synthetic data
To better understand how the trained model combined demographic and clinical features across all possible combinations of features to predict the risk of apnoea-related bradycardia/desaturation, we performed a model-interpretation analysis using synthetic data. The synthetic dataset was not used for model training or validation. It was generated to systematically sample the feature space and assess the predictions of the trained model across a wide range of possible combinations of input variables that may be underrepresented or absent in the observed data. This enabled us to identify the combinations of demographic and clinical characteristics associated with relatively high and low predicted risk within each apnoea-duration category. It is profile-based rather than variable-based and therefore complements, rather than replaces, the mixed-effects analyses of individual factors and interactions. Moreover, the purpose was descriptive and interpretative, not causal and should not be considered a new independent test of the contribution of individual variables.
Synthetic data were generated by randomly sampling each feature from a uniform distribution 10,000 times. Ventilation mode was sampled categorically, with the probability of each mode set to match the observed distribution of ventilation modes among infants of the corresponding age and sex in the real dataset. The optimised model which only used demographic and clinical variables was applied to the synthetic dataset to generate predicted risk scores for apnoea with bradycardia/desaturation for each observation. Predicted events were stratified by apnoea duration into three categories: 5–10 s, 10–20 s and ≥20 s. Within each duration category, comparisons were conducted between high- and low-risk groups, defined as the highest and lowest 10% of predicted risk, respectively. To avoid pseudo-replication arising from multiple observations per recording, all risk-group comparisons were performed at the subject level. Specifically, subjects were ranked according to their mean predicted risk within each duration category, and those in the highest and lowest 10 percentiles were compared. The comparisons were done on demographic or clinical variables only. For continuous variables, group differences were assessed using Welch’s two-sample t-test, while categorical variables were compared using Fisher’s exact test or Pearson’s χ² test, as appropriate. All statistical tests were two-sided, with significance evaluated using conventional thresholds (p < 0.05, p < 0.01, p < 0.001).