
Trap 1: imperfect source repeatability
AI-0009 in ZW25 does not exhibit the level of repeatability generally expected for high-precision temporal analyses. Although ZW25 presented many examples of visually similar waveforms (see Fig. 2b therein), the pair exhibits much poorer waveform similarity elsewhere, across different stations and seismic phases. Even the direct P-waves at the same station IU.SDV exhibits noticeable misalignments for both vertical (Z) and radial (R) components (Fig. 2 and Supplementary Fig. 1).
Fig. 2: Imperfect source repeatability of the AI-0009 earthquake pair illustrated by direct P-waves at station IU.SDV.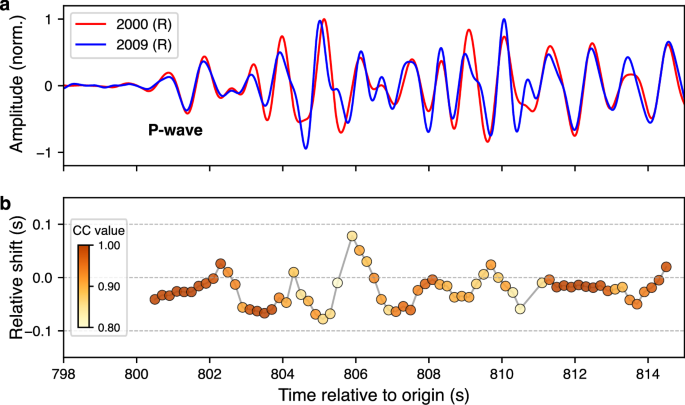
a Normalized R-component waveform from the two events. The waveforms are aligned after origin-time correction and band-pass filtered between 0.8 and 2.0 Hz, following the same procedure used in ZW25 for P waves. Note the waveform differences within the P-wave energy train. b Relative cycle-to-cycle time shifts measured using the moving-window cross-correlation (MWCC) approach (see Methods). Each circle represents the time shift measured for a 1-s window centered at the plotted time, color-coded by the corresponding cross-correlation coefficient (CC).
Here we use a moving-window cross-correlation (MWCC) approach (Methods) to measure relative time shifts between individual wave cycles within the P-wave energy train (Fig. 2b). The trend and the peak-to-trough amplitude of these time-shift measurements are independent of the travel-time corrections from relocation, because relocation introduces only a constant time offset and does not affect their relative variations. Misalignments between adjacent cycles readily reach ~0.1 s, already exceeding the shear-wave anomalies reported by ZW25. More examples of less similar waveforms from many other global stations are presented in Supplementary Fig. 2. Visual examination of the original waveforms presented in Fig. 2b of ZW25 also reveals several cases of waveform misalignment of ~0.1 s for S-waves at other stations, e.g., the phase onset in the T component of AZ.PFO, ~13 s at the R component of BK.CMB, ~10 s at the T component at CI.MWC, etc. These wiggles all show a similar magnitude of misalignment to those of the SKS and S-Scd-ScS arrivals at station IU.SDV, but they have relatively short epicentral distances and do not interact with the D” layer. Such waveform inconsistencies collectively caution that AI-0009 may not meet the criteria for a reliable pair of repeating earthquakes for the purpose of detecting small temporal changes along the raypaths.
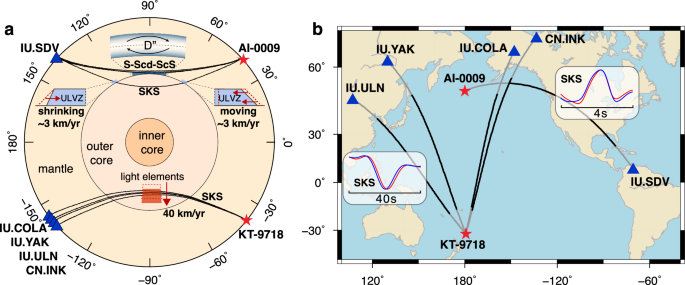
KT-9718 in Z22 is not a repeating earthquake pair. Z22 does not consider it as a pair of repeating earthquakes, but rather as “earthquakes at close hypocenters”. However, the underlying methodology is essentially the same and is therefore subject to similar issues arising from small but non-negligible source differences. Here, we define the double-differential time shift between two phases or energy packets (X and Y) in two repeating waveforms as δt(Y-X), representing the arrival-time difference of phase Y in the later event relative to the earlier one after aligning phase X. Z22 interpreted the observed ~1-s negative δt(SKS–Pdiff/PP), which corresponds to an earlier arrival of SKS in the later event, as anomalously large and attributed it to outer-core structural changes (Fig. 1). Below, we show that this magnitude of δt can instead be largely accounted for by source difference (e.g., hypocenter separation of only a few kilometers) and the associated mantle heterogeneity.
We also apply the MWCC approach (Methods) to examine time shifts in both clearly identifiable phases, including SKS, and less well-defined energy packets (Fig. 3b). The MWCC results allow us to estimate the relative shift between any two phases. In fact, δt between two phases or energy packets (the vertical separations between the circles in Fig. 3b) can reach over 2 s, although the SKS time shift appears as a negative anomaly.
Fig. 3: Waveform comparison and MWCC measurements for KT-9718 recorded at station IU.ULN.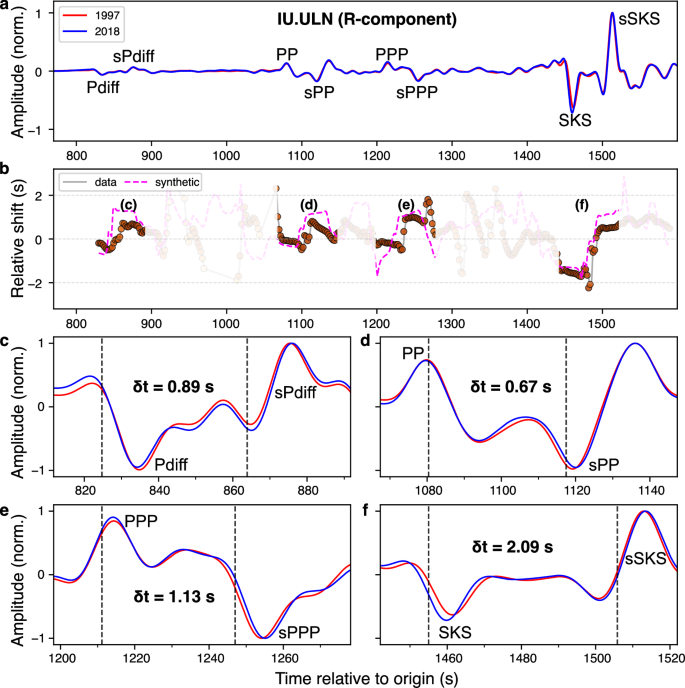
a Normalized radial (R)-component waveforms from the two repeating earthquakes. Major seismic phases and their associated depth phases are labeled near the traces; note P-radiated depth phases, which may overlap with S-radiated depth phases, are not individually labeled for clarity. The waveforms are aligned by cross-correlation over the entire time window, with the 2018 waveform shifted leftward by 2.25 s. b Relative time shifts measured using the MWCC method. Each circle represents the time shift obtained for a 20-s sliding window, color-coded by the corresponding CC (same color scale as in Fig. 2b). Windows containing clear seismic phases are labeled (corresponding to the panels below), while the remaining windows are shaded for contrast. The magenta line shows the predicted MWCC time shifts from synthetic waveform pairs, assuming a 5.2 km shallower source depth for the 1997 event (see text and Supplementary Table 2). c–f Zoomed-in waveform comparisons for selected seismic phases and their associated depth phases. Dashed vertical lines indicate the theoretical arrival times of the labeled phases, and the relative time shifts (δt) between the main phases and their corresponding depth phases are annotated in each panel. See Supplementary Figs. S3–S5 for corresponding measurements at stations IU.COLA, IU.YAK, and CN.INK.
A particularly informative feature, not discussed in Z22, is the systematic behavior of the depth phases. For all four relevant stations (Fig. 3 and Supplementary Figs. S3–5), the separation between each direct phase (Pdiff, PP, PPP, and SKS) and its corresponding depth phase is consistently larger for the 2018 event, indicating a deeper source origin in 2018. This pattern is broadly consistent with the cataloged depth difference of 6.7 km between the two events (Supplementary Table 1).
To quantify the effect of source-depth difference, we measure δt(sSdiff–Sdiff) for global stations within an appropriate distance range (Methods). The value of δt(sSdiff–Sdiff) depends primarily on source-depth difference and is expected to be a constant across all stations under a 1-D Earth model. We obtain a mean value of 2.20 ± 0.57 s (1σ) from 19 stations with high-quality transverse (T)-component records for both events (Supplementary Table 2). The result corresponds to a relative depth difference of 5.21 ± 1.35 km under the PREM model11. More importantly, deviations of δt(sSdiff–Sdiff) from a constant value across different stations are expected in real data. They provide an empirical estimate of the total uncertainty (2σ = 1.14 s) arising from both cross-correlation measurement errors and unmodeled three-dimensional mantle heterogeneity sampled by slightly offset source locations.
This depth offset alone predicts a relative time shift of ~0.6 s for δt(SKS-Pdiff/PP/PPP) from ray theory using the 1-D PREM model. The estimate is also consistent with results from full-wave simulations incorporating the degree-40 mantle model (S40RTS12; Fig. 3b, Supplementary Figs. S3–6; also see Methods). Notably, within the main phase windows, including SKS, the MWCC measurements from the observed data closely match those from the synthetic waveforms in both amplitude and pattern (shaded regions in Fig. 3b and Supplementary Fig. S3b, 4b, 5b), providing further support that the source-depth difference is the dominant factor of observed relative time shifts. Therefore, source-depth difference by itself can account for over half of the differential travel times previously interpreted as evidence for outer-core temporal change, with the residuals ( ~ 0.4 s) falling within both the maximum uncertainty of 0.5 s adopted in Z22 and our estimated uncertainty (1.14 s).
We further examine δt(SKS–Pdiff/PP) for global stations at epicentral distances of 98°–144°, the same range considered in Z22. We find that the values are consistently negative across all 15 northern-hemisphere stations with high-quality waveform records (mean = -1.04 s; Fig. 4 and Supplementary Fig. S7–21). Consequently, the magnitudes reported for the four stations highlighted in Z22 fall well within the typical range expected for teleseismic phases sampling similar source-receiver geometries and are not anomalous. We also observe a comparable relative time shift of S/ScS measured on the transverse (T) component, where core-related energy is greatly suppressed. As exemplified in Supplementary Fig. 22, the measured δt(Sdiff-Pdiff) or δt(S/ScS-P) values at station IU.ULN and several teleseismic stations along similar azimuthal tracks are also close to the reported SKS anomalies. The consistency of these δt measurements, in both sign and magnitude, across different stations and phase pairs, further indicates that the ~1 s time shifts are not unique to core-sampling phases observed at only a few stations, but are better explained by the source-location difference and associated mantle heterogeneity sampled along closely spaced ray paths.
Fig. 4: Measurements of δt(SKS–Pdiff/PP) for teleseismic stations in the Northern Hemisphere.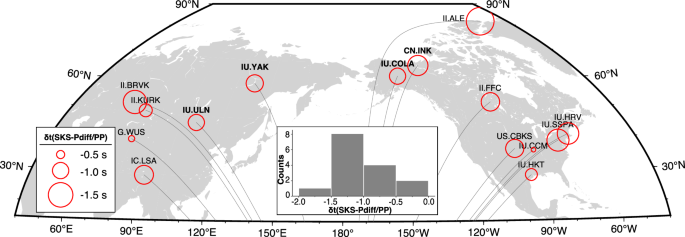
They are obtained for stations at epicentral distances of 98°-144°, the same range considered in Z22, with an inset histogram summarizing the measurement distribution. For the reference P phase, Pdiff is used at epicentral distances ≤110°, and PP is used at distances >110°. The four stations highlighted in Z22 are labeled in bold. Corresponding waveforms for the measurements are shown in Supplementary Figs. S7–21.
Trap 2: station-related issues
A highly similar pattern of apparent waveform change in ZW25 had already been reported by ref. 3 (see Fig. 13d therein) at the same station IU.SDV. In that case, however, the signal came from repeating earthquakes in a different region (Sumatra) and appeared in a different phase (PKIKP) at a much larger epicentral distance of ~160°. While ref. 3 originally attributed the observed waveform change to rapid inner-core boundary (ICB) processes; the recurrence of an almost identical pattern from different seismic phases at the same station strongly suggests that station-related issues may be responsible.
Below, we examine this possibility from waveform comparisons between co-located sensors at the station IU.SDV. In the GSN, many stations are equipped with two sets of sensors, a primary sensor and a secondary sensor, typically distinguished by location codes “00” and “10”, respectively. Because the two instruments record the same ground motion at the same site, their waveforms should be identical; any timing or phase discrepancies between them therefore provide a direct diagnostic of station clock accuracy and instrument stability13,14.
For the pair AI-0009, the later event in 2009 was recorded by co-located sensors. We therefore apply the MWCC approach to examine waveform differences between the two sensors on all three components. Across a one-hour window following the event origin time, misalignments between the waveforms recorded by co-located sensors are commonly observed (Fig. 5). Based on the distribution of time shifts from all three components (Fig. 5c–e), the ~0.1 s SKS and S-Scd-ScS shifts reported in ZW25 fall well within the range of these shifts, which are associated with sensor instability or transient clock drifts, for example due to deterioration of the instrument phase response or loss of GPS synchronization14,15.
Fig. 5: One-hour MWCC measurements between co-located sensors at station IU.SDV.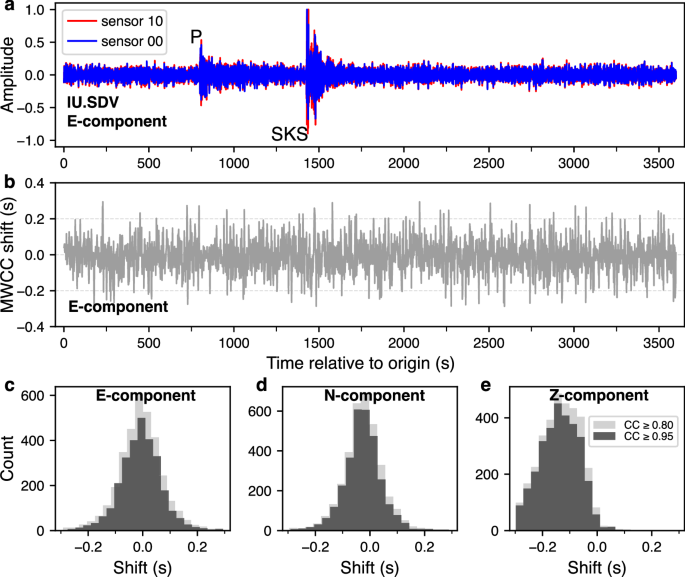
a Normalized east-west (E)-component waveforms from two sensors, plotted relative to the origin time of the later event of the AI-0009 pair. The main P and SKS phases are indicated. b Corresponding MWCC time shifts measured on the E component over the same one-hour interval. c–e Histograms of MWCC time shifts for the E, N (north-south), and Z (vertical) components, respectively. For each component, results obtained with different quality thresholds (CC ≥ 0.80 in light gray and CC ≥ 0.95 in dark gray) are shown for comparison.
In the SKS and S-Scd-ScS phase windows, the waveform differences between those from co-located sensors closely resemble the waveform temporal changes of AI-0009 reported by ZW25. As illustrated in Fig. 6, the radial component waveforms from co-located sensors also show a clear mismatch in the onset cycle of the two phases. When MWCC is applied, this mismatch produces a time shift of ~0.1 s, after which the subsequent wiggles align better. This highly similar pattern to that found in ZW25 strongly suggests that the observed temporal differences originate largely, if not entirely, from station-specific issues (e.g., instrument noise or uncertainty in the phase response) rather than structural changes in the lowermost mantle.
Fig. 6: Comparison between inter-sensor waveform inconsistencies and the temporal-change signals reported by ZW25.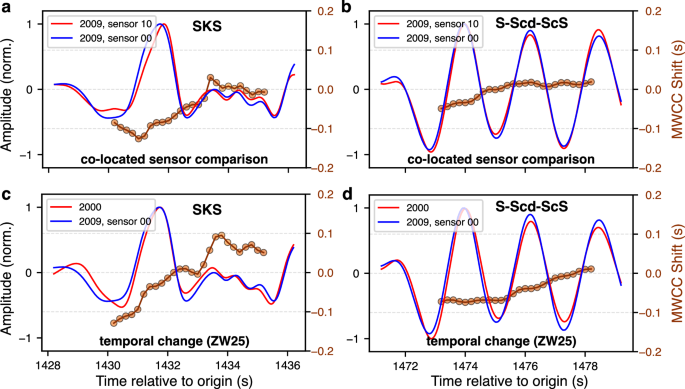
a, b Comparison between two co-located sensors (sensor 10 in red and sensor 00 in blue) recording the 2009 event at station IU.SDV for the SKS and S–Scd–ScS phases, respectively. The corresponding MWCC time shifts are shown by the connected brown circles (color-coded as in Fig. 2b) and are referenced to the right-hand axis. c, d Waveform temporal changes proposed by ZW25 for the same two phases, based on waveform comparisons between the 2000 and 2009 events. MWCC time-shift measurements are plotted in the same manner as in (a, b). Note the waveform alignment follows that shown in Fig. 1 of ZW25.
Similarly, the SKS waveform temporal variations reported by Z22 may also be influenced by timing issues at the relevant stations. The timing-quality metrics for these stations indicate relatively poor timing performance, particularly for the 1997 recordings (see Supplementary Text and Supplementary Fig. S23). Moreover, comparisons of waveforms recorded by co-located sensors in 2018 reveal occasional time shifts exceeding 1 s at stations IU.ULN and IU.YAK (Supplementary Fig. 24). Therefore, transient clock issues or phase uncertainties may also contribute to the reported SKS time shifts, in addition to the effects of source differences and the associated mantle heterogeneity demonstrated above.