
Study design and population
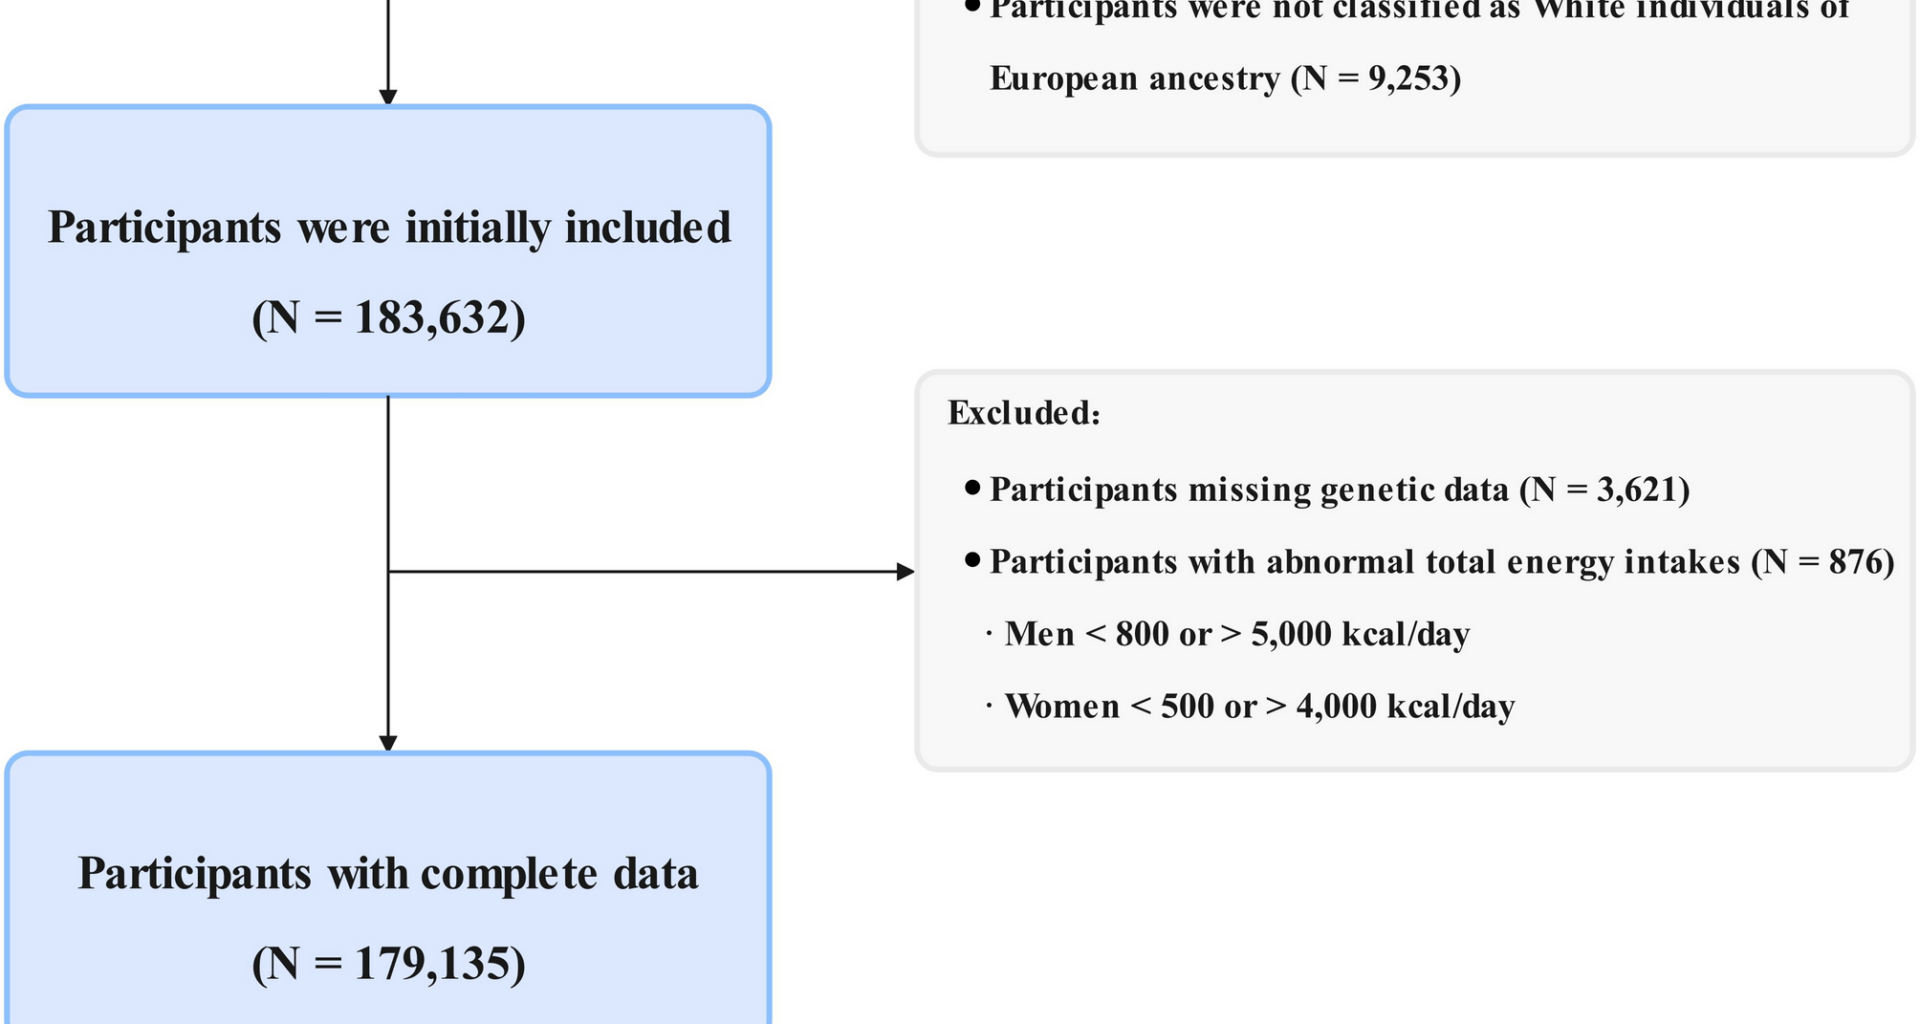
Study design and methods of UK Biobank have been reported in detail previously [17]. For this analysis, we excluded participants who did not complete the 24-hour food recall questionnaire (n = 291,290), those diagnosed with any cancer at baseline (n = 17,957), those who were not of white European ancestry (n = 9,253), those with incomplete genetic data for constructing the PRS at baseline (n = 3,621), those with implausible total energy intake (men < 800 or > 5,000 kcal/day; women < 500 or > 4,000 kcal/day; n = 876) [18], and male participants (n = 82,940). The final analytic sample included 96,195 participants (Fig. 1). The present study was conducted under application number 211,772 of the UK Biobank data resource.
Fig. 1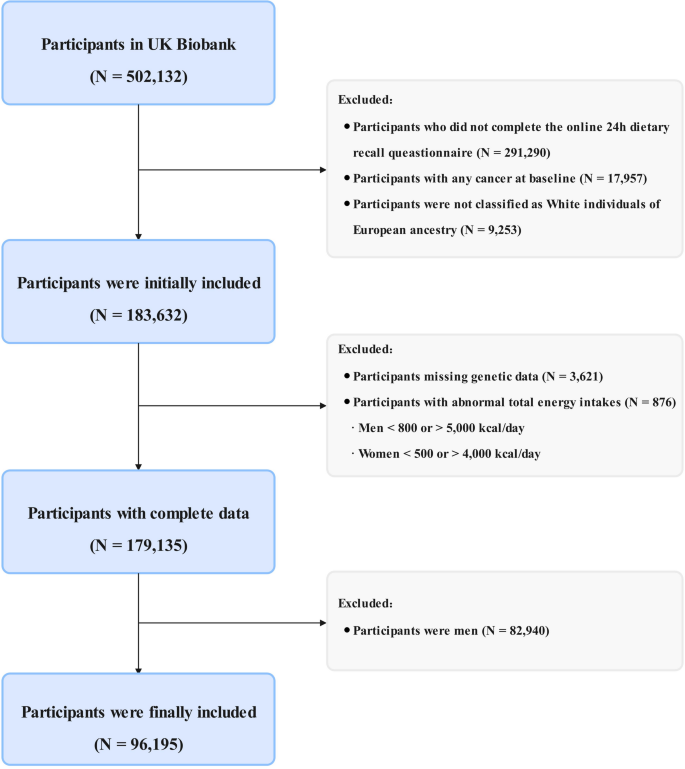
Flow chart of the study design
Definition of dietary index for gut microbiota
The calculation of the DI-GM was based on dietary data from the UK Biobank, which involved an initial assessment from April 2009 to September 2010 and four subsequent online follow-up surveys. For participants who completed multiple 24-hour food recall assessments, nutrient intake for each dietary component was calculated as the mean of all available measurements, following the methodology by Kase et al. [11]. This mean was used to derive a single, habitual DI-GM score at baseline, which was then treated as a fixed exposure throughout the follow-up period in our analyses, rather than a time-varying covariate.
Our study utilized the DI-GM scoring criteria proposed by Kase et al., which identified 14 food items or nutrients as components of the index [11]. These components were divided into two groups: 10 beneficial factors, including fermented dairy, chickpeas, soybeans, whole grains, fiber, cranberries, avocados, broccoli, coffee, and green tea; and 4 unfavorable factors, including refined grains, red meat, processed meat, and daily energy intake (> 40% from fat) [11]. The DI-GM score was calculated based on the sex-specific median intakes of these components, except for fat intake, which was fixed at 40% of total energy. A score of 1 was assigned to individuals who consumed above the median level of beneficial components or below the median level of unfavorable components; in other cases, a score of 0 was assigned. The total DI-GM score was derived by summing the individual component scores, ranging from 0 to 14. A higher DI-GM score indicates stricter adherence to a diet that is beneficial for gut microbiota [11]. Participants were further categorized into three groups based on their DI-GM scores: low (0–4), moderate (5–6), and high (≥ 7). The scoring criteria, coding information, and portion sizes for each component used in this study are detailed in Supplementary Tables 1–3.
Polygenic risk score for breast cancer
The genetic data from the UK Biobank were genotyped using the UK BiLEVE Array and the UK Biobank Axiom Array. A comprehensive quality control pipeline was subsequently implemented, which included variant-level and sample-level filtering, adjustment for population stratification, and imputation using the Haplotype Reference Consortium panel. To evaluate the genetic predisposition to breast cancer, we constructed a PRS based on 168 single nucleotide polymorphisms (SNPs) that achieved genome-wide significance (P < 5 × 10⁻⁸) in populations of European ancestry. These SNPs were extracted from primary studies [19]. Detailed information on the SNPs is provided in Supplementary Table 4. The PRS was calculated as the sum of risk alleles weighted by their respective effect sizes. Based on their PRS, participants were categorized into three genetic risk groups: low risk (lowest tertile), intermediate risk (middle tertile), and high risk (highest tertile) [20].
Outcome assessment
The primary outcome of interest in our study was incident breast cancer. Breast cancer cases in the UK Biobank were ascertained through record electronic linkage with the National Health Service central registers and death registries in England, Wales, and Scotland. Follow-up ended at the date of the first-ever breast cancer diagnosis, death, or the end date of follow-up (October 31, 2022, for England, May 31, 2022, for Wales, and August 31, 2022, for Scotland), whichever occurred first. Breast cancer was defined as the International Classification of Diseases edition 10: C50. Detailed codes can be found in Supplementary Table 2.
Assessment of covariates
Based on prior literature and biologically plausible associations, potential confounding covariates were identified and assessed [16, 21, 22]. These included: age at recruitment (continuous, years); annual household income (categorized as < £31,000, ≥ £31,000, or unknown/missing); education level (high, medium, or no above); the Townsend Deprivation Index (continuous); anthropometric measures, including height and weight, were collected by trained staff at baseline, and body mass index (BMI) was calculated as weight (kg)/[height (m)]2 (continuous); family history of breast cancer (yes or no) self-reported at baseline; and various lifestyle and behavioral factors, such as total energy intake (continuous, kJ/day), smoking status (never, previous, or current), alcohol consumption (heavy, moderate, or none), physical activity level [low (< 600 metabolic equivalent tasks (MET) minutes/week), medium (600-3,000 MET minutes/week), or high (> 3,000 MET minutes/week)], menopausal status (yes or no), parity (0, 1, 2, or ≥ 3), history of hormone use (yes or no), history of oral contraceptive use (yes or no), and age at menarche (< 13 years or ≥ 13 years).
Missing data for continuous covariates were imputed using mean values, while missing categorical covariates were assigned to an unknown/missing indicator category. Detailed coding information is provided in Supplementary Table 2.
Statistical analysis
Baseline characteristics were described as mean with standard deviation (SD) or median with interquartile range (IQR) for continuous variables, and as counts with percentages for categorical variables, stratified by DI-GM groups. To assess differences, the Kruskal-Wallis test was applied for continuous variables, and chi-square tests for categorical variables.
The proportional hazards assumption was tested using the Schoenfeld residual test, with no violations observed (P > 0.05). Multivariable Cox proportional hazards regression models were used to assess the associations between DI-GM and the risk of breast cancer. Results were expressed as hazard ratios (HRs) and 95% confidence intervals (CIs). Three models were developed: (1) a crude model (unadjusted for any covariates); (2) Model 1, adjusted for age, BMI, and energy intake; and (3) Model 2, further adjusted for annual household income, smoking status, education level, alcohol consumption status, physical activity level, family history of breast cancer, Townsend Deprivation Index, menopausal status, parity, history of hormone use, history of oral contraceptive use, and age at menarche. DI-GM was analyzed both as a categorical variable (with the low group as the reference) and as a continuous variable (per one-score increase). Additionally, we examined the potential nonlinear relationship between DI-GM, PRS, and breast cancer risk using restricted cubic splines (RCS), with knots placed at the 5th, 35th, 65th, and 95th percentiles.
To evaluate the combined effects of PRS and genetic factors on breast cancer risk, participants were categorized into nine groups based on PRS categories. Additive interaction was assessed by calculating the Relative Excess Risk due to Interaction (RERI) and Attributable Proportion (AP), with significance determined using the delta method [23, 24]. Multiplicative interaction was evaluated using likelihood ratio tests.
To evaluate whether the associations between DI-GM and breast cancer risk varied across subgroups, analyses were stratified by age, BMI, education level, Townsend Deprivation Index, smoking status, alcohol consumption, annual household income, menopausal status, parity, history of hormone use, history of oral contraceptive use, and age at menarche.
We conducted a series of sensitivity analyses to assess the robustness of our primary findings: (1) reconstructing the DI-GM by excluding cranberries and chickpeas, because the UK Biobank not recording the specific type of dried fruit and pulses consumption [25]; (2) excluding participants diagnosed with breast cancer within the first two years of follow-up to minimize reverse causality; (3) excluding individuals who completed the 24-hour online dietary recall questionnaire only once to ensure that the average intake of all dietary components accurately reflected habitual intake; and (4) excluding individuals with unknown or missing covariates.
All statistical analyses were performed using R software version 4.3.1. A two-tailed P < 0.05 was considered statistically significant.