
EAPC for cancer burden
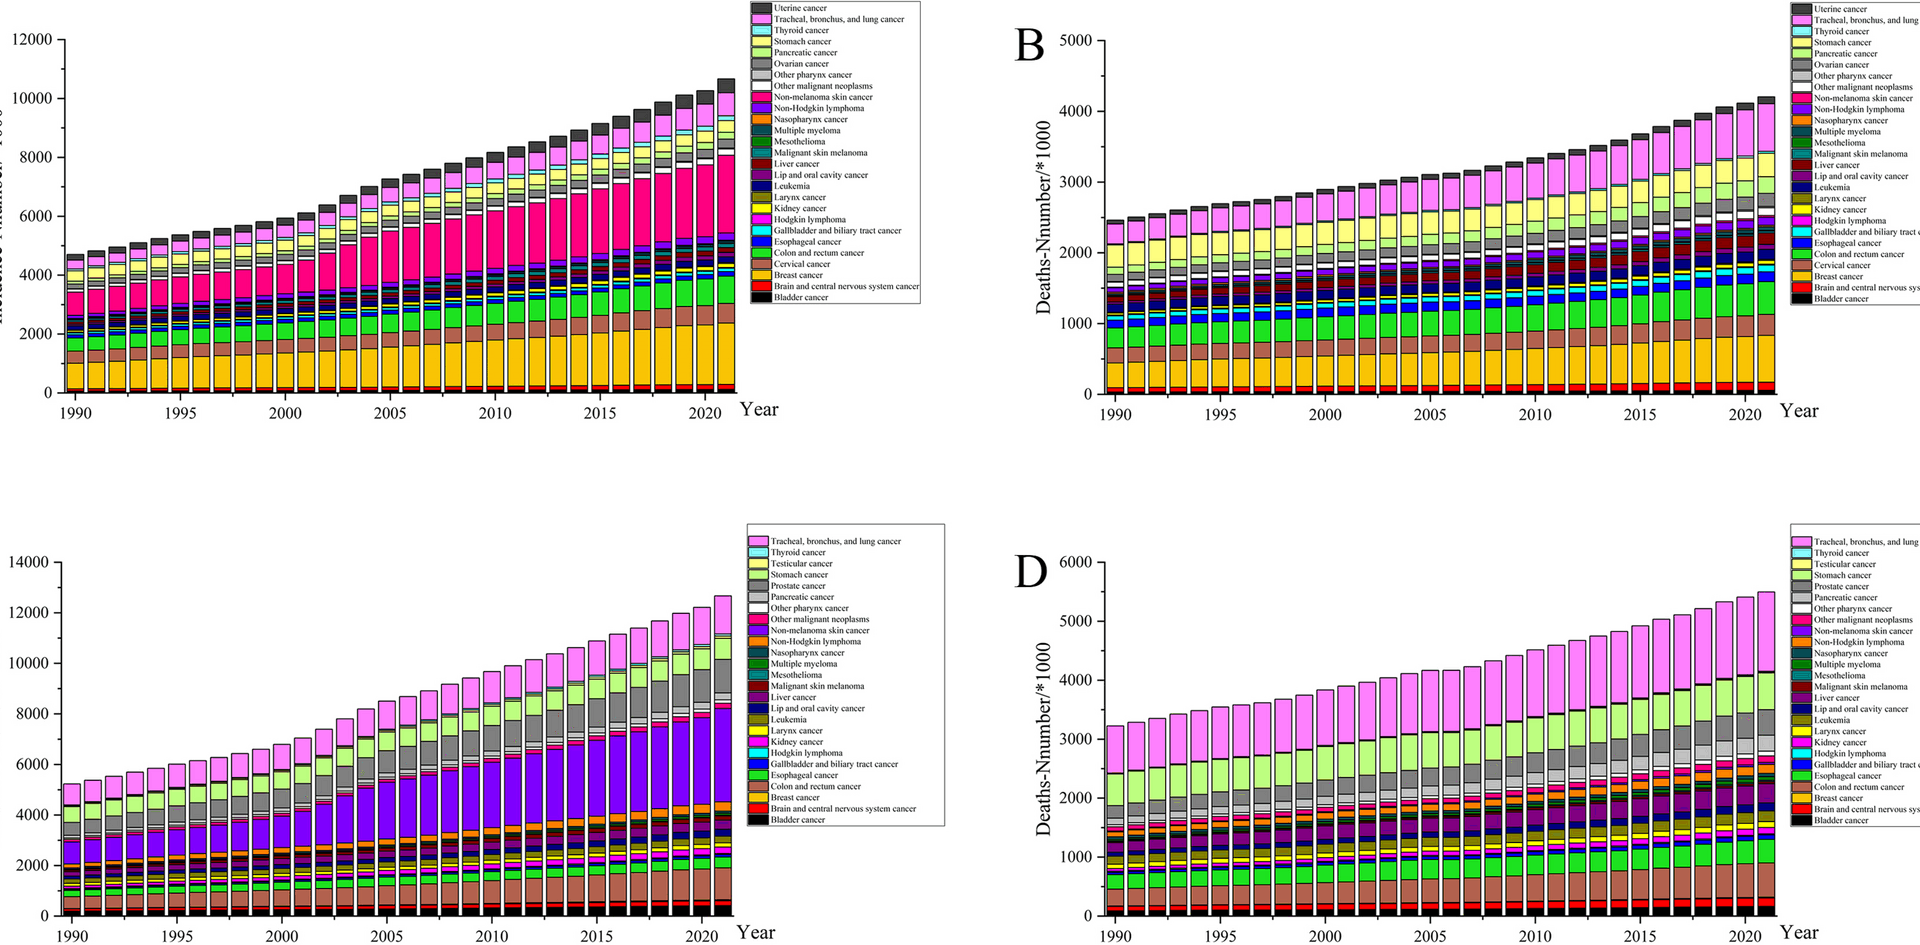
Globally, in 2021, the number of new cancer cases reached 23.56 million (more than twice as high as in 1990), and 9.83 million deaths were observed. The rise in incidence was largely attributable to non-melanoma skin cancer, which was 3.81 times more prevalent in 2021 than in 1990. Tracheal, bronchus, and lung cancers of the respiratory system were the main drivers of high cancer deaths and accounted for 20.51% of all deaths in 2021 and a substantial (86.79%) increase in the number of deaths in 2021 compared with 1990. Figure 1 shows the number of cancer incidence and mortality by sex. Breast cancer had the highest incidence among women and was the leading cause of mortality in this group. In the male population, the risk of death from gastrointestinal cancers such as stomach, colon, and rectum cancers was high and deserves considerable attention.
Fig. 1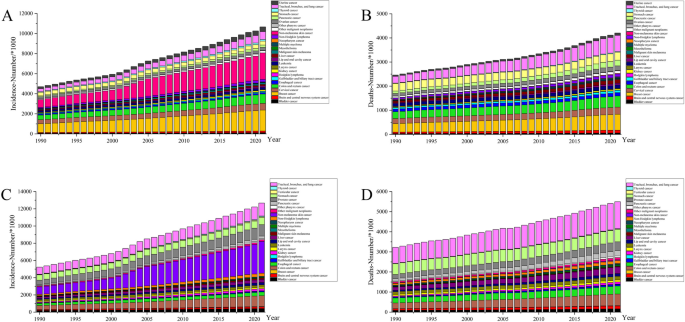
Histogram of global incidence and deaths of different types of cancer by sex, 1990–2021
At the global level, the 2021 age-standardized incidence rate (ASIR) was 275.16 (UI: 259.01 to 290), representing a modest increase from 252.85 (UI: 263.08 to 241.08) in 1990 and an EAPC of 0.32 (CI: 0.21 to 0.42; Table 1). With EAPCs exceeding 1, thyroid, testicular, and non-melanoma skin cancers showed high increases in ASIR. Among the 21 regions (see Supplementary Table 2), the increase in ASIR for total cancers was mainly driven by the high-income North American region, which had an EAPC (1.63, CI: 1.3 to 1.97) that was five times higher than the world average, whereas Central Asia experienced the largest decrease (− 0.67, CI: −0.77 to − 0.57). At the country level (Supplementary Table 2), the largest increases and decreases in the ASIR were in Lesotho (2.39, CI: 2.02 to 2.77) and Rwanda (− 1.55, CI: −1.84 to − 1.25), respectively; both sub-Saharan African countries are along the Belt and Road route.
Table 1 The global results of the ASR in 2021 and EAPC for various cancer types
In contrast to the increasing trend in ASIR, the age-standardized death rate (EAPC: −0.86, CI: −0.89 to − 0.82) and age-standardized DALYs rate (EAPC: −1.04, CI: −1.08 to − 1.01) of total cancers showed a decreasing global trend (Table 1), and the changes in DALYs were mainly in the YLLs dimension (EAPC: −1.08, CI: −1.11 to − 1.04). The results in Fig. 2 (B and C) show that countries with increasing trends in the burden of deaths and DALYs for total cancers were mainly concentrated in Africa (especially the Southern region) and Southeast Asia. Between 1990 and 2021, the ASIR of the age-standardized death rate, and the age-standardized DALYs rate were on a declining trend in only 39 countries (of a total of 204) mainly in Central Asia, Western Europe, and Eastern sub-Saharan Africa (Fig. 2, Supplementary Table 2). At the global level, stomach cancer showed the most pronounced downward trend in disease burden in all of the cancer groups. The EAPC results for each cancer type across countries are detailed in Supplementary Table 2.
Fig. 2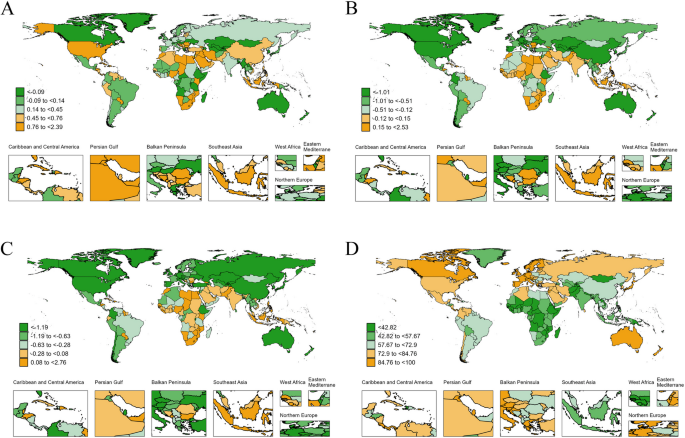
Global map of EAPC and QCI for total cancers. A Incidence B Deaths C DALYs D QCI in 2021
Health inequity analysis
We discovered significant absolute and relative inequities in SDI-related cancer burden as measured by age-standardized incidence, deaths, and DALYs rate (Figs. 3 and 4). As shown in Table 2, the global burden of disease for total cancers was more severe in higher-SDI regions where the SII of incidence showed an upward trend over time (Worsening inequality among higher SDI countries), signifying that the age-standardized incidence rate gap between the highest SDI and lowest SDI countries increased from 184.72 in 1990 to 194.66 in 2021. The SII for the remaining two burdens of disease dimensions showed substantial declines (deaths: from 69.33 to 25.46, DALYs: from 1489.87 to 302.90). The absolute inequitable change in the burden of cancer disease in the Caribbean, Central Latin American, Central sub-Saharan African, North African, and Middle Eastern regions was in Line with the global trend. Notably, within the high-income North American and Andean Latin American regions, the SII results demonstrated that lower-SDI areas bore a heavier cancer burden, and these gaps appeared to narrow further in 2021. Of the 19 regions examined in the study (Table 2), health disparities across all three dimensions show “Worsening inequality among higher SDI countries” in Eastern Europe, Oceania and Southeast Asia. East Asia, Eastern Sub-Saharan Africa and South Asia fall into the “Shift to higher burden among higher SDI countries” of health inequality in all three dimensions. In terms of changes in mortality inequality, Central Latin America, Andean Latin America, High-income North America, Central Europe and High-income Asia Pacific have all experienced shifts in areas of concentration of the burden, and the pattern types can be summarized as follows: Shift to higher burden among lower SDI countries.
Fig. 3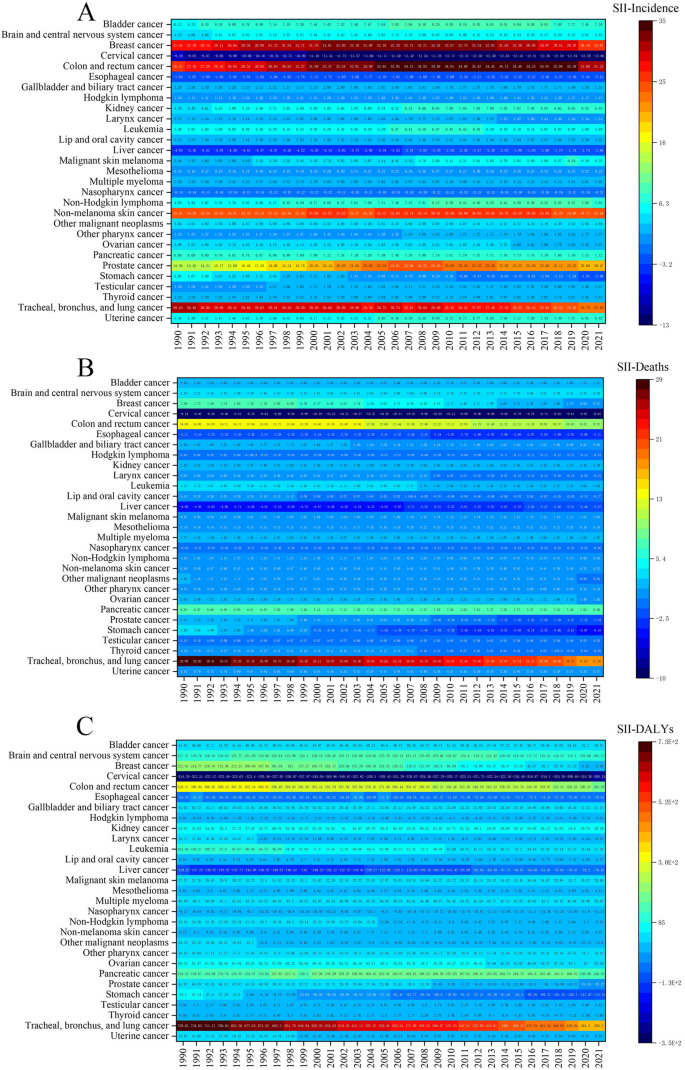
Slope Index of Inequality for 29 cancer groups from 1990 to 2021. A Incidence B Deaths C DALYs
Fig. 4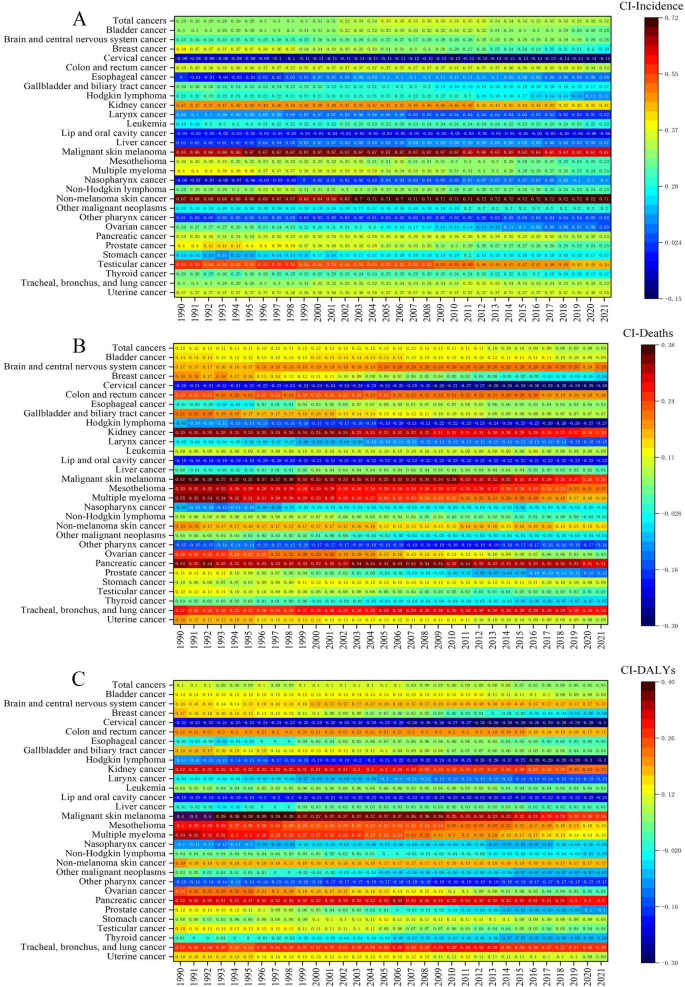
Concentration index for total cancers and 29 cancer groups from 1990 to 2021. A Incidence B Deaths C DALYs
Table 2 Slope index of inequality for global and regional total cancers in 1990 and 2021 for age-standardized incidence, deaths, and dalys
Similarly, the CI results indicated that the burden of disease for total cancers was more concentrated in high-SDI countries, with inequities in the incidence dimension far exceeding those for deaths and DALYs; the CI for total cancers in 2021 was as high as 0.32 (Fig. 4). The inequities in ASIR for cancer were mainly reflected in non-melanoma skin cancer and malignant skin melanoma, both of which had a CI of more than 0.6. Inequities associated with SDI varied dramatically across cancer types, with liver cancer and esophageal cancer having the lowest levels of inequity by degree of health inequity. In terms of the direction of concentration, the burden of disease for cancers such as lip and oral cavity cancers and cervical cancer was concentrated in low-SDI areas, whereas malignant skin melanoma, mesothelioma, pancreatic cancer, and tracheal, bronchus, and lung cancers were concentrated in high-SDI areas and ranked high in inequity. Intriguingly, the CI for breast cancer decreased from 1990 to 2021 for incidence, deaths, and DALYs, and the direction of concentration of the burden of deaths and DALYs shifted from high-SDI to low-SDI areas.
Quality of care index
Globally, the QCI for total cancers steadily increased over time from 59.22 in 1990 to 73.21 in 2021. In 2021, Australasia (96.66) and Western Europe (93.60) had the highest level of care for total cancers. Eastern sub-Saharan Africa (41.47) and Central sub-Saharan Africa (38.31) were lagging. The top three QCI-ranked countries were Kuwait, Bermuda, and Finland, and the lowest-ranked country was Mongolia (Supplementary Table 3). As shown in Fig. 5, the QCI trend for most of the 29 cancer types was consistent with that of total cancers. The cancers with a QCI increase of more than 70% were nasopharynx (88.44%) and esophageal (72.35%) cancers and a total of five cancers experienced a QCI increase of more than 50%. Only non-melanoma skin cancer and mesothelioma showed a fluctuating downward trend in the QCI, with overall decreases of 0.16% and 1.56%, respectively. The QCI for breast cancer showed a downward trend from 1990 to 1994; however, since the turning point in 1994, the index slowly rose and ultimately increased by 5.79%.
Fig. 5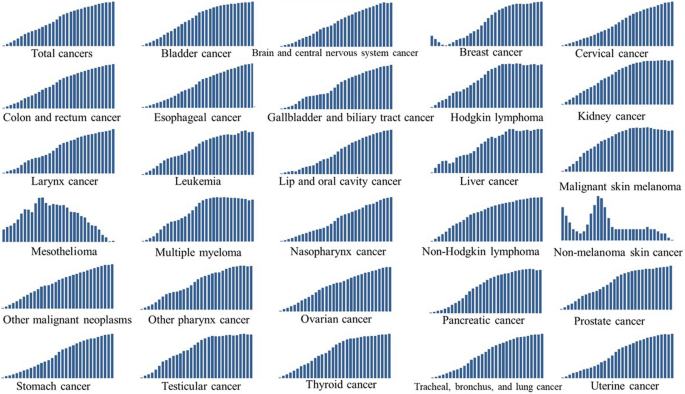
Trends in Quality of Care Index (QCI) for total cancers and 29 cancer groups from 1990–2021
The results in Fig. 6 support a highly positive correlation between QCI and SDI for total cancers; the correlation remained essentially unchanged over the 1990–2021 period. In 2021, the statistics showed a strong correlation (i.e., PCC > 0.8) between QCI and SDI for 16 of the 29 evaluated cancer groups. With a correlation coefficient of more than 0.9, Hodgkin lymphoma ranked first among the 29 cancer groups. Although non-melanoma skin cancer treatment showed the weakest correlation with SDI among all cancers (PCC = 0.06 in 2021), this malignancy demonstrated the greatest increase since 1990, with the coefficient increasing fivefold (from 0.01 in 1990). Moreover, the PCC between the QCI for liver cancer and the SDI showed a considerable increase, rising from 0.53 in 1990 to 0.63 in 2021, an 18.87% increase. In contrast, the PCC for ovarian cancer had experienced the largest decline, decreasing from 0.58 in 1990 to 0.51 in 2021, a 12.07% reduction.
Fig. 6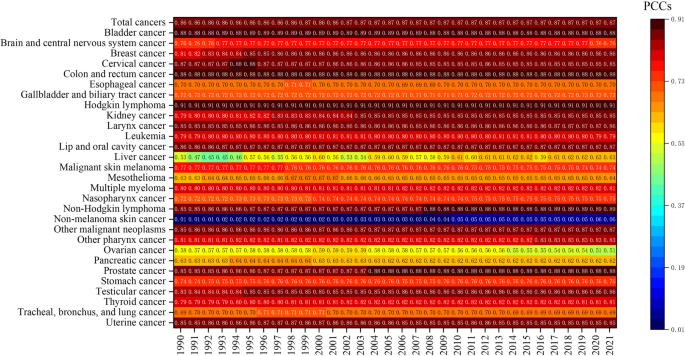
Heatmap of correlation between Quality of Care Index (QCI) and SDI for total cancers and 29 cancer groups from 1990–2021