

Study design
This study was conducted in three Ethiopian urban centers: Semera, Logiya and Jigjiga (Fig. 1). All three of these towns are experiencing rapid growth due to political stability and economic opportunities. Semera (11°7′94″N, 41°0′08″E; elevation 433 m a.s.l.; 2023 population 6784) is the capital of the Afar region, and is located 585 km northeast of Addis Ababa along the Addis Ababa-Djibouti highway, an important trade corridor. Logiya (11°43′19″N, 40°58′28″E, elevation 393 m a.s.l.; 2023 population 36,313) is located 7 km north of Semera. Both towns have unimodal and erratic rainfall patterns and receive an annual average rainfall of 358 mmm concentrated between June and September. At an average annual temperature of 32.3 °C, both towns experience extreme heat, with June being the hottest month (average maximum temperatures reaching 44 °C); January is the coldest month (24.2 °C). Jigjiga (9°36′N, 42°48′E; elevation 1634 m a.s.l.; 2023 population 800,000) is the capital city of the regional Somali state, eastern Ethiopia (Fig. 1). Jigjiga is located 615 km from Addis Ababa on the Addis Ababa-Port Berbera highway, the second largest trade route in Ethiopia. The average annual rainfall in Jigjiga is about 600 mm, characterized by bi-modal seasonality (main rainfall in July–September, followed by short rainfall April–June). Jigjiga experiences a mean annual temperature of 20 °C. Malaria does not occur locally in Jigjiga, but seasonal malaria transmission occurs in lowland rural areas located approximately 25 km from the city.
Fig. 1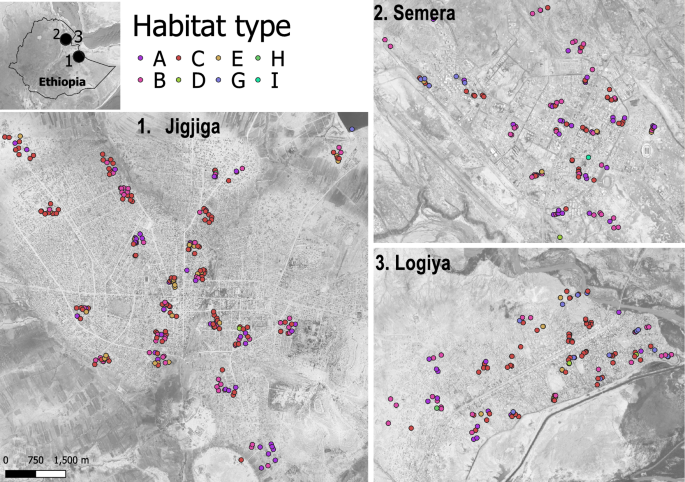
Map of the three study urban centers and distribution of habitat types. Location of all habitats sampled in the Jigjiga, Semera and Logiya towns located in eastern Ethiopia during the dry season of 2023, separated by mosquito habitat type, indicated by color coding. Code for habitat type: A Residential cistern, B construction pits, C ground-level tanks, D tires, E small plastic containers, F bottles, G puddles from rain or burst pipes, H car wash drainage, I surface water. See Additional file 2: Figure S2 for details of each habitat. All maps are shown on the same scale
Multiple factors were taken into consideration for the selection of the three urban centers. Jigjiga was selected due to its unique situation of being invaded by Anopheles stephensi but having a history of local malaria transmission. Given the lack of Anopheles gambiae sensu lato (An. gambiae s.l.) in or around the town, the selection of Jigjiga was based on the establishment of a long-term study focused on towns recently invaded by An. stephensi that may experience local malaria transmission as the vector establishes. Semera and Logiya were selected due to their closeness to Djibouti and a history of local malaria transmission in riverine communities by Anopheles arabiensis as well as the recent increase in malaria cases potentially attributed to An. stephensi [12].
The study design was centered on the urban–rural gradient study design commonly used in urban ecology studies [9, 20]. Briefly, centering in the historical ‘downtown’ of a town (identified using satellite imagery), four sectors according to the cardinal points (i.e. NW, NE, SW and SE) were drawn on a map using natural divisions such as main roads or rivers whenever possible (Additional file 1: Figure S1). Within each sector, five sampling clusters (i.e. conglomerates of 4 × 4 or 5 × 5 city blocks; Additional file 1: Figure S1) selected across the urban–rural footprint of each cardinal point were identified. This design was suitable to characterize An. stephensi distribution and ecology because it allowed larval habitat productivity to be characterized throughout habitats that spanned the entire urban footprint, rather across randomly selected houses. In addition, by sampling across the urban footprint of each town, we ensured findings are representative of different socio-economic, ecological and housing conditions (from dispersed semi-rural traditional houses to highly urbanized housing units).
Sampling clusters consisted of two to four city blocks. For each cluster in Semera and Logiya, two construction sites and five residential premises—for a total of 140 premises per town—were surveyed; in Jigjiga 10 premises in each sampling cluster (including 2 construction sites) were selected—for a total of 220 premises (Fig. 1). In cases where construction sites were absent, two additional residential premises were included in the sampling cluster. The study was conducted from 7 March to 26 March 2024 in Semera and Logiya towns and from 8 March to 28 March in Jigjiga. These periods were the peak of the dry season in the three study sites (Additional file 1: Figure S1). Given most small habitats often infested by An. stephensi are expected to dry during this period [18], sampling during the dry season provided an opportunity to study key habitats for population persistence.
Mosquito larval and pupal sampling
Mosquito larvae and pupae were sampled from each water-holding container/habitat found within the premises of each house and its immediate perimeter using a standard mosquito dipper (350 ml) [9]. Number of dips was a function of container/habitat size: large containers (residential cisterns, construction pits) were dipped 20 times, medium-sized containers (200-l drums) were dipped 10 times and smaller containers (tires, buckets) were exhaustively examined and all larvae and pupae collected. The distribution of dips per habitat aimed at covering the entire surface, aiming at corners as well as floating vegetation/debris where immature mosquitoes may be hiding. The coordinates of each water holding container/ habitat was recorded using a hand-held global positioning system (GPS) (Garmin GPS 60; Garmin International, Olathe, KS, USA). The sampled larvae and pupae from each habitat were placed in an 18-oz. sterile plastic bag (Whirl–Pak; Filtration Group, Austin, TX, USA) containing water from the same habitat (to minimize stress and mortality) and transported to the laboratory where the numbers of first and second instar larvae, third and fourth instar larvae and pupae were recorded, differentiated by species. All larvae were allowed to pupate by feeding yeast powder. The pupae were transferred from the enamel trays to small beakers containing a small amount of water and put inside a bugdorm (30 × 30 × 30 cm) for emergence. Adult Anopheles mosquitoes that emerged from collected larvae and pupae were identified using a morphological identification key. Molecular confirmation of An. stephensi was conducted on a subset of 200 larvae chosen at random and kept in DNA Shield stabilization solution (Zymo Research, Irvine, CA, USA) using standard primers and protocols [3].
Characterization of larval habitats
The habitat characteristics of any water-holding habitat that tested either positive or negative for mosquito larvae or pupae encountered during sampling were measured. The physical characteristics of breeding habitats were documented, including habitat type, material (plastic, cement, metal), location, dimensions, water source (tap, rain, river) and environmental factors (e.g. shade, cover, algae presence). Given the high variability of habitat types, a number of broad categories were identified and used to group observations. Habitat type was thus defined by the following classes (Additional file 2: Figure S2): A = residential cistern, B = construction pits, C = ground level tanks, D = tires, E = small plastic containers, F = bottles, G = puddles from rain or burst pipes, H = car wash drainage and I = surface water. A residential cistern was generally built of concrete, measured approximately 3 × 3 m in surface area and had variable depth (from a few centimeters to meters). The main feature of this type of habitat was that water was used for human consumption. Construction pits could be made of either plastic sheets buried in the ground and elevated by dirt edge or a wood and metal frame, or made of cement (e.g. residential cisterns). The main feature was that their purpose and water were for supporting construction activities (either water for mortar cement, brick manufacturing or other activities not related to residential water consumption). Ground-level tanks were typically made of plastic, and less commonly of metal, and were of various sizes and capacities. The water stored in these tanks was primarily used for human or animal consumption. Tires were either individual or grouped in piles and had different sizes, with car and truck tires being the most common. The category of small plastic containers included buckets, plastic jars and small containers that were primarily rain filled. Bottles were primarily rain filled and varied in volume from 350 ml to 2 l. In Semera-Logiya, we found puddles in the street that were persistent in the dry season; these were generated by constant flow of water from burst pipes. Given this unique nature and source of water, we included these puddles as a category independent from surface water, which alludes to natural water habitats (river, pond, rain-filled reservoirs). Water drainage occurred on properties/areas where motorcycles, cars and trucks were washed, with water often accumulating to form puddles (Additional file 2: Figure S2).
The amount of shade at each habitat was quantified as a binary variable, and visually assessed by the field team. Shade was present when there was clear evidence that the habitat was not fully exposed to the sun, with shade outdoors provided, for example, by trees or roofs. Any indoor container was considered to be shaded. Habitat cover was visually assessed based on the amount of physical cover each habitat had. The variable was based on percentiles (0 = no cover, up to 25%, 50%, 75% cover and fully covered). Algae presence was specifically assessed and quantified as the presence of filamentous algal aggregates, as preliminary work by our team identified filamentous algal aggregates as microenvironments where often An. stephensi larvae are found. These algal aggregates were also described by color (green or other color [e.g. red/orange or gray]). Water chemistry parameters (pH, temperature, salinity, total dissolved solids [TDS], conductivity) were recorded using a digital meter (model WQ120; Triplett Test Equipment, Manchester, NH, USA). Habitat dimensions and water depth were measured with a tape. All data collected in the field were electronically entered into tablet-based formats in KoboToolbox (https://www.kobotoolbox.org).
Statistical analyses
We focused on two measures to characterize the larval ecology of An. stephensi. Habitat positivity was quantified as the proportion of habitats with An. stephensi present, divided by all habitats with water that were surveyed. Habitat productivity was characterized by the count of all An. stephensi found within each habitat. For productivity, we further divided the counts to characterize the stage structure of An. stephensi by habitat by aggregating immature stages in young (I-II instar), old (III-IV instar) and pupae. All measures of habitat positivity were statistically analyzed using binomial generalized linear mixed models (GLMM) using sampling cluster ID as the random intercept. The justification of using a GLMM emerged from the fact that the data was hierarchical in nature (random houses were sampled from multiple clusters, which were located in different sectors of each town). To account for potential differences from being in different areas of each town, we included a random effect for the ID of each cluster, as explained in the following text.
Residential cisterns (a very common and widely used habitat in Ethiopia) were used as a baseline for statistical comparisons. For productivity, negative binomial GLMMs were implemented, similarly using sampling cluster ID as the random intercept. Models for positivity and productivity had the following structure (with data format shown in parenthesis):
$$\left[An. stephensi\right] \sim {Cover}_{(0-100\%)}+{Algae}_{(\text{0,1})}+{Habitat}_{(A vs C-H)}+{Turbidity}_{(turbid, medium, clean)}+{City}_{(Semera, Logia,Jigjiga)}+{Water quality}_{(PCA1)}+\left(1 \right|Cluster ID)$$
All analyses were run in R 4.3.1, using package lme4 [21]. Prior to running the GLMMs, we checked all the variables for correlation using correlation matrices. The finding of a strong correlation between salinity, conductivity and TDS but not of pH prompted the application of principal component analysis (PCA) to generate a “water quality index” that encapsulated all. The first component (PC1) was then used in all models as a measure of water quality.
We characterized mosquito population structure by counting the number of young larvae (I–II instar), old larvae (III–IV instar) and pupae per habitat. Instead of using standardized measure (number per dip), we used the total catch as a measure of the absolute contribution of each habitat. This number was used to characterize habitat types in their level of completeness of population structure (e.g. the finding of a complete stage structure is indicative of multiple oviposition events leading to overlapping generations). To better exemplify the potential contribution to the adult population by habitat type, we used the empirical stage distribution for each habitat and town as initial conditions to multiply the Lefkovitch transition matrix [22] shown below:
$$L=\left(\begin{array}{cccc}0& 0& 0& 0\\ s1& 0& 0& 0\\ 0& s2& 0& 0\\ 0& 0& s3& 0\end{array}\right)$$
, with parameters representing the survival probability of young instars into old instars (s1), of old instars into pupae (s2) and adult emergence rate (s3). The matrix excludes values on the first row, given we were not interested in modeling recruitment into each habitat. We considered differential survival by instar, with s1 = 0.50, s2 = 0.75, s3 = 0.85. Such values were based on expert opinion, as life table estimates of An. stephensi in Africa are lacking. The value of s1, s2 and s3 was kept the same for each habitat type and city. These parameters were chosen to characterize a possible transition, and further research should focus on proper estimates for better model parameterization.