Released: 2025-09-16
Consumer Price Index
August 2025
1.9% 
(12-month change)
Food purchased from stores
August 2025
3.5% 
(12-month change)
Shelter
August 2025
2.6% 
(12-month change)
Transportation
August 2025
-0.5% 
(12-month change)
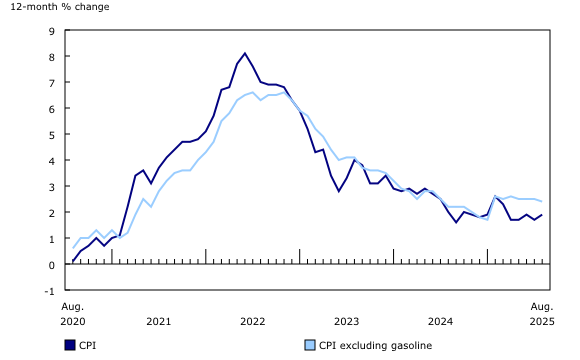
The Consumer Price Index (CPI) rose 1.9% on a year-over-year basis in August, up from a 1.7% increase in July.
Gasoline prices fell to a lesser extent year over year in August (-12.7%) than in July (-16.1%), leading to faster growth in headline inflation. Excluding gasoline, the CPI rose 2.4% in August, after increasing 2.5% in each of the previous three months.
Moderating the acceleration in the all-items CPI were lower prices for travel tours and fresh fruit compared with July.
The CPI decreased 0.1% month over month in August. On a seasonally adjusted monthly basis, the CPI was up 0.2%.
Chart 1

The 12-month change in the Consumer Price Index (CPI) and CPI excluding gasoline
Chart 2

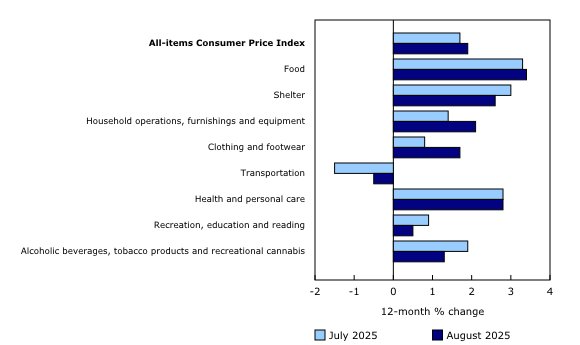
Four major components contribute to accelerating all-items Consumer Price Index in August
Prices at the pump contribute the most to the acceleration in the all-items Consumer Price Index
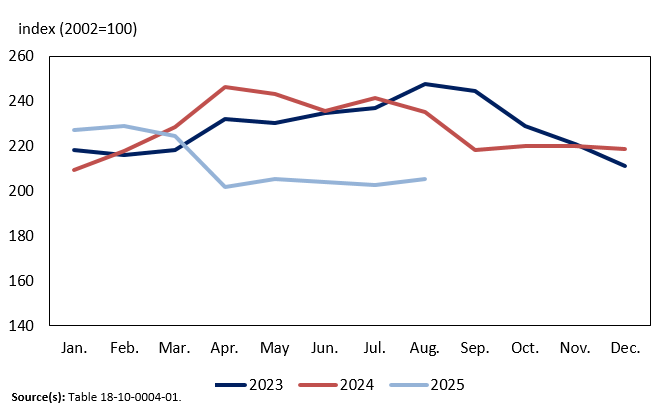
On a yearly basis, prices for gasoline fell 12.7% in August, compared with a 16.1% decline in July. The smaller year-over-year decrease was partially a result of a base-year effect. In August 2024, prices declined 2.6% month over month, as concerns about slower economic growth began to emerge. In August 2025, prices rose 1.4% on a monthly basis due in part to higher refining margins, offsetting lower crude oil costs.
Infographic 1

Gasoline prices remain relatively stable since the removal of the consumer carbon levy in April
Prices for cellular services fall at a slower pace
Prices for cellular services fell to a lesser extent year over year in August (-1.2%) compared with July (-6.6%). On a monthly basis, prices were up 1.5% in August as multiple providers increased prices with fewer back-to-school sales available for cellular phone plans.
Partially offsetting the price increase were lower prices month over month for multipurpose digital devices (-1.5%), which includes smartphones and tablets.
Prices for meat grow at a faster pace, while prices for fresh fruit fall
In August, prices for meat rose 7.2% year over year, following a 4.7% increase in July. Higher prices for fresh or frozen beef (+12.7%) and processed meat (+5.3%) put upward pressure on the index in August. Growth in prices for ground beef and multiple processed meat categories contributed the most to the upward movement.
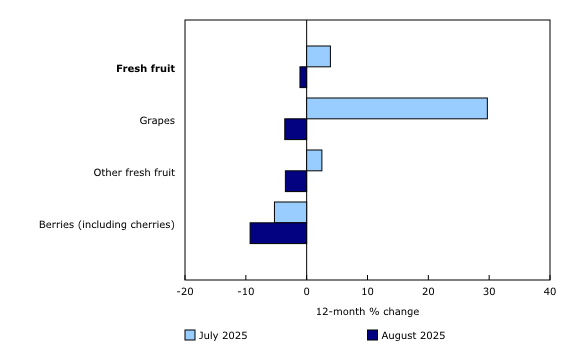
Year over year, prices for fresh fruit fell 1.1% in August, after increasing 3.9% in July. Price declines for grapes, other fresh fruit, and berries (including cherries) contributed the most to the yearly price decrease for fresh fruit in August.
Chart 3

Prices for fresh fruit decline on a yearly basis in August
Prices for fresh fruit and vegetables are prone to seasonal volatility due to several factors, including, among others, country of origin and weather in growing regions.
Prices for clothing increase at a faster pace due to a base-year effect
In August, prices for clothing and footwear rose 1.7% year over year compared with a 0.8% increase in July. The increase in August was mainly the result of a base-year effect as prices declined by 0.6% in August 2024.
On a monthly basis, prices for clothing and footwear rose 0.3% in August.
Travel tours push down the cost of travel services
Year over year, prices for travel services decreased 3.8% in August after falling 1.2% in July.
Prices for travel tours declined 9.3% annually in August following a 1.7% decrease in July. Contributing to lower prices in August was lower demand for destinations in the United States.
Moderating the downward pressure were higher prices for traveller accommodation. Nationally, prices rose 2.9% in August, following a 2.7% decline in July. Prices for hotels increased the most in Nova Scotia (+16.1%) and Newfoundland and Labrador (+30.9%) in August, as more tourists visited both provinces. Newfoundland and Labrador hosted the Canada Summer Games in August.
Prices for air transportation fell in August (-7.6%), although to a lesser extent than in July (-10.6%).
Focus on Canada and the United States
Tariffs affect many facets of the economy, including inflation. The imposition of tariffs by the United States and countermeasure tariffs by the Canadian government can result in varying effects on final consumer prices. Read more about the potential impacts of US tariffs on the Bank of Canada’s website.
No special adjustments to the Consumer Price Index will be required for tariffs, as their effect is embedded in the final prices collected.
Statistics Canada will continue to monitor developments on tariffs and the impact on consumer price inflation.
For more data and insights on areas touched by the socio-economic relationship between Canada and the United States, see the Focus on Canada and the United States webpage.
Explore the Consumer Price Index tools
Check out the Personal Inflation Calculator. This interactive calculator allows you to enter dollar amounts in the common expense categories to produce a personalized inflation rate, which you can compare with the official measure of inflation for the average Canadian household—the Consumer Price Index (CPI).
Browse the Consumer Price Index Data Visualization Tool to access current (Latest Snapshot of the CPI) and historical (Price trends: 1914 to today) CPI data in a customizable visual format.
Regional highlights
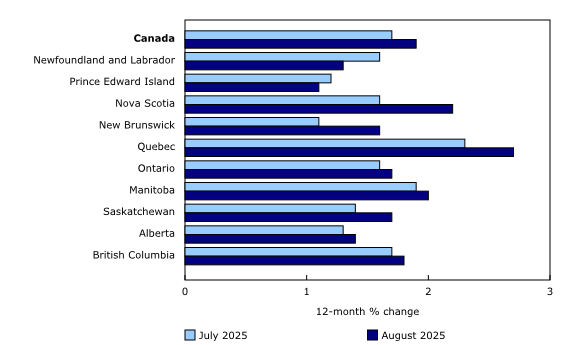
On a yearly basis, prices rose at a faster pace in eight provinces in August compared with July.
In Nova Scotia, in addition to gasoline, higher prices for rent (+6.9%) contributed to the year-over-year acceleration in August.
Chart 4

The Consumer Price Index rises at a faster pace in eight provinces in August
Did you know we have a mobile app?
Download our mobile app and get timely access to data at your fingertips! The StatsCAN app is available for free on the App Store and on Google Play.
Note to readers
Visit the Consumer Price Index portal to find all Consumer Price Index (CPI) data, publications, interactive tools and announcements highlighting new products and upcoming changes to the CPI in one convenient location.
Real-time data tables
Real-time data table 18-10-0259-01 will be updated on September 29. For more information, consult the document, “Real-time data tables.”
Next release
The Consumer Price Index for September will be released on October 21.
Products
The “Consumer Price Index Data Visualization Tool” is available on the Statistics Canada website.
More information on the concepts and use of the Consumer Price Index (CPI) is available in The Canadian Consumer Price Index Reference Paper (Catalogue number62-553-X).
For information on the history of the CPI in Canada, consult the publication Exploring the first century of Canada’s Consumer Price Index (Catalogue number62-604-X).
Two videos, “An Overview of Canada’s Consumer Price Index (CPI)” and “The Consumer Price Index (CPI) and Your Experience of Price Change,” are available on Statistics Canada’s YouTube channel.
The podcast ”Eh Sayers Episode 18 – Why Food Inflation Is Such A Hard Nut To Crack” is also available.
Find out answers to the most common questions posed about the CPI in the context of the COVID-19 pandemic and beyond.
Contact information
For more information, or to enquire about the concepts, methods or data quality of this release, contact us (toll-free 1-800-263-1136; 514-283-8300; infostats@statcan.gc.ca) or Media Relations (statcan.mediahotline-ligneinfomedias.statcan@statcan.gc.ca).

