

Just before midnight local time on 29 July 2025, an earthquake struck off the coast of Russia’s Kamchatka Peninsula. Its magnitude, measured at 8.8, placed it among the strongest globally in over a decade. But strength was only part of the story.
Tsunamis that follow such events are closely tracked. Ocean-wide alerts were issued. Waves moved outward, slow but forceful, across deep water. And yet, far above, a satellite not built for disaster response was about to provide a different kind of insight.
High above Earth’s surface, the Surface Water and Ocean Topography (SWOT) satellite passed over the Pacific at the exact moment the tsunami was in transit. SWOT, a joint mission from NASA and the French space agency CNES, was launched to map water dynamics across oceans, lakes and rivers. It had not previously observed an event of this magnitude.
What it recorded surprised researchers. The pattern of waves captured from orbit did not match the assumptions that underpin current tsunami forecasting models. The data hinted at a fundamental gap in how these waves are understood—and how they may behave before reaching shore.
Satellite Captures First Wide-Area Tsunami Wavefield
SWOT’s pass over the open ocean, roughly 70 minutes after the quake, recorded a 120-kilometre-wide swath of sea surface height. The measurement, processed using advanced filtering and neural network techniques, showed a complex and braided wave structure, not the single coherent wavefront predicted by long-standing models.
Most tsunami models assume that large, basin-wide waves are non-dispersive, meaning their energy travels together in a uniform shape. The SWOT image contradicted this, showing wave energy that scattered, refracted, and trailed far behind the primary front.
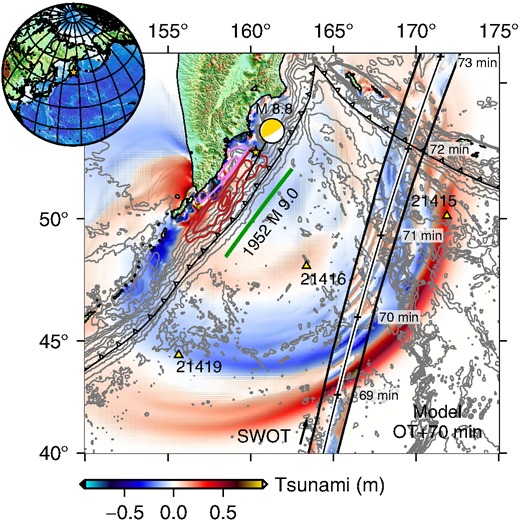 Propagation of the 2025 tsunami across the Pacific Basin with arrival times (in minutes) at DART buoys and the SWOT satellite’s overpass path. Credit: The Seismic Record
Angel Ruiz-Angulo, a researcher at the University of Iceland and lead author of the study, explained: “Before, with DARTs we could only see the tsunami at specific points in the vastness of the ocean. Now, with SWOT, we can capture a swath up to about 120 kilometres wide, with unprecedented high-resolution data of the sea surface.”
These findings, detailed in a peer-reviewed study in The Seismic Record, were compared against data from three NOAA DART buoys. The Deep-ocean Assessment and Reporting of Tsunamis network monitors pressure changes at the seafloor to detect tsunami waves and is a critical component of the global tsunami warning system.
Only after modifying their models to include dispersive wave dynamics—which allow energy to travel at different speeds—did researchers find a close match between simulation and observation. Without this adjustment, the models could not replicate the multiple secondary waves captured by SWOT.
Seafloor Deformation Models Revised
To identify what caused the tsunami’s unexpected structure, the research team reconstructed the source of the wave by analysing both buoy and satellite data. They applied a Gaussian lump inversion, a modelling technique that estimates how the seafloor moved based solely on the tsunami’s shape.
The analysis showed a rupture that extended approximately 400 kilometres, with a peak uplift of about four metres. This significantly expanded the rupture length compared to the original USGS finite-fault model, which estimated about 300 kilometres.
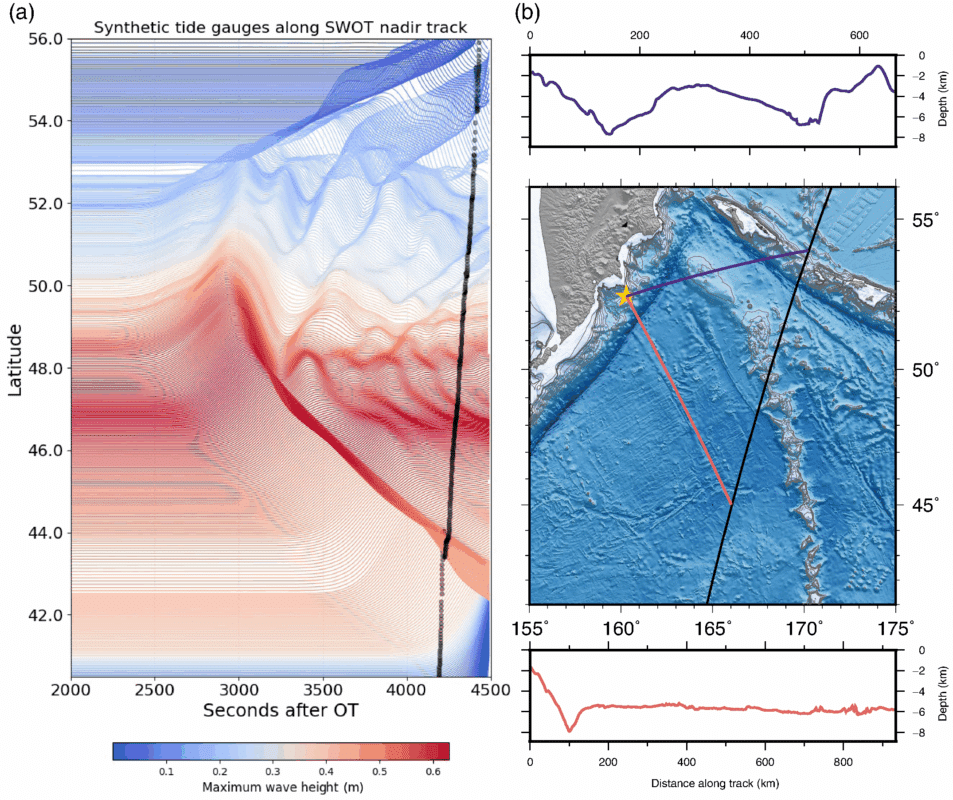 Synthetic tide gauge data simulated along the SWOT nadir track, showing the complexity and modulation of wave heights over time and space. Credit: The Seismic Record
Melgar and Ruiz-Angulo, along with colleagues from CNES and the University of Oregon, created a “blended” source model. It combined the new uplift estimates with the subsidence pattern from the USGS seismic-geodetic data, producing a version that better matched both SWOT’s image and the DART pressure readings.
Timing discrepancies at the buoys reinforced the need for this revision. One recorded wave arrival earlier than predicted, another later, discrepancies that standard models did not account for. Once updated, the new model brought these forecasts into closer alignment with the real data.
Echoes of a 1952 Rupture, but Not the Same Impact
The region of the 2025 earthquake overlaps with that of the 1952 magnitude 9.0 Kamchatka earthquake, which produced a devastating tsunami across the Pacific. Historical records from that event have shaped expectations about future risks along the Kuril–Kamchatka subduction zone.
However, the new findings suggest that the 2025 rupture occurred deeper within the Earth’s crust. It did not extend to the near-trench, shallow zones that typically produce more destructive tsunamis. The deeper slip, though still powerful, resulted in less nearshore amplification, consistent with a smaller overall impact on coastlines.
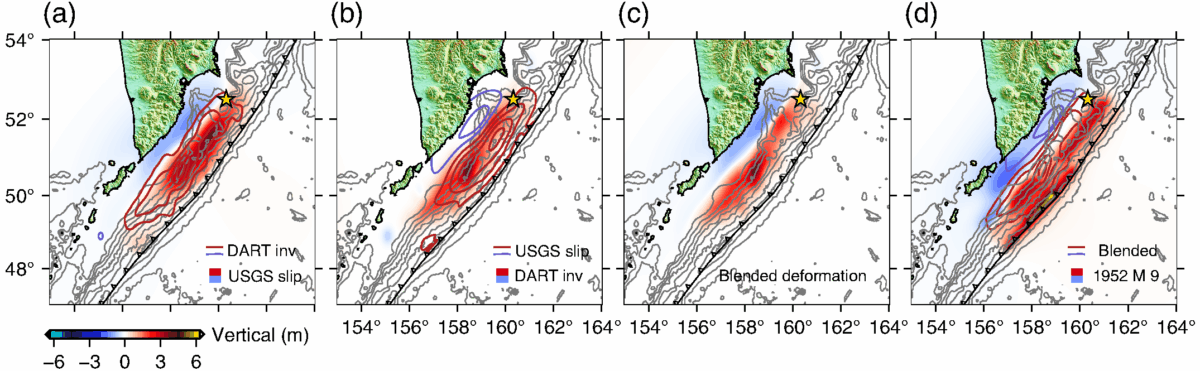 Comparison of vertical deformation and slip models derived from USGS, DART inversion, and blended datasets. The final blended model extends farther south than initial estimates. Credit: The Seismic Record
That distinction has important implications. The recurrence interval—just 73 years after the 1952 event—suggests the previous rupture did not fully release tectonic strain. Residual stress may have contributed to the 2025 event, even though the style of rupture and energy release differed.
The study’s authors observed that only 5 to 6 metres of slip could have reaccumulated since 1952, compared to the 9 to 15 metres inferred from the older quake. The conclusion is that partial rupture zones may persist across seismic cycles, potentially increasing unpredictability in hazard planning.