
Beneath Greenland’s vast ice sheets, an unexpected layer of sediment may be the driving force behind how quickly the island’s glaciers melt into the ocean.
This discovery is crucial to climatologists because it determines how fast sea levels could rise along coastlines around the world.
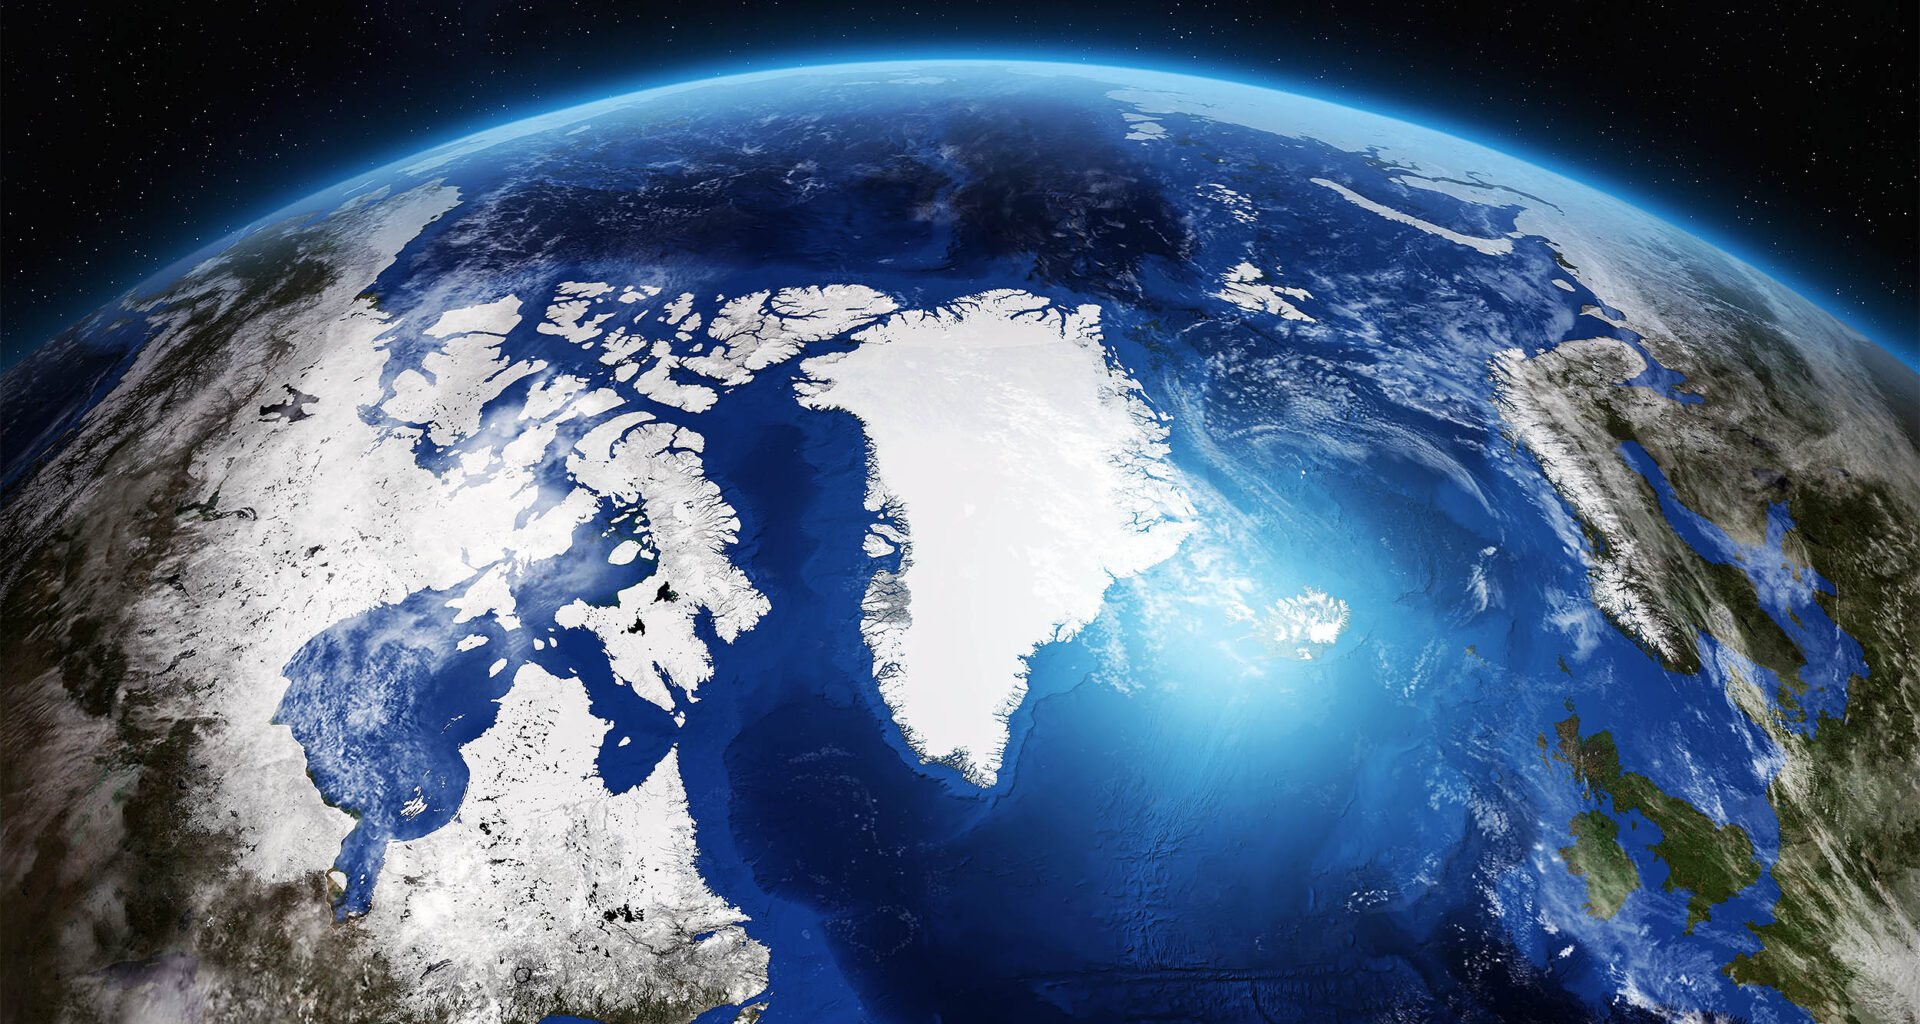
Greenland, glaciers, and sediments

New seismic evidence shows that sediments up to 650 feet thick lie beneath large parts of Greenland’s ice sheet, allowing glaciers to move much faster than if they rested on solid rock.
At University of California San Diego (UCSD), researchers led by Yan Yang combined recordings of earthquake signals from stations located on top of the ice to map ground below Greenland.
Their work focuses on how ice and rock interact beneath changing landscapes, with a special eye on what lies under ice sheets. Using publicly available data allowed the team to study the sediment bed without drilling through miles of ice.
Glacier speed depends on many factors, including air temperature and the friction of the glacial base rubbing against the sediment bed.
When basal sliding, motion driven by ice slipping over ground, increases, friction drops and more ice can reach the coast.
Hard bedrock resists that slip, while wet sediment deforms, which reduces resistance and lets the base move faster.
Because the sliding rate controls how quickly ice reaches the ocean, the bed material can change sea-level rise timelines.
Earthquake signals as bed probes
Seismic waves from big earthquakes arrive in Greenland after traveling through Earth, then pass through ice and into rock.
Sensitive seismometers, instruments that measure ground shaking, record tiny changes in timing that point to different materials below.
Researchers extract receiver functions, wave patterns that highlight layer boundaries, and compare them with predictions for ice sitting on hard rock.
If the observed timing lags behind the hard-rock case, a slower layer such as sediment is often the cause.
Sediment shows up everywhere
Records from 373 stations across Greenland revealed delays that match a soft layer at the ice-bed contact.
In the paper, the measured delays fit a low-velocity layer, where waves travel more slowly, at the base that matches soft sediments.
Some of that soft ground sits under thick interior ice far from the coast, while other areas still rest on harder rock.
That patchwork matters because fast-flowing outlets can be fed from inland zones that look stable on the surface.
Heat, water, and weakness
Not all of Greenland’s base is at the same temperature, and that difference shapes where sediments stay weak.
A modeled basal thermal state, whether the bed is frozen or thawed, lined up with where thicker sediments appeared.
Thawed zones tended to hold thicker, softer material, yet pockets of sediment also turned up where models predict frozen conditions.
Those mismatches set limits on any one map of the bed, since local heat and geology can vary sharply.
When meltwater hits bottom
Summer surface melt does not always stay on top, and some of it can reach the ice-sheet base.
Water can drop through moulins, vertical shafts that route meltwater downward, raising pressure at the bed and cutting friction.
Higher water pressure lowers effective pressure, the squeezing force between ice and ground, so soft sediment can deform more easily.
“Our results suggest that thick, weak sediments could make parts of Greenland more responsive to future warming,” said Yang.
Forecasts depend on bed type
Ice-sheet models often assume simple beds, yet sediment patches can change speed-ups that raise sea-level estimates.
One large estimate puts Greenland’s 1992-2018 sea-level contribution overall at about 0.43 inches.
A global assessment highlights that ice-sheet processes remain a major source of sea-level uncertainty.
“The safety of coastal communities depends on accurate forecasts, and knowing whether the bed is hard rock or soft sediment is essential for improving future sea-level change predictions,” said Yang.
Gaps in the station grid
Sediment thickness varied over short distances, suggesting that some fast changes happen between stations rather than across whole regions.
A denser field of instruments would sharpen local detail, because each seismometer gives a one-spot view of the bed.
Because most data come from permanent monitoring and temporary deployments, teams at UC San Diego can add stations without starting from scratch.
Repeated measurements also matter, since seasonal water routing can alter sediment strength and make a fixed map grow stale.
Lessons from Greenland sediment
To make these findings useful, sediment maps need to connect with the surface speeds that satellites track across the ice sheet.
Teams already combine velocity with bed topography from BedMachine, which maps Greenland ice thickness and the shape below.
Earlier field surveys in western Greenland found thick sediments under the ablation zone, the lower area where ice loses mass.
Matching seismic points to those surface patterns can help modelers flag where warming could trigger speed-ups that are not yet obvious.
Together, the new seismic map and earlier field evidence show that Greenland‘s base is often soft, uneven, and ready to slide.
Better station coverage and tighter links between meltwater, sediment strength, and flow models should narrow the range of future sea-level projections.
The study is published in Geology.
—–
Like what you read? Subscribe to our newsletter for engaging articles, exclusive content, and the latest updates.
Check us out on EarthSnap, a free app brought to you by Eric Ralls and Earth.com.
—–