

Get insights on thousands of stocks from the global community of over 7 million individual investors at Simply Wall St.
If you are wondering whether Colliers International Group’s current share price reflects its true worth, you are not alone. This article is built to help you make sense of what the market might be pricing in.
The stock recently closed at US$155.13, with total returns of a 20.2% decline over 7 days, a 24.3% decline over 30 days, a 22.2% decline year to date, a 16.7% decline over 1 year, a 1.7% decline over 3 years and an 18.4% gain over 5 years.
Recent coverage of Colliers has focused on its position in real estate services, ongoing transactions activity and its exposure to global property markets. This helps frame how investors are reacting to shifting sector sentiment. These themes have been front of mind for investors assessing whether recent price moves reflect short term sentiment or a more considered view of the business.
On Simply Wall St’s 6 point valuation checklist, Colliers scores 3 out of 6. This suggests some areas point to undervaluation and others look more balanced. Next we will compare different valuation approaches before circling back at the end to a broader way of thinking about what “fair value” can really mean for this stock.
A Discounted Cash Flow, or DCF, model estimates what a company could be worth by projecting future cash flows and discounting them back to today, so you can compare that value with the current share price.
For Colliers International Group, the model used is a 2 Stage Free Cash Flow to Equity approach based on cash flow projections. The latest twelve month Free Cash Flow is about $243.9 million. Analysts provide explicit estimates out to 2027, and Simply Wall St extends these further, with projected Free Cash Flow of about $654.0 million in 2035, all in $.
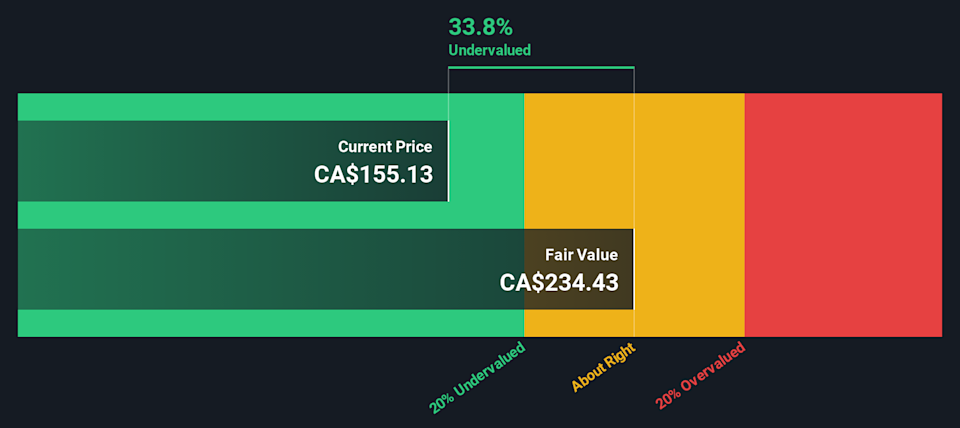
When these projected cash flows are discounted back, the DCF model suggests an estimated intrinsic value of about $233.26 per share. Compared with the recent share price of US$155.13, this implies an intrinsic discount of around 33.5%, indicating that the shares are trading below this modelled value.
Result: UNDERVALUED
Our Discounted Cash Flow (DCF) analysis suggests Colliers International Group is undervalued by 33.5%. Track this in your watchlist or portfolio, or discover 5 more high quality undervalued stocks.
 CIGI Discounted Cash Flow as at Feb 2026
Story Continues
For a profitable company like Colliers International Group, the P/E ratio is a useful shorthand for how much investors are currently paying for each dollar of earnings. It ties the share price directly to the underlying profit, which is usually the main driver of long term equity value.
What counts as a “normal” P/E depends a lot on growth expectations and risk. Higher expected earnings growth or lower perceived risk can support a higher multiple, while slower growth or higher risk tends to justify a lower one. So it helps to compare Colliers with a few different benchmarks rather than looking at its P/E in isolation.
Colliers currently trades on a P/E of about 56.28x, which is above the Real Estate industry average of 14.67x and above the peer group average of 37.31x. Simply Wall St’s Fair Ratio for Colliers is 60.13x. This is its proprietary estimate of a suitable P/E given factors such as earnings growth, profit margins, industry, market cap and specific risks. Because it blends these company specific inputs, the Fair Ratio can be more tailored than a simple comparison with peers or the industry. With the current P/E of 56.28x sitting below the Fair Ratio of 60.13x, this framework points to the shares being undervalued on earnings.
Result: UNDERVALUED
 TSX:CIGI P/E Ratio as at Feb 2026
P/E ratios tell one story, but what if the real opportunity lies elsewhere? Start investing in legacies, not executives. Discover our 3 top founder-led companies.
Earlier we mentioned that there is an even better way to understand valuation. Narratives on Simply Wall St give you a simple way to spell out your story for Colliers International Group, link that story to your own revenue, earnings and margin estimates, turn those into a fair value, and then compare that fair value with the current price. The system updates automatically when new earnings or news arrive. For example, one investor might plug in higher revenue growth and firmer margins to support a fair value close to US$247.89, while another might lean on the lower analyst assumptions and arrive nearer to US$187.24. Both versions sit side by side in the Community page so you can see how different perspectives translate into different fair values and decisions.
Do you think there’s more to the story for Colliers International Group? Head over to our Community to see what others are saying!
TSX:CIGI 1-Year Stock Price Chart
This article by Simply Wall St is general in nature. We provide commentary based on historical data and analyst forecasts only using an unbiased methodology and our articles are not intended to be financial advice. It does not constitute a recommendation to buy or sell any stock, and does not take account of your objectives, or your financial situation. We aim to bring you long-term focused analysis driven by fundamental data. Note that our analysis may not factor in the latest price-sensitive company announcements or qualitative material. Simply Wall St has no position in any stocks mentioned.
Companies discussed in this article include CIGI.TO.
Have feedback on this article? Concerned about the content? Get in touch with us directly. Alternatively, email editorial-team@simplywallst.com