
Growth conditions and strains
All the strains, phages, plasmids and oligonucleotides used in this study are listed in Supplementary Table 4. The sequences of all plasmids were confirmed by whole-plasmid sequencing. All bacterial strains were E. coli MG1655 derivatives unless noted otherwise. All λ strains in this study had mutations in the cI repressor and/or operator. Phages referred to as simply λ correspond to λvir, which cannot establish lysogeny owing to operator mutations and a frameshift in cI. The generalist λ mutant was derived from λ cI26, which has a frameshift in cI and is therefore incapable of establishing lysogeny, and λparS harbours the cI857 mutation, which produces a temperature-sensitive repressor that is functional at 30 °C but not at 37 °C.
All the bacterial strains were grown in LB or M9 medium (6.4 g l−1 Na2HPO4-7H2O, 1.5 g l−1 KH2PO4, 0.25 g l−1 NaCl, 0.5 g l−1 NH4Cl, 0.1% casamino acids, 25 mM MgSO4 and 0.1 mM CaCl2) at 37 °C unless specified otherwise. Antibiotics were used at the following concentrations (liquid; plates): carbenicillin (50 μg ml−1; 100 μg ml−1); chloramphenicol (20 μg ml−1; 30 μg ml−1); and kanamycin (30 μg ml−1; 50 µg ml−1).
Phages were amplified by back-diluting overnight bacterial cultures to an optical density at 600 nm (OD600) of around 0.05 in 1 ml LB medium and inoculating with a liquid phage stock at around 0.1 MOI or a single phage plaque. Phage amplification was done at 37 °C for 6–20 h. After this incubation, bacteria were pelleted by centrifugation and the supernatant was transferred to a new tube. This phage supernatant was either vortexed with an additional 100 µl of chloroform or passed through a 0.2 µm filter to remove remaining bacteria.
MacConkey agar plates were prepared using MacConkey agar powder (Difco) and 1% w/v mannose sugar. Strains were streaked out on these plates and grown at 30 °C for 12 h before imaging.
SNIPE plasmids
SNIPE–GFP was generated by amplifying sfGFP-C1 (Addgene, 54579) with oDS6 and oDS7, and pKVS45-PD-λ-1 with oDS5 and oDS8, followed by Gibson assembly. Pvan–SNIPE was generated by amplifying pKVS45-PD-λ-1 with oDS30 and oDS31 and the Pvan vector followed by Gibson assembly. The pBAD-SNIPE–mCherry, the parent plasmid for pBAD-SNIPE–mCherry with ∆TM, ∆DUF4041 and/or E414A mutations, was generated by amplifying pKVS45-PD-λ-1 with oDS473 and oDS499, mCherry-pBAD (Addgene, 54630) with oDS472 to oDS500, and a pBAD vector with oDS498 and oDS501, followed by Gibson assembly. SNIPE-TurboID-FLAG was generated by amplifying the TurboID-His6_pET21a plasmid (Addgene, 107177) using oDS665 and oDS668 and amplifying SNIPE-FLAG with oDS666 and oDS667 followed by Gibson assembly. SNIPE-FLAG was generated by amplifying pKVS45-PD-λ-1 with oDS3 and oDS4, followed by Gibson assembly.
To generate SNIPE(∆TM) plasmids, parent plasmids were amplified with oDS47 and oDS48 followed by Gibson assembly. Similarly, SNIPE(∆DUF4041) plasmids were generated by amplifying the parent plasmids with oDS51 and oDS52 followed by Gibson assembly. The E414A point mutation was introduced by amplifying parent plasmids with oDS92 and oDS93, followed by Gibson assembly. Other point mutations were generated by amplifying pKVS45-PD-λ-1 with the following primers: oDS923 and oDS924 (L253H); oDS925 and oDS926 (E264K); oDS927 and oDS928 (K305N); oDS929 and oDS930 (E223K); oDS931 and oDS932 (T319A); oDS933 and oDS934 (W257R); oDS935 and oDS936 (I308V); and oDS1075 and oDS1076 (N250amber/pBPA). These PCR products were then circularized by ligation with T4 DNA ligase.
Plasmids with different combinations of the DUF4041, linker and/or catalytically inactive GIY-YIG nuclease domain fused to GFP were generated by amplifying SNIPE–GFP(E414A) with the following primers: oDS138 and oDS139 (DUF4041-linker-nuclease); oDS140 and oDS141 (linker-nuclease); and oDS142 and oDS143 (nuclease). These PCR products were then circularized by Gibson assembly. Two further combinations were made by amplifying the DUF4041-linker-nuclease plasmid made above with the following primers: oDS144 and oDS145 (DUF4041); and oDS146 and 147 (DUF4041-linker). These PCR products were then circularized by Gibson assembly.
A PhoA–LacZα fusion protein was inserted into SNIPE(E414A) at different locations, as described previously15. Specifically, the PhoA–LacZα fusion protein was amplified from pKTop::tse5-CT (Addgene, 192955) with the following primers for insertion at different amino acids (a.a.) of SNIPE: oDS412 and oDS413 (SNIPE, a.a. 1); oDS416 and oDS417 (SNIPE, a.a. 30); oDS420 and oDS421 (SNIPE, a.a. 120); and oDS424 and oDS425 (SNIPE, a.a. 500). Furthermore, Pvan–SNIPE(E414A) was amplified with the following primers: oDS411 and oDS414 (SNIPE, a.a. 1); oDS415 and oDS418 (SNIPE, a.a. 30); oDS419 and oDS422 (SNIPE, a.a. 120); and oDS423 and oDS426 (SNIPE, a.a. 500). The two PCR products for a specific insertion point were then assembled by Gibson assembly.
Other plasmids
Pvan-manXYZ was generated by amplifying the manXYZ operon from E. coli MG1655 with oDS171 and oDS172, and amplifying the Pvan vector with oDS170 and oDS173, followed by Gibson assembly. Next, Pvan-manXYZ(TurboID-manZ) was generated by amplifying TurboID from TurboID-His6_pET21a with oDS810 and oDS811, and amplifying Pvan-manXYZ with oDS809 and oDS812, followed by Gibson assembly.
To generate Pvan-ftsH-TurboID, the Pvan vector was amplified with oDS883 and oDS891, ftsH was amplified from E. coli MG1655 with oDS892 and oDS893, and TurboID was amplified from TurboID-His6_pET21a with oDS882 and oDS887, followed by Gibson assembly. To generate Pvan-proW-TurboID, the Pvan vector was amplified with oDS883 and oDS897, proW was amplified from E. coli MG1655 with oDS898 and oDS899, and TurboID was amplified from TurboID-His6_pET21a with oDS882 and oDS887, followed by Gibson assembly.
To generate pBAD-EcoRI R–mCherry, EcoRI R was amplified from a the pOpen-EcoRI R plasmid (Addgene, 165504) with oDS505 and oDS908, mCherry was amplified from pBAD-SNIPE–mCherry with oDS909 and oDS910, and the pBAD vector was amplified with oDS504 and oDS911; these products were then Gibson assembled.
To generate Pvan-malF(TM1-2)-GFP-fis, fis was amplified from E. coli MG1655 with oDS1115 and oDS1116, malF(TM1-2) was amplified from E. coli MG1655 with oDS149 and oDS1112, GFP was amplified from sfGFP-C1 (Addgene, 54579) with oDS1113 and oDS1114, and the Pvan backbone was amplified with oDS148 and oDS1117, followed by Gibson assembly.
E. coli gene deletions
∆manYZ, ∆manXYZ and ∆lamB strains were generated using the lambda red recombination protocol derived from ref. 44. In brief, pKD4 was amplified with oDS94 and oDS95 to generate a ∆manYZ::kanR product, oDS95 and oDS174 to generate a ∆manXYZ::kanR product, and oDS96 and oDS97 to generate a ∆lamB::kanR product. These products were electroporated into either E. coli MG1655 or ECOR13 that contained a plasmid that can express lambda red proteins (pKD46). KanR colonies that contained putative recombination events between the kanR cassette and the gene or operon of interest were isolated and confirmed with junction PCR.
Phage and bacterial spotting assays
To prepare plates for phage spotting assays, 30 µl of a bacterial overnight culture was added to 4 ml of molten LB + 0.5% agar, and this mixture was then poured onto LB + 1.2% agar plates. After the top agar solidified, tenfold serial dilutions of a phage stock were made and 2 µl of each dilution was pipetted onto the plate using a multichannel pipette. Plates were incubated at 37 °C for 8–20 h before imaging. Images are representative of at least two independent biological replicates. EOP values were assessed qualitatively, given that strong defence prevents the formation of individual plaques. For one exception (Extended Data Fig. 7b), we used the top agar overlay method with different strains of interest and quantified plaques for three independent biological replicates.
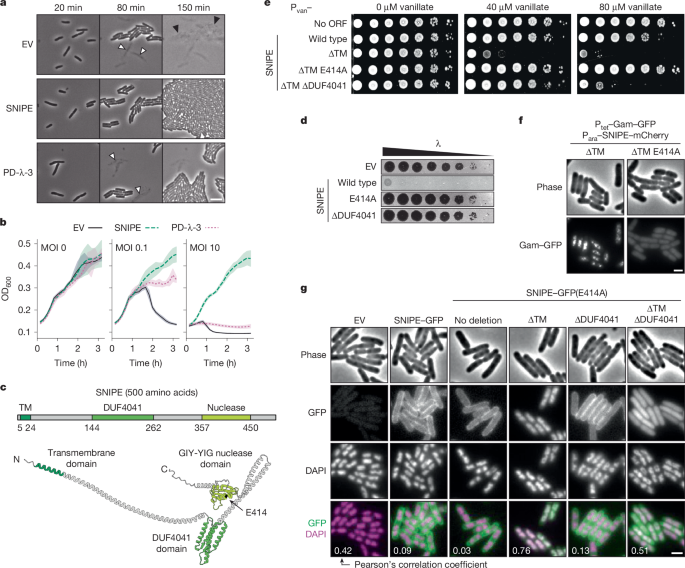
For bacterial spotting assays, overnight cultures of bacteria were back-diluted to an OD600 of 1, tenfold serial dilutions of this bacterial stock were made, and 3 µl of each dilution was spotted onto LB + 1.2% agar + 0 µM, 40 µM or 80 µM vanillate plates. Plates were incubated at 37 °C for around 12 h before imaging. Images are representative of three independent biological replicates.
Growth curve assays
Overnight cultures were back-diluted to an OD600 of 0.01 and grown to mid-log phase in LB medium at 37 °C, then back-diluted to an OD600 of 0.1. Then 100-µL aliquots of these cell solutions were added to wells of a 96-well plate, and 10 µl of different phage dilutions was then added to generate different MOIs. Samples were incubated at 37 °C with orbital shaking on a plate reader (Biotek) for 8 h, with OD600 measurements every 10 min.
For growth in minimal media with glucose or mannose, overnight cultures were back-diluted to an OD600 of 0.01 and grown to mid-log phase in LB medium at 37 °C. Cells were then washed twice with 1 ml minimal media (6.4 g l−1 Na2HPO4-7H2O, 1.5 g l−1 KH2PO4, 0.25 g l−1 NaCl, 0.5 g l−1 NH4Cl, 25 mM MgSO4 and 0.1 mM CaCl2) and resuspended in 1 ml aliquots of minimal media and 0.2% (w/v) glucose or minimal media and 0.5% (w/v) mannose at a final OD600 of 0.05. Samples were incubated at 37 °C with orbital shaking on a plate reader (Biotek) for 28 h, with OD600 measurements every 20 min.
Plasmid transformation efficiency assay
Chemically competent cells were prepared using the transformation and storage solution (TSS) method. In brief, overnight cultures were diluted to an OD600 of 0.05 and grown to mid-log phase in LB medium at 37 °C. Cells were collected by centrifugation, resuspended in ice-cold TSS buffer, aliquoted and kept on ice. For transformation, equal volumes of competent cells were mixed with defined amounts of an empty vector plasmid (pDSS240) and incubated on ice for 30 min. LB medium was added and cells were recovered at 37 °C for 1 h before plating on selective LB agar. Colony-forming units were counted after overnight incubation, and transformation efficiency was calculated as colony-forming units per ng of input plasmid DNA.
Microscopy
To prepare cells for microscopy, overnight cultures were back-diluted to an OD600 of 0.05 and grown in LB medium at 37 °C until cells reached the mid-exponential phase (an OD600 of 0.3–0.4) unless specified otherwise.
Cells were then concentrated to an OD600 of 1.0–1.5 to have a high cell density for microscopy. LB + 1.5% Ultrapure Agarose (Invitrogen, 16500-100) was melted and 600 µl was added to a 22 mm × 22 mm number 1.5 coverslip (VWR) and an identical coverslip was immediately placed on top. After the agarose pad solidified, the top coverslip was removed and 0.2 µl of cells were spotted onto the pad. For a given experiment, multiple bacterial strains were spotted onto the same agarose pad at different positions. After the spots soaked into the agarose pad, a 50 mm × 22 mm number 1.5 coverslip (VWR) was placed on top of the pad. Samples were imaged with phase contrast and epifluorescence channels on a Zeiss Observer Z1 microscope with a 100×/1.4 oil-immersion objective lens and a Colibri illumination system. Samples were kept at 37 °C during imaging by using a XLmulti S incubator (Pecon) and Heating Unit XL and TempModule S (Zeiss). An Orca Flash 4.0 camera (Hamamatsu) and Metamorph (Molecular Devices) were used for imaging. Image analysis was done using Fiji (ImageJ). All samples in an experiment are shown with similar brightness unless otherwise noted.
For SNIPE–GFP localization experiments, mid-exponential-phase cells were incubated with 10 µg ml−1 DAPI for 10 min before imaging. These cells were imaged with phase contrast, DAPI and FITC channels. Images are representative of three independent biological replicates. Pearson’s correlation coefficients were calculated in Fiji (ImageJ) using the Coloc 2 plugin, following thresholding of the phase channel, conversion to a mask and segmentation with the watershed algorithm.
For experiments with Gam–GFP, cells were grown to mid-exponential phase in M9 media + 1% glucose (to repress SNIPE–mCherry and EcoRI R–mCherry) + 10 µg ml−1 aTc (to express Gam–GFP) + carbenicillin + chloramphenicol. Cells were then washed with and resuspended in M9 media + 0.25% arabinose (to express SNIPE–mCherry or EcoRI R–mCherry) and incubated at 37 °C for 40 min. DAPI was then added to a 10 µg ml−1 final concentration and cells were incubated at 37 °C for another 10 min. These cells were then imaged on a M9 media + 1.5% agarose pad with FITC, rhodamine, DAPI and phase-contrast channels. Images are representative of three biological replicates. Maximum pixel-intensity values were quantified in Fiji (ImageJ) after thresholding the phase channel, converting it to a binary mask and segmenting cells using the watershed algorithm. Individual cells were then analysed with the Analyze Particles → Measure function.
For experiments involving infection of CFP-ParB cells with λparS phage, cells were grown to mid-exponential phase in LB medium + 20 µM IPTG (to induce CFP-ParB expression) + carbenicillin + chloramphenicol at 37 °C. Cells were concentrated to an OD600 of 1.5 in 100 µl of the same media and placed on ice for 5 min. The λparS was then added at an MOI of around 6 and incubated with cells on ice for 30 min to facilitate adsorption but prevent genome injection. This phage and cell mixture was then spotted onto a cooled LB + 1.5% agarose pad with 20 µM IPTG, carbenicillin and chloramphenicol. This agarose pad was quickly transferred to the microscope, which maintained the samples at 37 °C and thus triggered genome injection. Samples were imaged in the phase contrast and CFP channels every 5 min for 150 min. Quantification of CFP-ParB foci per cell and cell death per infected cell was done manually. Images are representative of three biological replicates.
For experiments involving the induction of λparS cI857 prophages by heat shock, lysogens containing this prophage were grown to mid-exponential phase in LB + 80 µM IPTG (to induce CFP-ParB) + carbenicillin + chloramphenicol at 30 °C to prevent prophage induction. This cell solution was transferred to a 42 °C heat block for 5 min to initiate prophage induction. Cells were then spotted onto a pre-warmed LB + 1.5% agarose pad with 80 µM IPTG, carbenicillin and chloramphenicol. This pad was transferred to the microscope, where it was maintained at 37 °C and imaged in the phase contrast and CFP channels every 5 min for 150 min. The remaining cells that were not spotted onto the agarose pad were incubated at 37 °C for 4 h, after which plaque-forming units were quantified by spotting assays. Comparison of plaque-forming units per OD600 of cells that were initially induced yielded values shown in Fig. 2f. Images and phage-spotting assays are representative of three independent biological replicates.
To test for direct defence and abortive infection phenotypes, cells were grown to mid-exponential phase in LB medium + chloramphenicol, followed by the addition of λ at 2 MOI, which ultimately yielded approximately one phage infection event for every two cells. This phage and cell mixture was incubated at 37 °C for 8 min to allow phage adsorption, followed by two rapid washes in LB medium + chloramphenicol to remove any unadsorbed phage. This phage and cell mixture was then spotted onto an LB + 1.5% agarose pad with chloramphenicol and imaged in the phase contrast channel for 3 h at 10-min time intervals. The imaging started exactly 20 min after the phage and cells were first mixed. Images and videos are representative of three independent biological replicates.
For experiments involving MalF(TM1-2)-GFP-Fis, cells were grown to mid-log phase in LB medium, and 50 µM vanillate was added. This solution was incubated at 37 °C for 30 min. DAPI was then added to a 10 µg ml−1 final concentration and cells were incubated at 37 °C for another 10 min. These cells were then imaged on an LB + 1.5% agarose pad with the FITC, DAPI and phase contrast channels. Images are representative of three independent biological replicates.
PhoA–LacZα topology assay
Membrane topology assays were performed as previously described15,45, using the E. coli DH5α strain, which is naturally ∆phoA and is capable of β-galactosidase α-complementation (provided by LacZα). Specifically, three independent overnight cultures per strain were back-diluted to an OD600 of 0.05 in 3 ml LB medium + 200 µM vanillate to induce Pvan–SNIPE constructs and grown to late log phase (an OD600 of about 0.8). To test for PhoA activity, 1 ml of each sample was washed once in 1 ml P buffer (1 M Tris-HCl, pH 8.0, and 0.1 mM ZnCl2) and resuspended in 1 ml P buffer. Next, 50 µl of chloroform and 50 µl of 0.1% SDS was added to each sample and vortexed for 5 s to permeabilize the cells. This solution was incubated at 30 °C while chloroform separated from the aqueous layer. Then 150 µl of the aqueous layer was transferred to a 96-well plate. The enzymatic reaction was initiated by adding 18 µl of p-nitrophenylphosphate solution (Sigma, N7653) to each sample. Samples were incubated at 30 °C with orbital shaking on a plate reader (Biotek) for 2 h, with OD405 measurements every 2 min. OD600 was also measured to calculate the number of cells in each sample.
In parallel, to test for LacZ activity, 1 ml of each late-exponential-phase culture described above was washed once with 1 ml of Z buffer (60 mM Na2HPO4, 40 mM NaH2PO4, 10 mM KCl, 1 mM MgSO4 and 50 mM β-mercaptoethanol added on the day of the experiment) and resuspended in 1 ml Z buffer. Next, 50 µl of chloroform and 50 µl of 0.1% SDS were added to each sample and vortexed for 5 s to permeabilize the cells. This solution was incubated at 30 °C while chloroform separated from the aqueous layer. Then 150 µl of the aqueous layer was transferred to a 96-well plate. The enzymatic reaction was initiated by adding 18 µl of 4 mg ml−1 o-nitrophenyl galactopyranoside (Sigma, N1127) to each sample. Samples were incubated at 30 °C with orbital shaking on a plate reader (Biotek) for 2 h, with OD420 measurements every 2 min. The OD600 was also measured to calculate the number of cells in each sample.
To measure the enzymatic activities of PhoA and LacZ, the difference in OD405 or OD420 measurements between 0 and 60 min was calculated and calibrated to the starting OD600 of the sample to provide the enzymatic activity per cell. These analyses were done separately for the three independent biological replicates before we calculated the averages and standard deviations.
Membrane fractionation and immunoblots
Overnight bacterial cultures were back-diluted in LB medium and grown to an OD600 of 0.6 at 37 °C. Cells were pelleted by centrifugation and resuspended in Buffer A (150 mM NaCl, 50 mM HEPES, pH 7) with EDTA-free protease inhibitor (Roche), 5 µl (150 kU) Ready-Lyse (Biosearch Technologies), 5 µl (125 U) benzonase (Millipore) and 2 mM MgCl2. For measurements of protein levels in lysates, this cell solution was lysed in 1× Laemmli buffer with gentle heating at 50 °C, followed by electrophoresis and immunoblots as described below. For membrane fractionation, the cell solution was incubated on ice for 30 min to facilitate degradation of the peptidoglycan layer and then lysed by sonication. Lysate was centrifuged at 10,000g to pellet debris, and the supernatant was transferred to a new tube and centrifuged at 140,000g to pellet membranes. The supernatant from this spin was saved as the cytoplasmic fraction. The membrane pellet was briefly rinsed with Buffer A and resuspended in 2 ml of Buffer A with a Dounce homogenizer.
Samples were normalized by protein concentration, mixed with 4× Laemmli buffer and centrifuged at 13,000g for 10 min to pellet any debris. Next, 25 µl of each sample was subjected to electrophoresis with a 4–20% polyacrylamide gel and transferred to a 0.2 µm polyvinylidene difluoride membrane. Anti-GFP (Invitrogen, A11120), anti-DnaK (AssayPro, 32857-05111) and anti-OmpC (Bioss Antibodies, bs20213R) antibodies were used at a final concentration of 1:1,000, and goat anti-mouse IgG conjugated to HRP (Thermo, 32430) or goat anti-rabbit IgG conjugated to HRP (Thermo 32460) was used at a final concentration of 1:10,000. SuperSignal West Femto Maximum Sensitivity Substrate (Thermo) was used to develop blots. Blots were imaged using a ChemiDoc Imaging system (Bio-Rad). Images shown are representative of two biological replicates.
Adsorption assay
Overnight bacterial cultures were back-diluted to an OD600 of 0.05 in 1 ml of LB medium and grown to an OD600 of 0.5 at 37 °C. These cultures were infected with λ at an MOI of 0.1 and incubated at 37 °C for 15 min. Samples were then centrifuged at 10,000g for 3 min and the phage-containing supernatant was transferred to a new tube containing 100 µl chloroform, which was then vortexed. The number of plaque-forming units per microlitre was calculated using the top agar overlay method with E. coli MG1655. Percentage adsorption was determined relative to a simultaneous control sample that contained growth medium but no cells. Data represent the averages and standard deviations of three independent biological replicates.
Injection of radiolabelled phage DNA
A protocol to generate λ with 32P-labelled DNA was designed using information from refs. 19,46. First, low-phosphate H-media (20 mM KCl, 85 mM NaCl, 20 mM NH4Cl, 1 mM MgSO4, 50 µM CaCl2, 70 mM sodium lactate, 0.2% glycerol, 0.05% bacto-peptone (Difco) and 0.05% bacto-casamino acids (Difco)) was prepared as a 2× concentrate and diluted in water and 4% agar to generate molten H media + 1.2% agar and molten H media + 0.5% agar. Next, 5 ml of H media + 1.2% agar was poured into a 60 mm petri dish and allowed to solidify. Then 3 ml of the molten H media + 0.5% agar was mixed with 15 µl of ∆dam E. coli overnight culture (to prevent Dam methylation of DNA in this strain, the purpose of which is described below), 10,000 plaque-forming units of λ and 300 µCi 32P (Revity). This mixture was immediately plated onto the H media 1.5% agar plate, which was incubated at 37 °C overnight. This protocol produced confluent lysis of the E. coli, which enabled recovery of much higher phage titres than similar attempts at phage amplification in liquid H media.
To recover 32P-labelled phage, 1 ml of FM buffer (20 mM Tris-HCl, pH 7.4, 100 mM NaCl and 10 mM MgSO4) was gently added to the top of the plate and incubated for 3 h at room temperature. This solution was then aspirated off of the plate and transferred to a microfuge tube. RNaseA was added at 10 µg ml−1 and incubated for 5 min at room temperature to degrade the 32P-labelled RNA. This solution was centrifuged at 10,000g to remove bacterial debris, transferred to a new tube with 10% volume chloroform, vortexed and centrifuged again. The supernatant was transferred to a 0.5 ml 50 kDa MWCO spin concentrator (Amicon) and repeatedly spin concentrated and resuspended in FM buffer to quickly remove the excess 32P present in the media. This protocol typically yielded 200 µl of 106 plaque-forming units of λ per microlitre.
To infect cells with 32P-labelled λ, overnight cultures of different E. coli strains, which contained functional Dam and thus methylated their DNA, were back-diluted to an OD600 of 0.1 in 1 ml of LB medium and grown at 37 °C until they reached an OD600 of 0.4. These cell solutions were then centrifuged, resuspended in 100 µL of LB medium and placed on ice for 5 min. Next, the entire volume of radiolabelled phage was distributed equally across the bacterial samples, which yielded an MOI of approximately 0.1. These phage and cell mixtures were incubated on ice for 20 min to facilitate adsorption, then at 37 °C for 15 min to trigger genome injection. Cells were then spun down and resuspended in 1 ml of ice-cold PBS, and this wash step was repeated, effectively removing any unadsorbed phage particles. Cells were then spun down and resuspended in 25 µl ice-cold 1× rCutSmart buffer + 0.5 µl (15 kU) Ready-Lyse (Biosearch Technologies) and incubated on ice for 5 min. This solution was flash-frozen with liquid nitrogen and thawed three times to lyse cells. Then 0.5 µl (10 U) of DpnI (NEB) was added to each sample and incubated at 37 °C for 5 min to degrade the Dam-methylated E. coli DNA and thus decrease the viscosity of the sample (notably, because phage were amplified in a ∆dam strain, they did not have methylated DNA, and phage DNA was thus resistant to DpnI-mediated degradation).
Two controls were prepared at this time. First, one aliquot of empty vector cells that had been infected with 32P-labelled λ was treated with 1 µl (25 U) of benzonase (Millipore) and incubated at 37 °C for 5 min to degrade all the DNA in that sample. A second sample of empty vector cells that had been infected with 32P-labelled λ was mixed with a sample of SNIPE-expressing cell lysate that had not been infected with phage, and this mixture was incubated at 37 °C for 5 min. This effectively tested whether SNIPE is capable of cleaving phage DNA in cell lysates (that is, after genome injection had already occurred), which did not turn out to be the case.
To measure the length distributions of 32P-labelled DNA in these samples, these lysates were mixed with 4× Laemmli buffer and centrifuged at 13,000g for 10 min to pellet any remaining bacterial debris. Then 25 µl of each sample was loaded into a 4–20% pre-cast polyacrylamide gel (Bio-Rad). This gel was run at 100 V for 20 min and then 150 V for 25 min. The gel was incubated with a phorphorscreen and imaged using a Typhoon imager (GE Healthcare). Data for two independent biological replicates are shown.
Proximity labelling with TurboID
Proximity-labelling assays were done as previously described23, with some modifications. Overnight bacterial cultures were back-diluted to an OD600 of 0.1 in 50 ml of LB medium + appropriate antibiotics with and without vanillate and grown at 37 °C to an OD600 of 0.4. The Pvan promoter was used to express various constructs (TurboID-ManZ, FtsH-TurboID and ProW-TurboID). Leaky expression under this promoter in the absence of vanillate was sufficient to express TurboID-ManZ, but not FtsH-TurboID or ProW-TurboID. Therefore, 0 µM vanillate was used for some experiments (Extended Data Fig. 4b,f,g,j) and 5 µM vanillate was used for others (Fig. 3c and Extended Data Fig. 4c–e).
Following cell growth, these samples were then centrifuged, and cells were resuspended in 1.5 ml putrescine buffer (10 mM Tris-HCl, pH 7.4, 10 µM MgCl2 and 10 mM putrescine dihydrochloride). Previous studies demonstrated that polyamines such as putrescine ‘lock’ λ DNA in the phage capsid, such that the genome-injection apparatus is probably able to assemble but DNA injection is not completed47,48; this phenomenon helped to stall otherwise transient genome-injection events to enable better proximity labelling of phage proteins. Biotin (dissolved in DMSO to 100 mM) was added at a 500 µM final concentration, λ was added at an MOI of 40, and these samples were placed at 37 °C for 15 min to facilitate biotinylation of phage and host proteins.
After this incubation step, samples were washed three times by centrifugation and resuspension of cells in 1 ml ice-cold putrescine buffer + 1 µl (25 U) benzonase (Millipore). Finally, cells were pelleted and resuspended in 1.5 ml RIPA buffer (50 mM Tris-HCl, pH 7.4, 150 mM NaCl, 1% Triton X-100, 0.5% sodium deoxycholate and 0.1% SDS) + EDTA-free protease inhibitor (Roche) + 1 µl (25 U) benzonase (Millipore) + 1 µl (30 kU) Ready-Lyse (Biosearch Technologies). Cells were lysed by sonication and then spun at 15,000g for 10 min to pellet cell debris. The supernatant was transferred to a fresh tube with 75 µl of streptavidin magnetic beads (Invitrogen, 65002) that had been pre-equilibrated in RIPA buffer. This mixture was incubated on an end-over-end rotor at 4 °C overnight.
Streptavidin beads were subsequently washed twice with each of the following buffers: RIPA buffer (1 M KCl, 100 mM Na2CO3), urea buffer (2 M urea, 10 mM Tris-HCl, pH 7.4) and PBS. On-bead reduction, trypsin digestion and liquid chromatography–tandem mass spectrometry (LC–MS/MS) were done by the MIT Biopolymers and Proteomics Core. Specifically, proteins were reduced with 10 mM dithiothreitol (Sigma) for 1 h at 56 °C, followed by alkylation with 20 mM iodoacetamide (Sigma) for 1 h at 25 °C in the dark. Digestion was done overnight using modified trypsin (Promega) in 100 mM ammonium bicarbonate (pH 8) at an enzyme-to-substrate ratio of 1:50. The digestion was terminated by the addition of formic acid (99.9%; Sigma). The resulting peptides were desalted using Pierce Peptide Desalting Spin Columns (Thermo) and subsequently lyophilized. Peptide separation was done on a PepMap RSLC C18 column (Thermo) over a 90-min gradient using reverse-phase high-performance liquid chromatography (Thermo, Ultimate 3000) followed by nano-electrospray ionization and analysis on an Orbitrap Exploris 480 mass spectrometer (Thermo). The mass spectrometer operated in data-dependent acquisition mode, with full-scan parameters set to a resolution of 120,000 across an m/z range of 375–1,600 and a maximum ion injection time of 25 ms. MS/MS acquisition was done for as many precursor ions as possible in a 2-s cycle, using a resolution of 30,000, a normalized collision energy of 28 and a dynamic exclusion window of 20 s. Peptides were mapped to proteins from E. coli MG1655, proteins from λ and proteins of interest, such as SNIPE–GFP and TurboID–ManZ. To compute ratios between spectral counts from different samples, a pseudocount was first added to each spectral count value. Ratios were computed only for proteins in which the number of spectral counts was 50 or more for at least one of the samples.
Error-prone PCR and SNIPE mutant selection
SNIPE was mutagenized using error-prone PCR-based mutagenesis, as previously described49. Different regions of SNIPE (corresponding to amino acids 1–190, 191–330 and 331–500) were amplified using Taq polymerase (NEB), and 0.5 mM MnCl2 was added to the reaction as the mutagenic agent. PCR products were treated with DpnI, gel extracted and separately cloned into the original pKVS45-PD-λ-1 plasmid using Gibson assembly, with the goal of creating three pools with mutations in these different regions. Gibson products were column purified and electroporated into E. coli MG1655. Around 10 million independent transformants were recovered for each pool, which were then combined to generate a mutagenized library of about 30 million SNIPE mutants.
To select SNIPE mutants with enhanced defence against Bas14, the SNIPE mutant library was grown to saturation overnight, 50 µl of this culture was mixed with Bas14 at an MOI of 1, and this solution was immediately plated on LB medium + 1.5% agar + chloramphenicol plates. After incubation overnight at 37 °C, Bas14-resistant colonies were picked, streaked for single colonies, grown into cultures and miniprepped, and the resulting plasmids were transformed into E. coli MG1655. Plasmids that conferred protection against Bas14 were sequenced to identify SNIPE mutations. Mutations were mapped onto the SNIPE structure predicted by AlphaFold3 using UCSF ChimeraX.
Isolation and sequencing of phage escapers
Bas14 escapers were selected by mixing 30 µl of SNIPE(L253H E264K K305N) overnight culture and 109 plaque-forming units of Bas14 with molten LB medium + 0.5% agar and using the top agar overlay method. Individual plaques were amplified in the SNIPE(L253H E264K K305N) strain and single plaques were isolated and amplified again to generate isogenic phage stocks.
Phage DNA was extracted by treating 200 µl of phage stock (over 107 plaque-forming units per microlitre) with 0.2 U DNaseI and 0.05 mg ml−1 RNaseA at 37 °C for 30 min. Then 10 mM EDTA was added to inactivate these nucleases. This solution was then incubated with Proteinase K at 50 °C for 30 min to disrupt phage particles and release DNA, which was then isolated by ethanol precipitation.
To prepare Illumina sequencing libraries, 200 ng of phage DNA was sheared in a Diagenode Bioruptor 300 sonicator water bath for 20 × 30 s cycles at maximum intensity. Sheared gDNA was prepared for Illumina sequencing using the NEBNext Ultra II DNA library preparation kit and sequenced on an Illumina MiSeq at the MIT BioMicroCenter. Illumina reads were assembled to the Bas14 reference genome using Geneious Prime 2025.3.
Tn-Seq
Tn-Seq of cells in the presence or absence of phage infection was done as previously described27. A pool of cells harbouring random transposon insertions50, each with a unique barcode and a kanR cassette, was grown to late-log phase and aliquots containing around 107 cells were prepared. Different phages were added to separate tubes at about 1 MOI, and LB medium was added to a no-phage control. These samples were then immediately plated on LB medium + kanamycin plates and grown overnight at 37 °C. Colonies were scraped off of the plates and gDNA from 1 OD600 unit of cells per sample was extracted with a DNeasy Blood and Tissue Kit (Qiagen). Next, 85 ng of DNA from each sample was amplified with BarSeq primers (Supplementary Table 4) to specifically amplify transposon barcodes with flanking Illumina adapter and index sequences. PCR products were pooled, treated with DpnI, run on an agarose gel and gel extracted. The pooled library was sequenced on an Illumina MiSeq at the MIT BioMicroCenter.
To count the number of reads for each barcode, we used previously written scripts50, available at https://bitbucket.org/berkeleylab/feba. We log2-normalized read counts in each condition by calculating for each read count, \({\text{log}}_{2}(\frac{{\rm{r}}{\rm{e}}{\rm{a}}{\rm{d}}\,{\rm{c}}{\rm{o}}{\rm{u}}{\rm{n}}{\rm{t}}}{\sum _{{\rm{c}}{\rm{o}}{\rm{n}}{\rm{d}}{\rm{i}}{\rm{t}}{\rm{i}}{\rm{o}}{\rm{n}}}{\rm{r}}{\rm{e}}{\rm{a}}{\rm{d}}\,{\rm{c}}{\rm{o}}{\rm{u}}{\rm{n}}{\rm{t}}{\rm{s}}}\times {10}^{6}+1)\). Then, to identify enriched barcodes, for each phage we fit a linear regression between the log2-normalized read counts of the no-phage condition (independent variable) and the log2-normalized read counts of the phage condition (dependent variable). For each barcode, the residual from the linear regression represented its deviation from expectation. We then mapped barcodes to genes using previously described mapping information50 and averaged residuals for each gene to get log2 enrichment scores.
Unnatural amino acid crosslinking
Overnight bacterial cultures harbouring different SNIPE–FLAG constructs and a plasmid with a suppressor tRNA and specialized tRNA synthetase (pSup-pBpaRS-6TRN)28 were back-diluted to an OD600 of 0.05 in 2 l of LB medium + 1.2 mM pBPA and grown at 37 °C to an OD600 of 0.4. Cells were then pelleted by centrifugation and resuspended in 25 ml of putrescine buffer (10 mM Tris-HCl, pH 7.4, 10 µM MgCl2 and 10 mM putrescine dihydrochloride). Bas14 was then added at 30 MOI and samples were exposed to UV with a Evoluchem 365 nm LED (HepatoChem) for 15 min. Cells were then pelleted by centrifugation and resuspended in 25 ml ice-cold Buffer A (50 mM HEPES, pH 7.5, 150 mM NaCl) + EDTA-free protease inhibitor (Roche) + 1 µl (25 U) benzonase (Millipore). Cells were lysed with an LM20 Microfluidizer (Microfluidics) at 18,000 psi and cell debris was pelleted at 10,000g for 30 min. Next, 20% Anzergent 3-12 was added to the supernatant to a final concentration of 1% to solubilize the membrane proteins. This solution was then spun at 100,000g for 1 h to pellet unsolubilized membranes, and the supernatant was incubated with 75 µl of Pierce anti-FLAG magnetic beads (Thermo) overnight at 4 °C. Beads were washed three times with Buffer A + 150 mM NaCl + 0.1% Anzergent 3-12, then washed three times with Buffer A + 150 mM NaCl to remove any remaining detergent. On-bead reduction, trypsin digestion and LC–MS/MS were done by the MIT Biopolymers and Proteomics Core, as described above. Peptides were mapped to proteins from E. coli MG1655 and Bas14. To compute ratios between spectral counts from different samples, a pseudocount of 0.5 was first added to each spectral count value.
SNIPE homologue analysis
SNIPE homologues analysed in this study were originally identified in ref. 13. The original set of 1,141 homologues was condensed with MmSeqs2 with a clustering threshold of 0.95 and an alignment coverage threshold of 0.9 to remove highly similar homologues. This condensed list of 512 homologues was then aligned and manually curated to remove homologues that were clearly truncated versions of other homologues in the set, as would be expected from misannotated start codons. The resulting list comprised 474 SNIPE homologues and was used for the analyses in this study.
The N-terminal regions of SNIPE were extracted and used in a HHblits search for hits in the Pfam database (PFAM), conserved domain database (cdd) from NCBI and the Protein Data Bank (PDB). Hits with a P value of less than 10−5 were considered significant and used for further analysis. These hits were sorted into two sets, one from SNIPE homologues with 1–2 predicted TMs, and the other from SNIPE homologues that lacked predicted TMs. Because there were usually multiple significant hits for each SNIPE homologue and many homologues had similar hits, we identified the most common hit within a set, calculated the number of SNIPE homologues containing that hit, and then removed all SNIPE homologues that contained one of these hits from further analysis. This process was iterated multiple times to generate a list of common hits for SNIPE homologues lacking TMs, and a separate list of common hits for SNIPE homologues containing 1–2 TMs, which is shown in Supplementary Table 3.
To search for structural homologues of N-terminal regions of SNIPE homologues that lacked predicted TMs, AlphaFold2 was used to predict structures for this set of SNIPE homologues. Each predicted structure was manually examined for N-terminal regions that harboured globular domains. To identify structural homologues of these domains, FoldSeek was used to scan the PDB100 database (v. 20240101).
Reporting summary
Further information on research design is available in the Nature Portfolio Reporting Summary linked to this article.