
Gold (XAU/USD) sticks to its intraday gains through the first half of the European session and currently trades above the $4,700, close to a nearly two-week high touched earlier this Wednesday. President Donald Trump said on Tuesday that he expects the US to wrap up its military operation against Iran within two to three weeks and added that Tehran does not have to make a deal for him to end the war. The optimism, in turn, weighed on the US Dollar’s (USD) global reserve currency status and turned out to be a key factor acting as a tailwind for the commodity.
Meanwhile, the US deploys additional Marines to the Middle East to reinforce approximately 50,000 US troops already stationed across the region. This marks the largest American military buildup in two decades. Moreover, reports suggest that the United Arab Emirates (UAE) is pushing for military action to reopen the Strait of Hormuz, fueling worries about a broader regional conflict and acting as a tailwind for Crude Oil prices. This, in turn, keeps inflation concerns and Federal Reserve (Fed) rate hike bets in play, which could limit deeper USD losses and caps any further appreciation for the non-yielding Gold.
Trump will give an address to the nation on Wednesday night at 9 PM EDT (01:00 GMT on Thursday) to update the public on the Iran war. This, along with important US macro releases scheduled at the beginning of a new month, should provide some meaningful impetus to the XAU/USD pair. The US economic docket features the ADP report on private sector employment, the monthly Retail Sales, and the ISM Manufacturing PMI. Apart from this, speeches by influential FOMC members will play a key role in driving the USD demand and producing short-term trading opportunities around the Gold price.
The market attention will then shift to the closely-watched US Nonfarm Payrolls (NFP) report, due on Friday. However, the focus will remain glued to geopolitical developments, which should continue to infuse volatility into the financial markets and influence the Gold price dynamics.
XAU/USD daily chart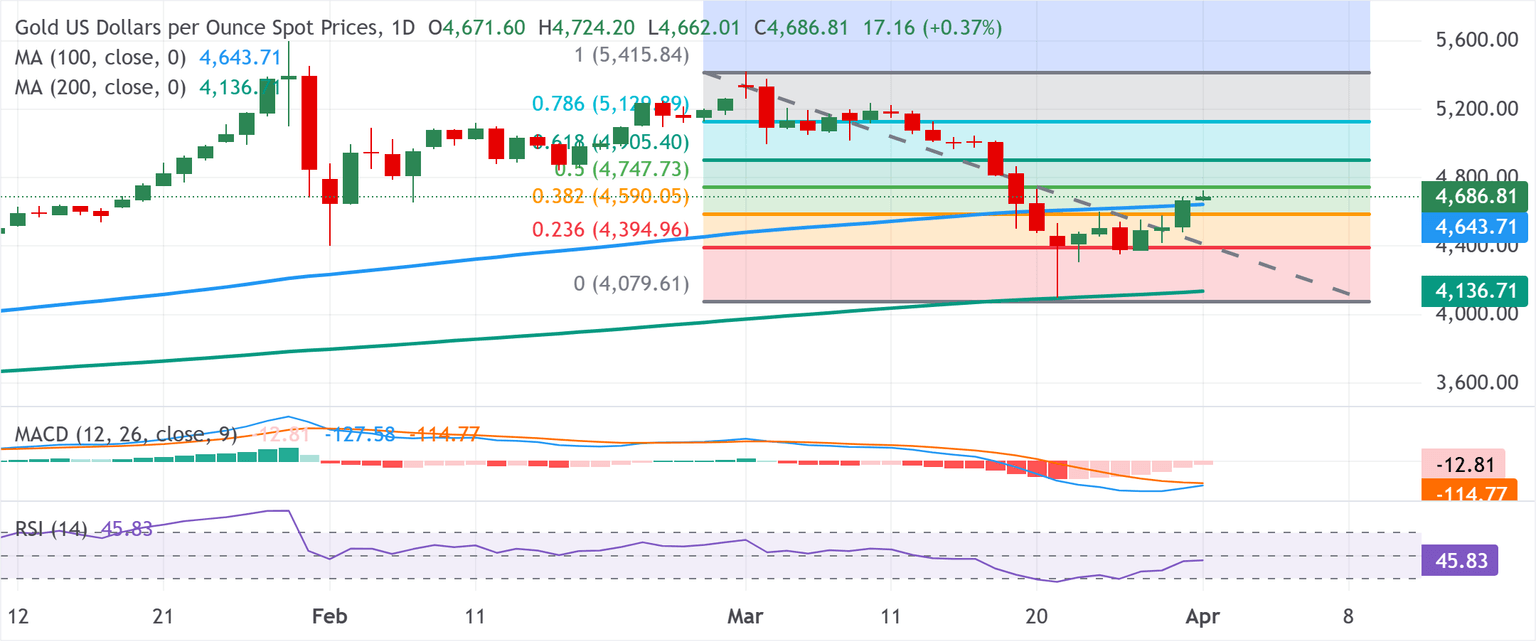 Gold needs to surpass 50% Fibo. hurdle to back the case for further gains
Against the backdrop of last week’s solid rebound from a technically significant 200-day Simple Moving Average (SMA), the overnight breakout through the 38.2% Fibonacci retracement level of the March downfall and the 100-day SMA favors the XAU/USD bulls.
The subsequent move up, however, stalls ahead of the 50% retracement level. Moreover, the Moving Average Convergence Divergence (MACD) line stays below its signal line and in negative territory, with the histogram extended to the downside, which reinforces prevailing selling pressure. Furthermore, the Relative Strength Index (RSI) hovers around 46 after recovering from oversold territory, hinting that bearish momentum is easing but not yet reversing.
Hence, it will be prudent to wait for some follow-through buying beyond the $4,745-$4,750 area (50% retracement level) before positioning for additional gains. In the meantime, the 38.2% retracement at $4,590.05 emerges as initial support ahead of the $4,500 psychological mark and the $4,400 round figure that aligns with the 23.6% Fibo. retracement. A convincing break below the latter would deepen the corrective phase and expose the 200-day SMA pivotal support near $4,136.72.
(The technical analysis of this story was written with the help of an AI tool.)
Inflation FAQs
Inflation measures the rise in the price of a representative basket of goods and services. Headline inflation is usually expressed as a percentage change on a month-on-month (MoM) and year-on-year (YoY) basis. Core inflation excludes more volatile elements such as food and fuel which can fluctuate because of geopolitical and seasonal factors. Core inflation is the figure economists focus on and is the level targeted by central banks, which are mandated to keep inflation at a manageable level, usually around 2%.
The Consumer Price Index (CPI) measures the change in prices of a basket of goods and services over a period of time. It is usually expressed as a percentage change on a month-on-month (MoM) and year-on-year (YoY) basis. Core CPI is the figure targeted by central banks as it excludes volatile food and fuel inputs. When Core CPI rises above 2% it usually results in higher interest rates and vice versa when it falls below 2%. Since higher interest rates are positive for a currency, higher inflation usually results in a stronger currency. The opposite is true when inflation falls.
Although it may seem counter-intuitive, high inflation in a country pushes up the value of its currency and vice versa for lower inflation. This is because the central bank will normally raise interest rates to combat the higher inflation, which attract more global capital inflows from investors looking for a lucrative place to park their money.
Formerly, Gold was the asset investors turned to in times of high inflation because it preserved its value, and whilst investors will often still buy Gold for its safe-haven properties in times of extreme market turmoil, this is not the case most of the time. This is because when inflation is high, central banks will put up interest rates to combat it.
Higher interest rates are negative for Gold because they increase the opportunity-cost of holding Gold vis-a-vis an interest-bearing asset or placing the money in a cash deposit account. On the flipside, lower inflation tends to be positive for Gold as it brings interest rates down, making the bright metal a more viable investment alternative.