

Find winning stocks in any market cycle. Join 7 million investors using Simply Wall St’s investing ideas for FREE.
Wondering whether Carnival Corporation & is offering good value at its recent price of US$27.85? This article walks through what that number could mean for you as an investor.
The stock has moved 8.6% over the last 7 days and 6.3% over the last 30 days, while year to date it shows a 9.9% decline and a 59.0% return over the last year, with a 186.4% return over 3 years and 2.4% over 5 years.
Recent coverage has focused on Carnival Corporation & as a major cruise operator that is included in ongoing discussions about leisure travel and consumer services companies, with investors paying close attention to sentiment around travel demand and balance sheet strength. These themes help frame how the recent share price moves may connect to the market’s shifting view of risk and potential reward for the stock.
Carnival Corporation & currently holds a valuation score of 6/6, and the rest of this article will compare different valuation approaches before finishing with a way to look at value that goes beyond any single model.
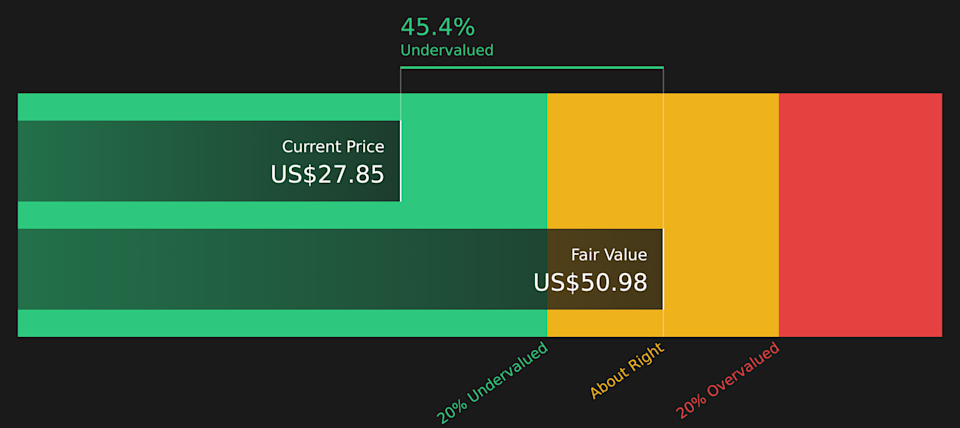
A Discounted Cash Flow model estimates what a company might be worth by projecting the cash it could generate in the future and then discounting those cash flows back to today.
For Carnival Corporation &, the model used is a 2 Stage Free Cash Flow to Equity approach based on cash flow projections. The latest twelve month Free Cash Flow is about US$2.60b. Analyst and extrapolated estimates suggest Free Cash Flow reaching around US$6.78b in 2035, with ten year projections stepping up through the late 2020s and early 2030s. Simply Wall St uses analyst inputs where available and then extends the series to build a full picture of potential future cash flows.
Discounting those projected cash flows back to today results in an estimated intrinsic value of US$50.98 per share. Compared with the recent share price of US$27.85, the model implies a 45.4% discount, which points to the shares trading below this estimate of underlying value.
Result: UNDERVALUED
Our Discounted Cash Flow (DCF) analysis suggests Carnival Corporation & is undervalued by 45.4%. Track this in your watchlist or portfolio, or discover 62 more high quality undervalued stocks.
 CCL Discounted Cash Flow as at Apr 2026
Story Continues
For a profitable company, the P/E ratio is a useful way to relate what you pay for each share to the earnings that share currently generates. It helps you see how much the market is willing to pay for each dollar of earnings, which is a simple anchor for comparing companies.
What counts as a “normal” P/E depends on how the market views growth potential and risk. Higher expected growth or lower perceived risk often come with a higher P/E, while slower growth or higher risk tend to be associated with a lower P/E.
Carnival Corporation & currently trades on a P/E of about 12.46x. That sits below the Hospitality industry average of about 21.70x and below the peer group average of around 20.33x. Simply Wall St also calculates a “Fair Ratio” of 25.03x, which is an estimate of the P/E that might fit the company given its earnings growth profile, margins, risks, size and industry.
This Fair Ratio can be more informative than a straight comparison with peers or the industry because it attempts to adjust for company specific features rather than assuming all Hospitality stocks deserve similar multiples. Compared with the current P/E of 12.46x, the Fair Ratio of 25.03x points to the shares trading at a discount on this metric.
Result: UNDERVALUED
 NYSE:CCL P/E Ratio as at Apr 2026
P/E ratios tell one story, but what if the real opportunity lies elsewhere? Start investing in legacies, not executives. Discover our 19 top founder-led companies.
Earlier it was mentioned that there is an even better way to understand valuation. Narratives bring your view of Carnival Corporation & together in one place by linking the story you believe, the forecast you think is reasonable and the Fair Value that drops out of those assumptions. All of this is available within an easy tool on Simply Wall St’s Community page that lets you compare that Fair Value with the current share price, see how other investors frame the same stock, and watch those views update automatically as new earnings or news arrive. For Carnival Corporation & you might, for example, align with a more optimistic Narrative that ties a Fair Value around US$44.61 to assumptions about earnings reaching about US$4.3b by 2029 on a P/E of 20.6x. Alternatively, you might lean toward a more cautious Narrative closer to US$24.61 that assumes earnings of roughly US$3.6b by 2028 on a P/E of 12.3x. The gap between those stories helps you decide whether you think the current price is high, low, or about right for your own approach.
Do you think there’s more to the story for Carnival Corporation &? Head over to our Community to see what others are saying!
NYSE:CCL 1-Year Stock Price Chart
This article by Simply Wall St is general in nature. We provide commentary based on historical data and analyst forecasts only using an unbiased methodology and our articles are not intended to be financial advice. It does not constitute a recommendation to buy or sell any stock, and does not take account of your objectives, or your financial situation. We aim to bring you long-term focused analysis driven by fundamental data. Note that our analysis may not factor in the latest price-sensitive company announcements or qualitative material. Simply Wall St has no position in any stocks mentioned.
Companies discussed in this article include CCL.
Have feedback on this article? Concerned about the content? Get in touch with us directly. Alternatively, email editorial-team@simplywallst.com