

Get insights on thousands of stocks from the global community of over 7 million individual investors at Simply Wall St.
Wondering if Royal Caribbean Cruises at around US$275.89 is still offering value, or if most of the opportunity is already priced in.
The stock has moved 0.8% over the last 7 days, with a 3.2% decline over the past month, a 2.6% decline year to date and a 45.4% return over the last year, plus a very large 3 year gain that points to a major re rating by the market.
Recent headlines have focused on the cruise sector’s recovery and renewed consumer demand for travel, putting Royal Caribbean Cruises back on many investors’ watchlists. Coverage has also highlighted how higher ticket pricing and on board spending trends could influence expectations around the company’s long term earnings profile.
Simply Wall St gives Royal Caribbean Cruises a valuation score of 5 out of 6, and the next sections will break that into concrete valuation methods before finishing with a more complete way to think about what the stock might be worth.
A Discounted Cash Flow, or DCF, model estimates what a business could be worth today by projecting its future cash flows and then discounting those back to a present value.
For Royal Caribbean Cruises, the latest twelve month Free Cash Flow is about $1.86b. Analysts and model estimates project Free Cash Flow reaching $6.47b in 2030, with a 2 Stage Free Cash Flow to Equity model extending those forecasts out to 2035. Simply Wall St uses analyst inputs for the earlier years, and then extrapolates later years based on the model’s assumptions.
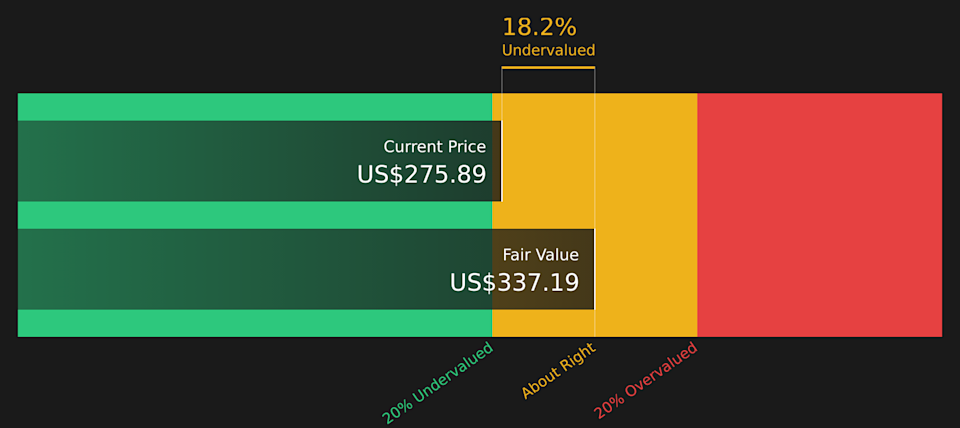
Pulling all of those projected cash flows together, the DCF model arrives at an estimated intrinsic value of about $337.19 per share. Compared with the recent share price of roughly $275.89, this implies the stock is about 18.2% undervalued on these cash flow assumptions.
This kind of discount suggests the market price may not fully reflect the cash flow profile implied by the model.
Result: UNDERVALUED
Our Discounted Cash Flow (DCF) analysis suggests Royal Caribbean Cruises is undervalued by 18.2%. Track this in your watchlist or portfolio, or discover 62 more high quality undervalued stocks.
 RCL Discounted Cash Flow as at Apr 2026
P/E is a common way to value profitable companies because it ties what you are paying directly to the earnings the business is generating today. In general, higher expected growth and lower perceived risk can justify a higher “normal” P/E ratio, while slower growth or higher risk often go with a lower multiple.
Story Continues
Royal Caribbean Cruises is currently trading on a P/E of 17.49x. That sits below the Hospitality industry average of 21.52x and well below the peer group average of 35.83x. Simply comparing those numbers can be tempting, but it does not fully capture the company’s specific growth outlook, profitability, size and risk profile.
To address that, Simply Wall St uses a proprietary “Fair Ratio” for Royal Caribbean Cruises of 28.91x. This is designed to reflect the P/E level that might be appropriate given factors such as earnings growth, profit margins, industry, market cap and company specific risks, rather than just broad sector or peer comparisons. Compared with this 28.91x Fair Ratio, the current 17.49x P/E suggests the shares are trading below that modelled range.
Result: UNDERVALUED
 NYSE:RCL P/E Ratio as at Apr 2026
P/E ratios tell one story, but what if the real opportunity lies elsewhere? Start investing in legacies, not executives. Discover our 19 top founder-led companies.
Earlier it was mentioned that there is an even better way to understand valuation. Narratives on Simply Wall St let you connect your view of Royal Caribbean Cruises to the numbers by tying a story about the business to specific assumptions for future revenue, earnings, margins and a Fair Value. This view is then continuously updated when new news or earnings arrive, so you can compare Fair Value with the current price and decide whether the stock looks attractive, fully priced or expensive based on your own stance. For example, you might align with a more optimistic community Narrative that sets Fair Value around US$425.00, or a more cautious one closer to US$268.56, or sit near the middle around US$351.65. All of these are visible and easy to work with on the company’s Community page used by millions of investors.
Do you think there’s more to the story for Royal Caribbean Cruises? Head over to our Community to see what others are saying!
NYSE:RCL 1-Year Stock Price Chart
This article by Simply Wall St is general in nature. We provide commentary based on historical data and analyst forecasts only using an unbiased methodology and our articles are not intended to be financial advice. It does not constitute a recommendation to buy or sell any stock, and does not take account of your objectives, or your financial situation. We aim to bring you long-term focused analysis driven by fundamental data. Note that our analysis may not factor in the latest price-sensitive company announcements or qualitative material. Simply Wall St has no position in any stocks mentioned.
Companies discussed in this article include RCL.
Have feedback on this article? Concerned about the content? Get in touch with us directly. Alternatively, email editorial-team@simplywallst.com