
Study design and population
The UK Biobank is a multicenter prospective cohort study comprising over half a million volunteers from the United Kingdom (specifically: Wales, Scotland, and England) who were aged 40 to 69 years at the time of recruitment. The main study methods have been reported elsewhere [22, 23]. In brief, potential participants were identified from National Health Service patient registers, and enrollment took place between 2006 and 2010 in twenty-two assessment centers. At baseline, participants completed a touch-screen questionnaire (socio-demographic characteristics, diet, lifestyle, etc.), a computer-assisted interview, and also underwent a physical examination and provided biological samples under standardized procedures. Lastly, from 2009 to 2012, 210,842 participants also completed up to five online 24 h-dietary assessments using the validated Oxford WebQ questionnaire to obtain detailed information about actual food consumption [24, 25]. These assessments were repeated every 3 to 4 months from 2009 to 2012 (cycle 0: April 2009 to September 2010; cycle 1: February 2011 to April 2011; cycle 2: June 2011 to September 2011; cycle 3: October 2011 to December 2011; cycle 4: April 2012 to June 2012). We used the date of last diet questionnaire as baseline for this analysis as diet is the main exposure.
The study was approved by the Northwest Multi-Centre Research Ethics Committee (REC reference 11/NW/0382) in 2011 and renewed in 2016 (16/NW/0274) and 2021 (21/NW/0157). Study participants provided written informed consent before enrolment.
Study variablesPlanetary Health Diet Index
To better reflect participants’ usual dietary habits, we only included individuals with a minimum of two 24-h dietary assessments (126,744), where mean values were used for the analyses. Among these participants, 48,090 had undertaken two dietary assessments, 42,452 three, 30,442 four, and 5760 five assessments. Food group consumption, nutrient and total energy intake estimation have been documented elsewhere [26].
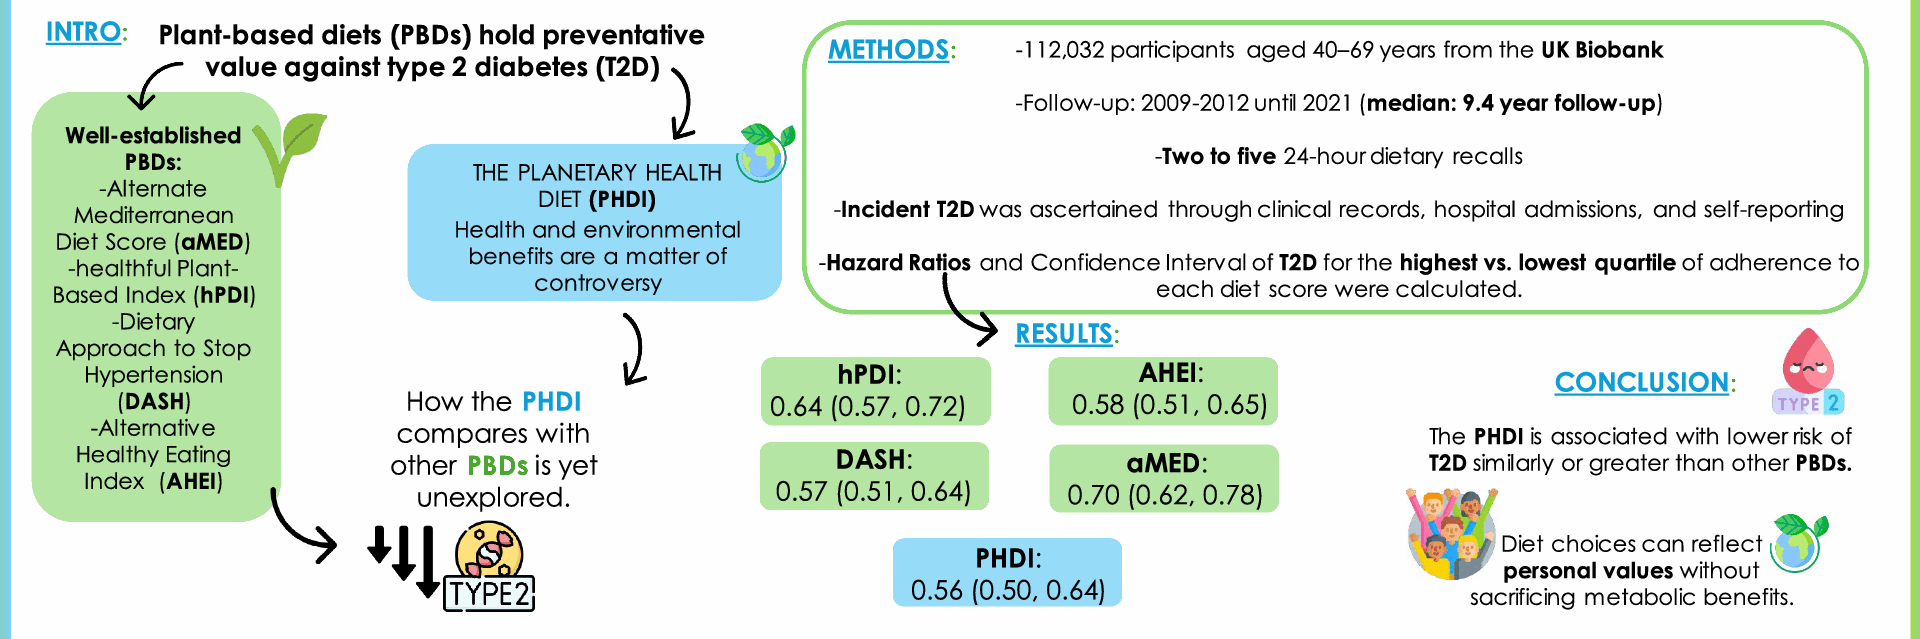
Adherence to the Planetary Health Diet, reflecting compliance with the EAT-Lancet’s dietary recommendations report, was estimated using the PHDI defined by Bui et al. [9]. The original PHDI is based on 15 food groups, although because the UK Biobank does not collect data on vegetable oil intake, we could only account for 14 food groups. A range of possible intakes with a specific target for each food group was given to allow exchanges within total energy intake, which could adapt to local availability of foods, body weight, personal preferences, etc. Based on the health effect of each food group, the threshold for minimum and maximum score is adjusted accordingly. In this context, the minimum score assigned to each food group was 0, reflecting the level of consumption associated with the most unfavorable health impact. In contrast, the maximum score assigned for each food group was 10 (except for non-soy legumes and soy foods, which was 5), and was centered on the maximum daily intake, reflecting the most beneficial consumption level of that group. Intermediate scores were assigned proportionally to consumption levels [9]. The final PHDI ranged from 0 to 130 points (reflecting the highest adherence to the PHDI) (Supplementary Table S1).
Other plant-based indexes were calculated in this cohort as in previous studies [27]. Adherence to the aMED was estimated following the criteria established by Fung et al. [19], based on the initially developed Mediterranean diet scale of Trichopoulou et al. [28]. Intake of each food item (vegetables, legumes, fruit and nuts, dairy, cereals, meat and meat products, fish, alcohol, and the ratio of monounsaturated to saturated fat) above the median of the study participants received 1 point, while all other intakes received 0 points. In the case of meat and dairy foods, consumption below the median received 1 point. The final score ranged from 0 to 9 points (Supplementary Table S2). Adherence to the hPDI was calculated as developed by Satija et al. [4]. This score is based on 18 food groups, but we included only 17 because the UK Biobank does not collect data on vegetable oil intake. The food groups were ranked into quintiles and given positive (in the case of healthy plant-based foods) or reverse (animal-derived food groups and less healthy plant-based foods) scores. The final score ranged from 27 to 84 points (Supplementary Table S3). The DASH was calculated as established by the United States Department of Health and Human Services [20], and focuses on 8 components: high intake of fruits, vegetables, nuts and legumes, low-fat dairy products, and whole grains and low intake of sodium, sweetened beverages, and red and processed meats. Each food group was classified into quintiles and was scored as such (quintile 1 is assigned 1 point and quintile 5, 5 points), except for red and processed meats, and sugar sweetened beverages and sodium, where a low intake received the highest score (5 points). The final score ranged from 8 to 40 points (Supplementary Table S4). Lastly, adherence to the AHEI-2010 was calculated as defined by Chiuve et al. [21], and considers foods (vegetables, fruits, whole grains, sugar-sweetened beverages and fruits juices, nuts and legumes, red and processed meats and alcohol) and nutrients (trans fat, long chain (n-3), polyunsaturated fatty acids, and sodium) that have been associated with lower risk of chronic diseases in clinical and epidemiologic investigations [29]. As in previous studies, for the omega (ω)-3 fatty acids EPA + DHA group, we used seafood because we only had information about total (ω)-3 [27]. The final score ranged from 5 to 100 points (Supplementary Table S5). Higher scores reflect stronger adherence to the corresponding dietary patterns (Supplementary Table S6).
Type 2 diabetes
Incident type 2 diabetes diagnosis was defined as the first recorded diagnosis of non-insulin dependent diabetes mellitus (ICD-10 code E11). Diagnoses were identified through self-reported information, death records, hospital inpatient records and primary care reports. Hospital admissions and primary care data accounted for 94% of all diagnosed incident type 2 diabetes cases. Data was used up to October 15th, 2021, for participants in England, up to November 9th, 2021, for participants in Scotland, and up to October 12th, 2021, for those in Wales. Date of death was assigned as a censoring date for participants who died. Length of follow-up was estimated as time from the last dietary assessment (2009–2012) to the date of the first type 2 diabetes-related hospital admissions, death, or end of follow-up, whichever came first.
Other variables
Based on current literature, we considered variables that had been consistently identified in prior studies (large-scale prospective cohort studies, systematic reviews, and meta-analyses) as potential confounders (associated with both diet and diabetes) or modifiers of the diet-type 2 diabetes relationship [14, 30, 31]. Specifically, sociodemographic variables, including age, sex, ethnicity (white or non-white), educational level (university or non-university education), and socio-economic status (Townsend deprivation index). Regarding lifestyle variables, data on energy intake (kcal/day), alcohol consumption (non-drinker, moderate drinker ( ≤ 14 units of alcohol/week), heavy drinker ( > 14 units of alcohol/week)) [32], smoking status (never, previous, current), dietary supplement intake (yes/no), physical activity (metabolic equivalent of task in minutes per week (METs*min/week)), as well as body mass index (BMI) calculated at baseline as weight (kg) divided by squared height squared (m2), were also accounted for. In addition, we considered baseline self-reported family history of diabetes, hypertension (HTN) (defined as use of hypertensives or having an HTN diagnosis by self-report or linkage to clinical records using ICD-10 codification), and use of cholesterol-lowering medications. Data on prevalent diabetes status (type 1, type 2, gestational or unclassified) and date of diagnosis at baseline, as well as prevalent cardiovascular disease (ischemic heart disease or stroke) were obtained from self-reports or clinical records using ICD10 coding.
Statistical analyses
From the initial 126,744 participants with at least two dietary assessments and plausible energy intakes ( ≥ 800 and ≤ 5000 kcal/day for men; ≥ 500 and ≤ 4000 kcal/day for women) [33], we excluded those lacking data on the PHDI index and its components (n = 60), sociodemographic variables (n = 883), smoking status (n = 197), alcohol intake (n=56), BMI (n = 256), physical activity (n=151) , vitamin/supplement use (n=217), cholesterol medication (n = 9), diabetes or cardiovascular disease (n = 3256) and family history of diabetes (n = 1765). Participants with prevalent diabetes (n = 1884) or cardiovascular disease (n = 6062) were also excluded from the analyses. Thus, the final analytical sample comprised 112,032 individuals (Supplementary Figure S1). Participants’ baseline main characteristics were summarized with the mean and standard deviation for continuous variables, and percentages for categorical ones, by quartiles of adherence to the PHDI.
To evaluate the association between the PHDI and incident type 2 diabetes, we used multivariable Cox proportional hazards regression models, using age as underlying timescale, to estimate hazard ratios (HRs) and their corresponding 95% confidence intervals (CI). The PHDI was categorized into quartiles so that the number of participants in each group was similar (1/4 of the study population in each group) and to better represent data distribution. The lowest quartile (representing the lowest PHDI adherence) was used as reference. Four progressively adjusted models were fitted: Model 1, adjusted for sociodemographic variables (sex, ethnicity, educational level, and deprivation index) and region of assessment center; Model 2, further adjusted for lifestyle variables at baseline (total energy intake, alcohol intake, smoking status, vitamin supplement use and physical activity); Model 3 further adjusted for health conditions: HTN, cholesterol-lowering medication, and family history of diabetes at baseline; and Model 4 (main analysis model), further adjusted for BMI, to evaluate its potential mediation role in the association between the PHDI and type 2 diabetes. We considered the latter as the fully adjusted and main analysis model of this study, as BMI is a strong independent, and dose-dependent risk factor for type 2 diabetes [34]. Indeed, not adjusting for BMI could overestimate the association, while adjusting for it provides a more conservative and, perhaps clinically informative, estimate because it accounts for both confounding and the potential mediation of BMI.
Dose–response relationships were analyzed by evaluating the association per 20-point increment of the PHDI, with p-values for linear trend, and using restricted cubic splines with 3 knots set at the 10th, 50th and 90th percentiles (62.9, 80.8 and 97.7 points, respectively) and adjusted as in Model 4.
We conducted several secondary analyses. We evaluated the association between the aMED, hPDI, DASH and AHEI-2010 and incident type 2 diabetes by quartiles of adherence. The same Cox-proportional-hazard regression models employed in the main analyses were used. Also, we evaluated the association between each item of the PHDI (per 2-point increment) and type 2 diabetes, as in Model 4, also calculating the PHDI score minus the item being evaluated, to assess whether a specific food component was driving the main association. To examine the potential effect modification of other variables, we conducted stratified analysis and assessed potential interactions defined as the product of the PHDI by such variables. Particularly, for sex, BMI ( < 25, 25–29.9, ≥ 30 kg/m2), deprivation index (at or below the median, above the median), education (university or non-university), smoking status (never, former and current), alcohol intake (abstinent, moderate drinker, and heavy drinker), vitamin and mineral use, physical activity (at or below the median, above the median), history of diabetes, HTN, and cholesterol-lowering medication, as potential modifiers.
Lastly, in sensitivity analyses we repeated the main analyses: (1) including participants with CVD at recruitment (n = 117,709); (2) only including participants with at least three dietary assessments (n = 69,783); (3) after excluding participants who developed type 2 diabetes during the initial two years of follow-up to mitigate potential reverse causality (n = 111,728); (4) Due to limited information on unsaturated oils, the added fat component of the PHDI was estimated using the ratio of total unsaturated to saturated fats, aligned with the reference diet. This was achieved as proposed in the article by Knuppel et al. (where compliance with this item meant a ratio of 0.8 for unsaturated: saturated fat intake) [35].
The proportional hazards assumption was tested by visually inspecting plots of the survival probability by PHDI quartiles (which were rather parallel, providing no apparent evidence of violation of the assumption) and with the Schoenfeld residuals method (p < 0.001). We should note, however, that statistical tests for proportional hazards may not be necessary, as the hazard ratios are expected to vary over long follow-up periods [36].
Analyses were conducted using Stata version 17 (Stata-Corp LLC, College Station, Texas). All p-values were two-sided, and statistical significance was set at p < 0.05.