
Ethics statement
This study was conducted in compliance with the relevant ethical guidelines and approved by the appropriate ethics committees. Details of the ethics committees of each participating biobank are provided in the Acknowledgements.
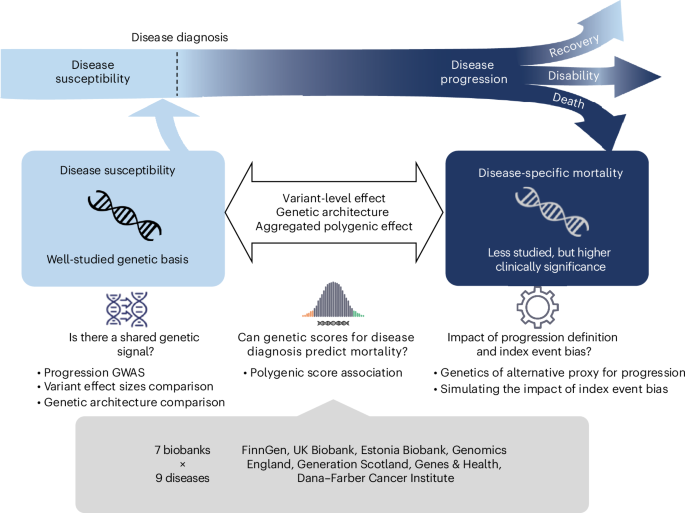
Selection of diseases
We selected nine common complex diseases spanning various disease categories for the analyses. The diseases are selected to meet following criteria: (1) have high epidemiological HR on mortality, so that mortality can be viewed as a reasonable prognosis; (2) constitute high global disease burden in terms of disability adjusted life years44; (3) be relatively common ( > 1% prevalence) in population and have reasonable patient bodies in all biobanks and (4) be heritable and have large-scale GWAS available to construct PGSs. All disease endpoints were defined as a composition of ICD-10 codes curated by the clinical expert groups from FinnGen, Institute for Molecular Medicine Finland and Finnish Institute for Health and Welfare19. The same disease definitions, in terms of ICD-10 codes, were adopted by all participating biobanks to the maximum possible extent. See Supplementary Table 2 for a list of diseases and relevant descriptive statistics.
Progression definition
For all selected diseases, we defined mortality as our outcome. Precisely, we were interested in both all-cause mortalities, namely simple death status of the patient regardless of relevance to the disease, and disease-specific mortalities, meaning the death caused directly or indirectly by disease of interest specifically. Disease progression was evaluated as patients’ survival from each type of mortality after being diagnosed with the disease. For all mortality GWASs, we consider only disease-specific mortality whenever possible for each participating biobank, whereas for the PGS analysis, both all-cause and disease-specific mortalities were evaluated. Similar to the disease endpoints, cause of death linked to each disease was also curated by clinical expert groups and defined in terms of ICD-10 codes45. The same definitions were systematically applied to all biobanks to the possible extent. See Supplementary Table 2 for definitions of cause-specific mortality for each disease of interest and available sample sizes from each biobank.
Within-patient mortality GWAS
To achieve variant-level effect comparison, a within-patient mortality GWAS was carried out for each selected disease using GATE26 for all biobanks, except Generation Scotland, which used SPACox27 as an alternative. The event of interest in this GWAS was patients’ survival after disease diagnosis. For each disease of interest, GWAS was carried out separately within each ancestry group for biobanks that have a cause-specific mortality event count of 50 at minimum after quality control. Eligible individuals were restricted to patients having a follow-up time after diagnosis of three months (0.25 years) at minimum. We used the model below to examine SNP association with patients’ survival:
surv(duration of follow-up after diagnosis | disease-specific mortality) ~ SNP + patient’s age of diagnosis + patient’s birth year + sex + PCs + study-specific covariates,
where study-specific covariates included other available nonheritable biobank-specific covariates, such as genotyping chip or batch.
For analyses in the UK Biobank, to minimize potential impact of survivor bias, only patients with disease diagnosed after enrollment were considered.
Results quality control and meta-analysis
After conducting mortality GWAS for selected diseases within each contributing biobank, we then filtered the resulting summary statistics by imputation INFO scores and minor allele counts. We retained only variants with an imputation INFO score >0.7 and at least 20 minor allele counts for each summary statistic. For GWAS summary statistics with a different human genome build, we used the UCSC LiftOver tool46 to convert their genome coordinates into the hg38 assembly. Subsequently, for each disease, we meta-analyzed GWAS results from each biobank using fixed-effect meta-analysis implemented in METAL47, with which we also scanned for heterogeneity in effect sizes across different biobanks using Cochran’s Q test. We applied an inverse-variance weighted meta-analysis scheme whenever possible. However, since SPACox does not have effect size or s.e. output, in Generation Scotland, we estimated direction of effect under a logistic regression model using PLINK48 and subsequently proceeded with a sample-size weighted meta-analysis using the Z-scores. This was done for four of the nine diseases for which Generation Scotland was one of the data sources: atrial fibrillation, breast cancer, coronary artery disease and type 2 diabetes.
Variant-level effect size comparison
We compared our mortality GWAS results for each disease of interest with large-scale published GWAS on diagnosis of the same disease. For disease diagnosis GWAS, we extracted SNP effects of reported genome-wide significant leading SNPs at independently associated loci from each study. For chronic kidney disease, a large GWAS on estimated glomerular filtration rate was considered34. Specifically, we examined the effect sizes of independent lead SNPs on the binary diagnosis of chronic kidney disease reported in the study, ensuring a more comparable scale of measurement. For our meta-analyzed mortality GWAS, we identify independent genome-wide loci using summary statistics based on conditional analysis implemented in GCTA-COJO. We merged 5,000 Finnish genomes, which is one of the largest GWAS cohorts in this study, with EUR from Human Genome Diversity Project as linkage disequilibrium (LD) reference for this step. To carry out the effect size comparison for all diseases, we reran the meta-analysis of mortality GWAS, excluding results from Generation Scotland due to the use of an incomparable GWAS approach for the cohort.
Comparison of genetic architectures
We compared genetic architectures between disease diagnosis and mortality in terms of SNP heritability estimated from the meta-analyzed mortality GWAS summary statistics using LD score regression49. For eligible traits, that is, traits with nonzero estimated SNP heritability, we further analyzed genetic correlation across disease diagnosis, mortality, and general longevity GWAS using the same tool.
Down-sampled GWAS on age of diagnosis
To ensure heritability comparison between disease susceptibility and progression endpoints not being subject to power issues resulting from difference in sample sizes and GWAS models, for each disease of interest, we also ran time-to-event GWAS to find SNP association with age of diagnosis using a randomly down-sampled cohort which had comparable number of total individuals and event counts as what was available for the within-patient mortality GWAS. The down-sampled GWAS was carried out under the model below:
surv(follow-up from birth until diagnosis | disease diagnosis) ~ SNP + patient’s birth year + sex + PCs + study-specific covariates.
This analysis was also carried out using GATE26 but in FinnGen and UK Biobank only, which are two of the largest participating biobanks in this study (see Supplementary Table 2 for sample sizes).
Computation of individual-level PGS
For each selected disease, we derived variant weights for PGSs from GWAS summary statistics listed in Supplementary Table 2 using MegaPRS50. Heritability contributed by each variant was estimated under the BLD-LDAK model as recommended. For weight estimation, we used the ‘mega’ option, which allows the software to determine the most appropriate model based on the data. Since we studied mortality, apart from the nine selected diseases, we also computed PGS weights for general longevity using the largest GWAS on lifespan29. Due to the heterogeneous and polygenic nature of lifespan, we used the LDAK-Thin model for SNP-level heritability estimation for this trait instead. Unlike the BLD-LDAK model used in variant weighting for other diseases, LDAK-Thin model does not take functional annotations into account but estimates SNP heritability only as function of SNP allele frequencies and local linkage structures. Variant weights were derived for 1,330,820 common SNPs (minor allele frequency > 0.1) lying in the intersection of HapMap3 (ref. 51) and 1000 Genomes52 that are available for each GWAS summary statistic.
Once the SNP weights were derived, individual-level PGSs for each disease and general longevity were subsequently computed as a weighted sum of effect allele counts using PLINK48. Scores were standardized to have 0 mean and 1 as variance within each ancestry group.
For the composite mortality PGS, we used sex-stratified SNP weights developed by ref. 30. Scores for males and females were computed separately and subsequently combined during the association step to obtain a population effect estimate.
Association between PGS and disease of interest
As a baseline, we first examined whether the disease PGSs were associated with their diagnoses. For each selected disease, the association was first tested using a general linear model on case–control status as below:
logit(Pr(Individual is diagnosed)) ~ disease PGS + birth year + sex + PC1-10.
To achieve a fairer comparison with the other experiments, we also evaluated such relationship using a survival model on the age of diagnosis as below:
surv(follow-up from birth until diagnosis | disease diagnosis) ~ disease PGS + birth year + sex + PC1-10.
The two analyses above were conducted using all eligible individuals from the biobanks. Then, for each selected disease, we extracted only the patient group for further analysis. To reduce noise in measurements, we limited these within-patient analyses to individuals having a follow-up time of at least three months (0.25 years) after the diagnosis. We tested the association of disease PGSs with our defined prognosis, namely patient survival, using the model below:
surv(duration of follow-up after diagnosis | mortality) ~ disease PGS + birth year + sex + PC1-10 + age of diagnosis,
as well as the association of general longevity PGS with patient survival as below:
surv(duration of follow-up after diagnosis | mortality) ~ general longevity PGS + birth year + sex + PC1-10 + age of diagnosis.
For both associations, we examined both all-cause mortality and cause-specific mortality within the patient group. All analyses were corrected for sex, except in analyses for breast cancer and prostate cancer, where only female/male individuals were used.
These analyses were carried out independently for each ancestry group within each participating biobank. We only included biobanks where the count of events of interest in the analyzed ancestry group was 50 or more. We subsequently meta-analyzed effect sizes for the same ancestry group across biobanks using the inverse-variance weighted approach.
Mortality PGSs and their performance in FinnGen
For diseases with sufficient power, we derived mortality PGS weights using meta-analyzed mortality GWAS results of European populations from all available biobanks, except for FinnGen or Generation Scotland. Apart from FinnGen, which was used as a test cohort, we also left out results from Generation Scotland for this analysis because their summary statistics did not have effect size or s.e. and therefore cannot be used for inverse-variance weighted meta-analysis, which returns necessary statistics for weight derivation. After deriving PGS weights using MegaPRS50, we subsequently computed individual-level disease-mortality PGS for patients of each corresponding disease within FinnGen cohort. The weights and scores are computed in the same manner as mentioned in the ‘Computation of individual-level PGS’. We evaluated the effects of these scores on predicting patients’ disease mortality in FinnGen using the model below:
surv(duration of follow-up after diagnosis | mortality) ~ disease-mortality PGS + birth year + sex + PC1-10 + age of diagnosis
Sensitivity analyses for PGS experiments
We ran a series of sensitivity analyses in eligible biobanks to ensure our observations on the PGSs association were robust, under considerations listed below. Similarly, analyses were conducted for each eligible ancestry within each biobank and then meta-analyzed.
First, to demonstrate the impact of relevance between disease progression and susceptibility as shown in our theories, we examined the association between susceptibility PGS and all-cause mortality and compared the results with disease-specific mortality in FinnGen (see Supplementary Fig. 10 for these results). We then considered other factors that may bias the results.
Survivor bias
Depending on each biobank’s recruitment scheme, some patients were diagnosed before the start of their follow-up, which may lead to biased results due to the survivor effect. Therefore, we also ran these analyses for each disease using only samples from individuals enrolled before their first onset of the disease of interest (see Supplementary Fig. 11a for these results).
Relevance between cause of mortality in death certificate and disease diagnosis
In this study, we aimed to define disease progression as accurately as possible by focusing our analysis on disease-caused mortality. However, some national death registries may not precisely capture the immediate cause of death, and some mortalities, while documented with the disease as one of the causes, may not be truly relevant to the diagnosed disease. To address this concern, we ran the same analysis using only patients with a restricted maximum follow-up length, since death taking place reasonably soon after being diagnosed might have more to do with the diagnosis, compared to death taking place decades after. Under this consideration, we varied the maximum duration of follow-up after diagnosis by 2, 5 or 10 years. The minimum is still 0.25 years for this analysis (see Supplementary Fig. 11b and Supplementary Table 8 for these results; see also Supplementary Table 2 for sample size breakdown by duration of follow-up in each biobank). To facilitate comparability between results, we reported the regression coefficients for PGS effect sizes on nine diseases for each sensitivity analysis and the main results.
The effect of diagnosed age
As shown above, we included the age of diagnosis as one of the covariates in all within-patient main analysis models to specifically investigate PGSs’ unique genetic effect on disease progression by correcting for the diagnosis. As part of our sensitivity analysis, we also examined the role of these diagnosed ages in more detail. We repeated all the within-patient analyses for each disease by stratifying patients into early onset and late onset groups using 50% age of diagnosis quantile as a cutoff and compared the PGS effects across the two groups (see Supplementary Fig. 12 and Supplementary Table 9 for these results).
Sample relatedness
We included all eligible individuals of each biobank in our main analysis, and one may argue that this could impact our effect size estimates. Therefore, we ran the same analysis in FinnGen with up to second-degree relatives removed (see Supplementary Fig. 13 and Supplementary Table 7 for these results).
Results from non-European ancestry populations
Since only patients were considered for most of our analyses, although some of the biobanks (for example, UK Biobank and BioMe) were known to be rather diverse, we ended up with enough power for the main results only for the European super-population. Nevertheless, comparison of results with other less powered but available populations can be found in Supplementary Fig. 15 for reference.
Forest plot for effects from each biobank is presented in Supplementary Fig. 14.
Alternative progression definitions for type 2 diabetes
For type 2 diabetes, we explored the genetics of two additional widely considered progressions—macrovascular and microvascular complications. For macrovascular complications, we only consider patients who did not have any coronary artery disease, stroke or peripheral arterial disease incidents before the onset of type 2 diabetes. Among those, we define the ones having at least one of the aforementioned diagnoses after type 2 diabetes as cases for macrovascular complications. Event time is defined as the duration from a patient’s diagnosis of type 2 diabetes to the earliest diagnosis of a macrovascular complication. Similarly, for microvascular complications, we consider onset of diabetic retinopathy, nephropathy and neuropathy after the patients’ diagnosis of type 2 diabetes. For both definitions of progression, our analysis only included individuals with >0.25 year of follow-up, meaning the patients’ death/onset of progression/biobank censoring take place >0.25 year after their diagnosis of type 2 diabetes.
For macrovascular complications, for which we identified genome-wide significant signals among diabetic patients, we further carried out a down-sampled time-to-event GWAS on population-comparable phenotypes, matching the case–control count in the progression GWAS. For this down-sampled GWAS, we considered onset of coronary artery disease, stroke, or peripheral arterial disease in nondiabetic population.
Simulation to explore the impact of index event bias
Please see section ‘Simulation to explore the impact of index event bias’ from Supplementary Note for details.
Reporting summary
Further information on research design is available in the Nature Portfolio Reporting Summary linked to this article.