
Spot gold traded around $4,000 an ounce, down about 8% in 2026 and 24% from its record high after giving back part of 2025’s 66% rally.US PCE inflation rose 4.1% in May, the first reading above 4.0% since April 2023, reinforcing expectations of a hawkish Fed under Chair Kevin Warsh and weakening the trade that had supported gold.Macquarie cut its year-end gold target to $4,300 from $4,400 and forecasts a $4,200 average price by 2027, while nearly 90% of central banks plan to increase their gold reserves.Markets assign a 40% chance of a rate hike next month and an 80% chance by December, making short-term positioning in gold difficult.Gold is likely to remain below $4,000 unless real yields fall, ETF selling slows, or the Fed adopts a less hawkish stance.Inflation Data Drives Gold Below $4,000 as Fed Rate Expectations Reset
Gold traded around the $4,000 level. Spot gold briefly gained before falling as European trading began, while New York futures also traded lower near $4,000. Gold rebounded after the US PCE inflation report, lifting spot prices 0.7% above $4,000 and August futures 0.9%.
The rebound does not change gold’s broader downtrend. Gold has fallen 24% from its record high and about 8% in 2026, giving back part of its 66% gain in 2025. Gold prices are now driven more by inflation data and Fed rate expectations than by geopolitical safe-haven demand.
Inflation & Fed Hawkish Repricing Break Gold’s Debasement Trade
Persistently higher inflation, marked by May’s 4.1% PCE reading, forced a re-rating of Fed policy expectations even as energy prices fell, which resulted in a more hawkish Fed stance under new Chair Kevin Warsh and weakened the debasement trade that drove gold’s 2025 rally.
Geopolitical risk no longer supports gold’s safe-haven demand. Gold’s safe-haven demand weakened after the US-Iran conflict began in February, and a subsequent accord that restored Strait of Hormuz shipping and returned oil prices to pre-war levels removed its geopolitical premium. With both supports removed, gold is now more sensitive to real yields, meaning inflation-adjusted bond returns are setting the opportunity cost of holding a non-yielding asset.
Why Institutions See a Two-Sided Trade, Not a One-Way Exit
Downside pressure in gold is balanced by sustained institutional demand. Central bank buying provides a price floor, with a recent survey showing nearly 90% of central banks plan to increase gold reserves over the next year as a geopolitical hedge. Inflation at 4.1% continues to support gold demand over the long term by keeping Fed rate expectations elevated while sustaining investment demand for inflation protection.
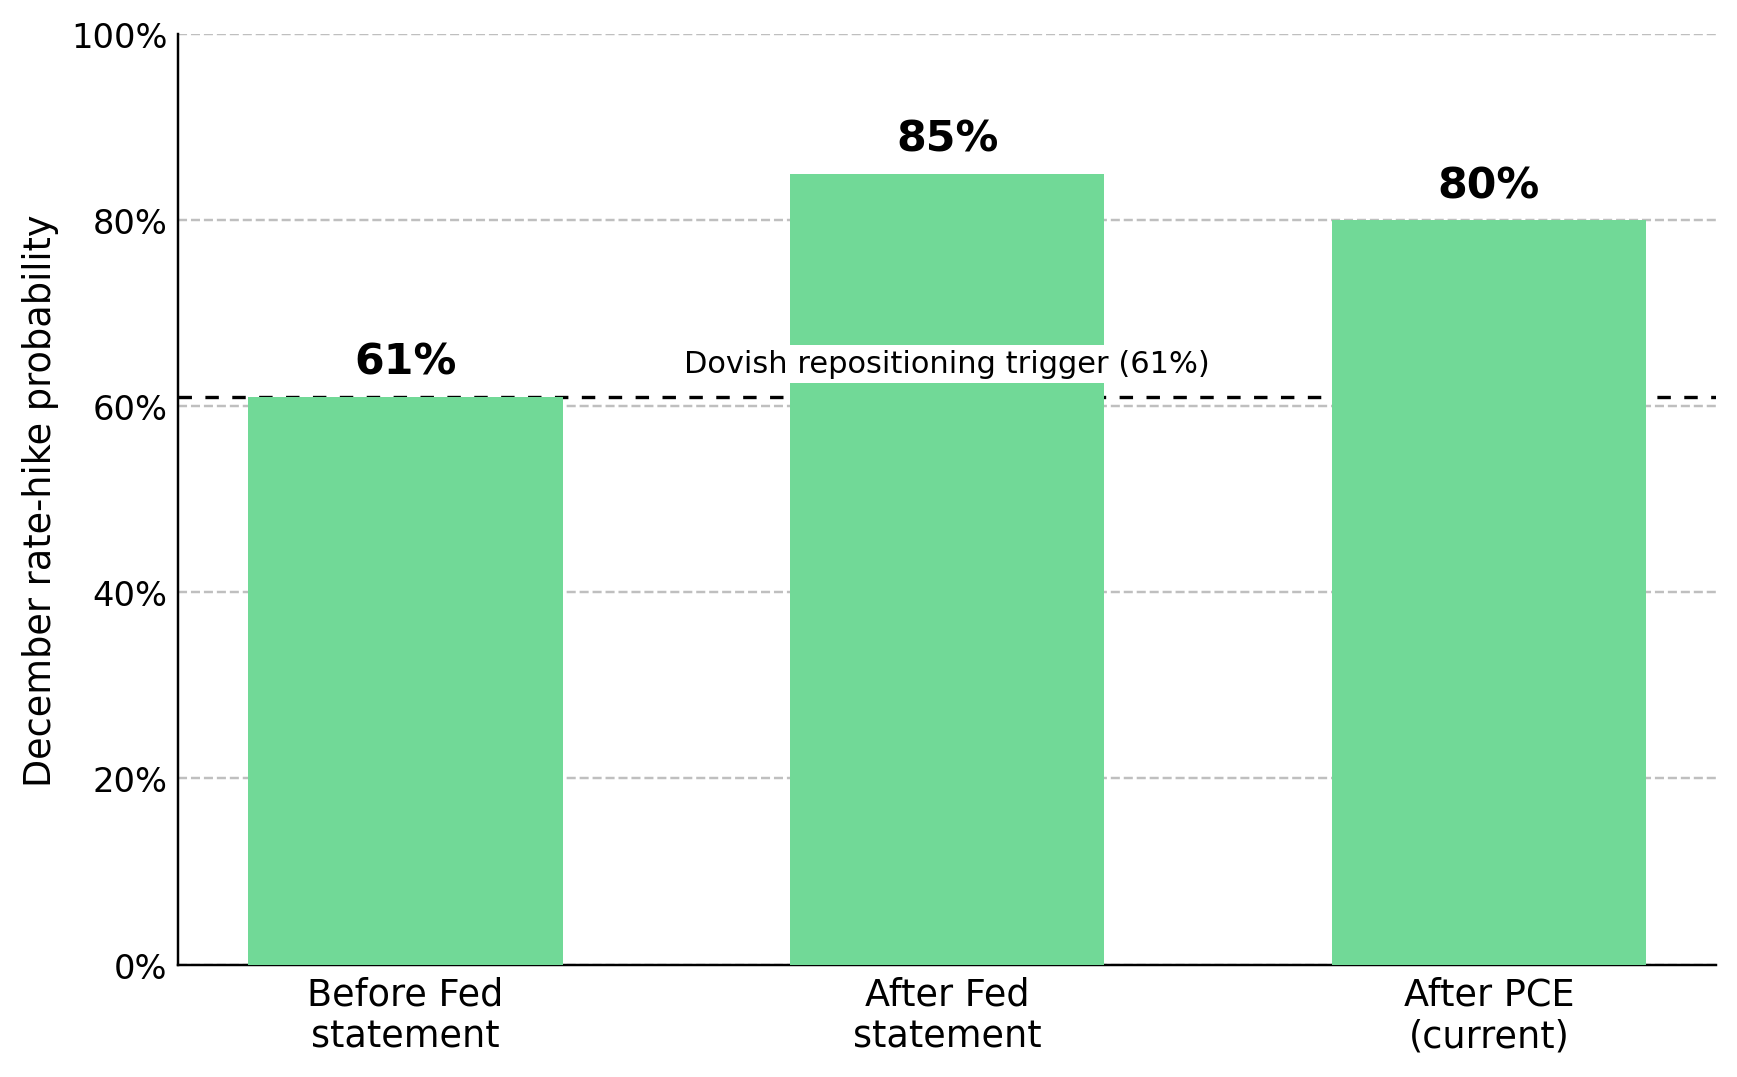 CME FedWatch December Rate-Hike Probability Repricing Around the Fed Statement and May PCE Print. Source: Crux Investor Analysis.
The key signal is whether CME FedWatch December hike odds move away from 80% in response to monthly US PCE inflation data.
Gold ETF, Miner & Silver Exposure Amplify Gold Price Moves in Portfolios
Retail portfolios feel the impact through three main asset channels. Gold-backed ETFs track spot prices directly, so a break below $4,000 immediately reduces their net asset value. Gold miners carry operating leverage, meaning a percentage drop in gold prices reduces revenue while costs remain fixed, amplifying earnings declines. Silver, which rallied with gold in 2025, typically declines more sharply when precious-metals demand weakens.
Positioning gold around near-term Fed timing should be avoided because rate-hike probabilities are split at 40% for next month and 80% for December, and macro shocks cannot be predicted in advance. Gold exposure should be sized to risk tolerance rather than Fed meeting timing, accounting for ETF fees and bid-ask spreads, with downside risk extending toward $4,200 into 2027 under Macquarie’s projection and potential for further declines before stabilisation.
US PCE Inflation & Fed Rate Expectations Define Gold’s $4,000 Regime Boundary
The key driver is US PCE inflation at 4.1% through May, the first reading above 4.0% since April 2023, which keeps real yields elevated and supports a hawkish Fed stance under Chair Warsh. If that inflation backdrop persists, portfolios favor underweight or short gold exposure, defensive cash positions, short-duration bonds, and a stronger US dollar, keeping gold capped below $4,000.
The downside regime in gold would shift if real yields fall, ETF selling slows, or the Fed adopts less hawkish communication, with a broader macro shock also capable of restarting demand. A softer US PCE print that moves December hike odds back toward 61%, combined with a sustained reclaim of $4,000 in gold, would restore demand across miners, ETFs, and silver.
Positioning can be guided by two indicators: CME FedWatch December hike probability at 80%, down from 85% after PCE but up from 61% before the Fed statement, and the US BEA monthly PCE release. A move in December to hike odds back toward 61% or a PCE print below 4.0% would signal a shift in the rate backdrop and require repositioning in gold exposure.