Prices for Germany, France, Italy, Spain, Netherlands, Poland, Belgium, Sweden, Ireland, Austria, Norway, Denmark, Romania, Czechia, Finland, Portugal, Slovakia, Hungary, Bulgaria.
By Wolf Richter for WOLF STREET.
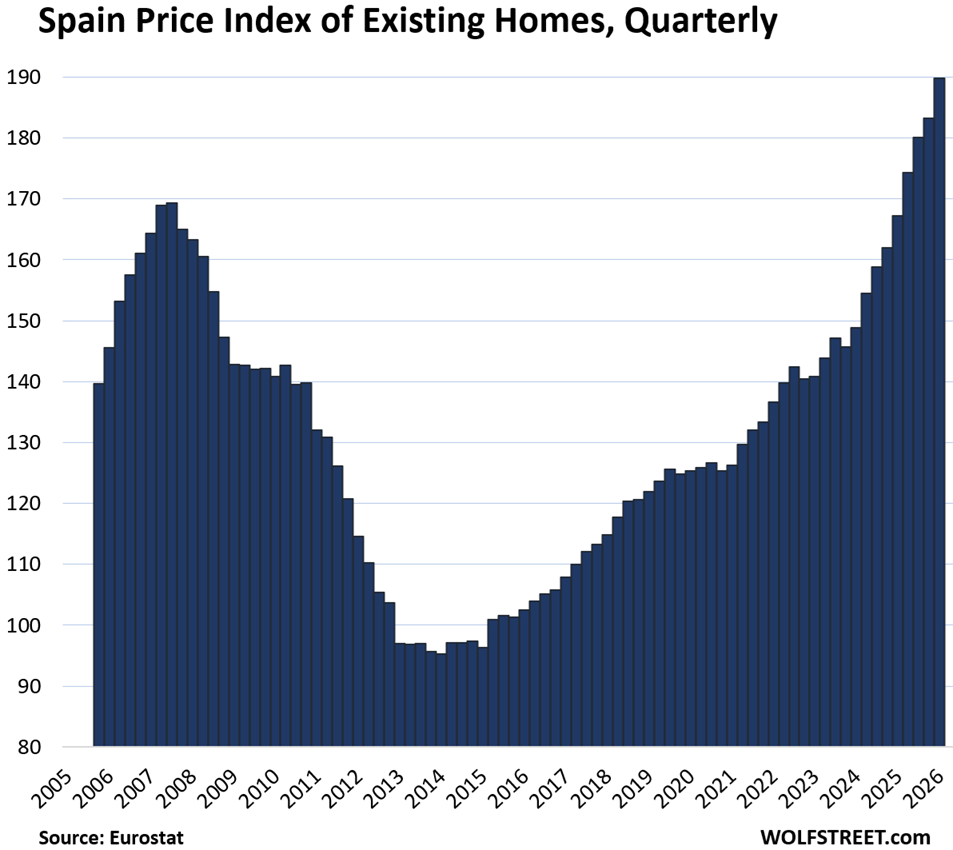
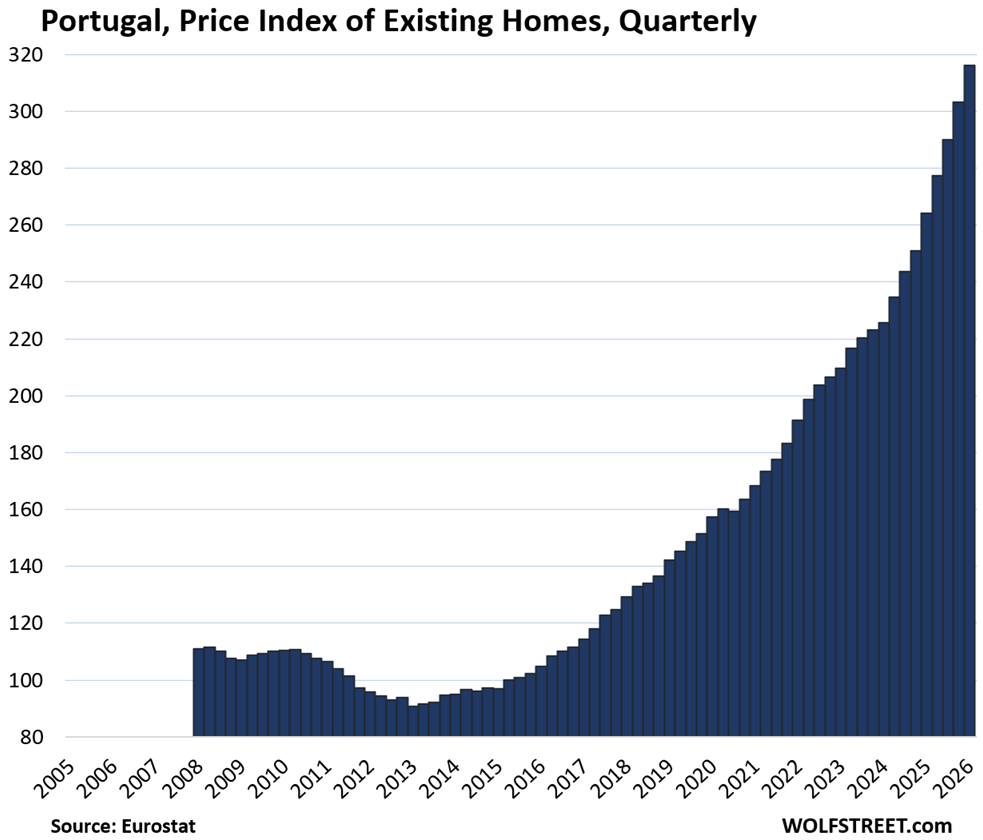
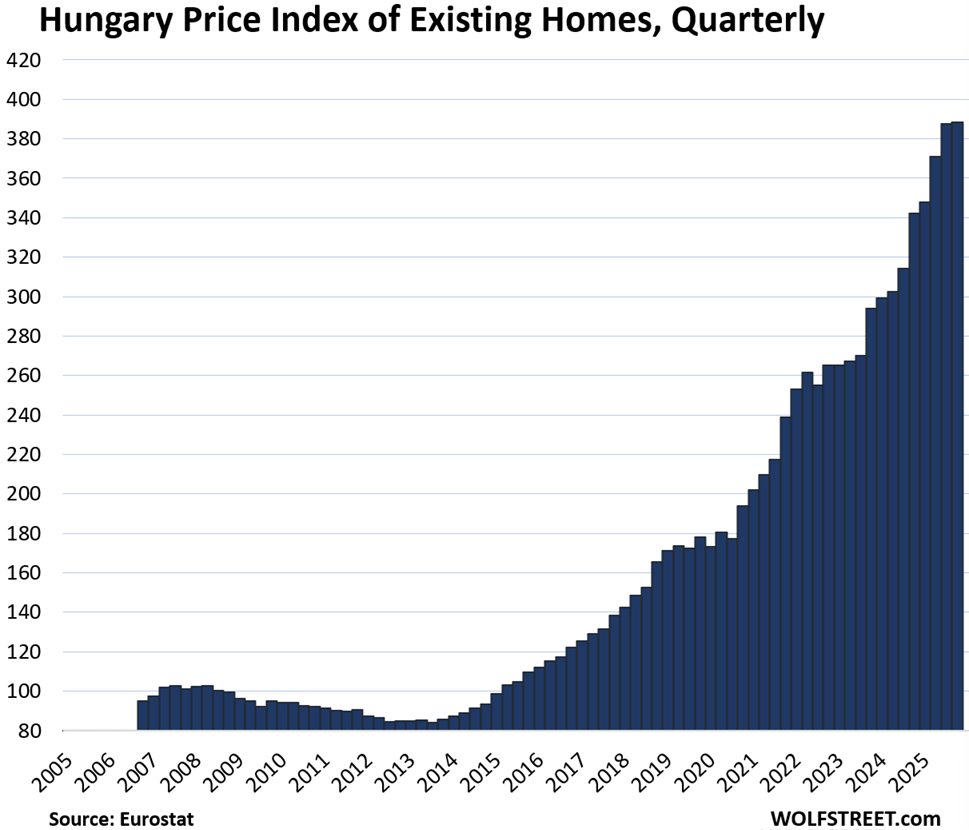
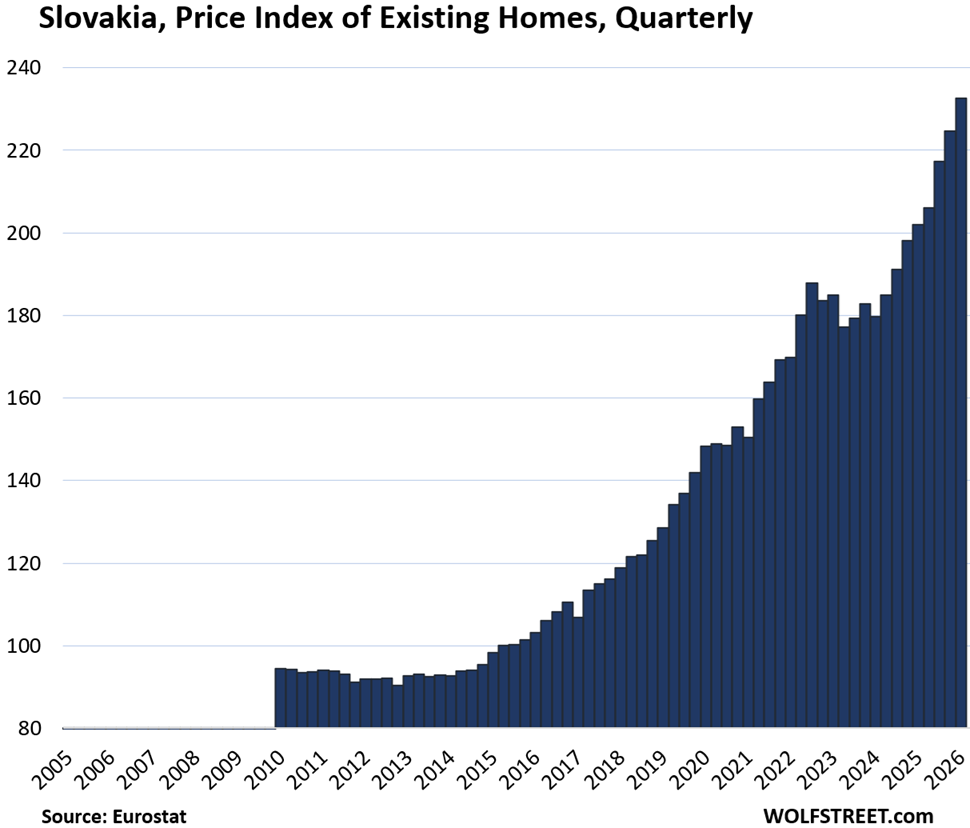
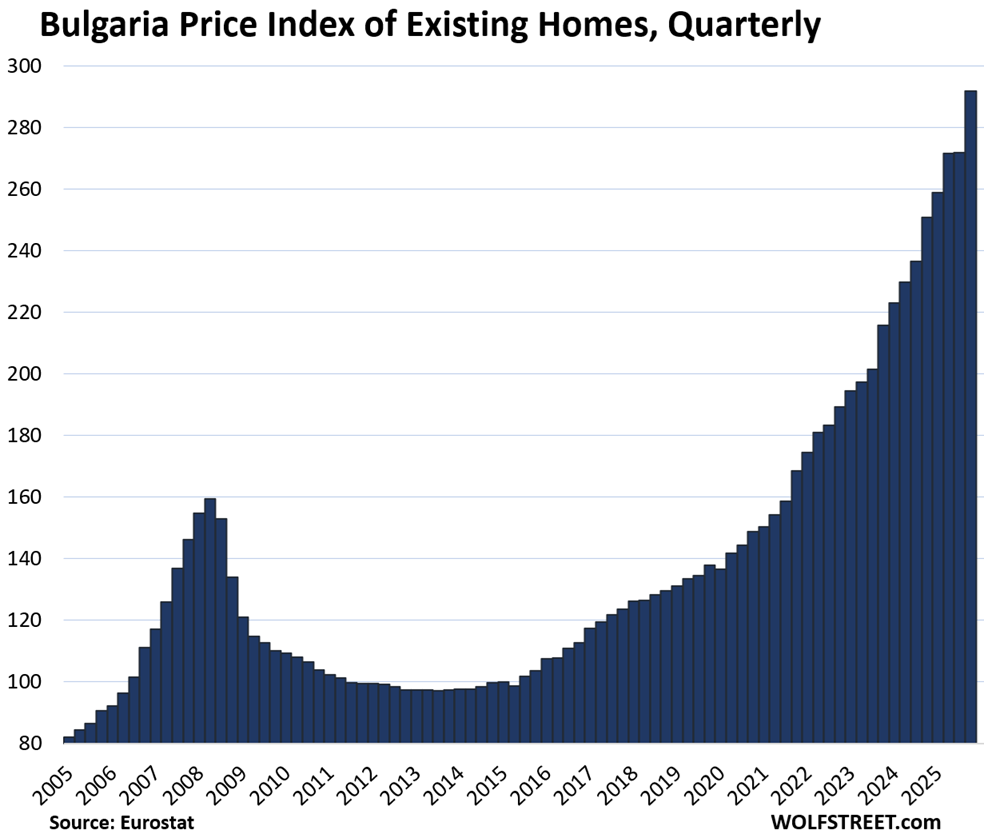
Prices of existing homes have been on an astounding run in some of the 19 largest countries in the European Union (EU) and in the European Economic Area (EEA), led by Portugal (+19.7% year-over-year), Bulgaria (+16.3% year-over-year), Slovakia (+15.2% year-over-year), Hungary (+13.5% year-over-year), and Spain (+13.5% year-over-year).
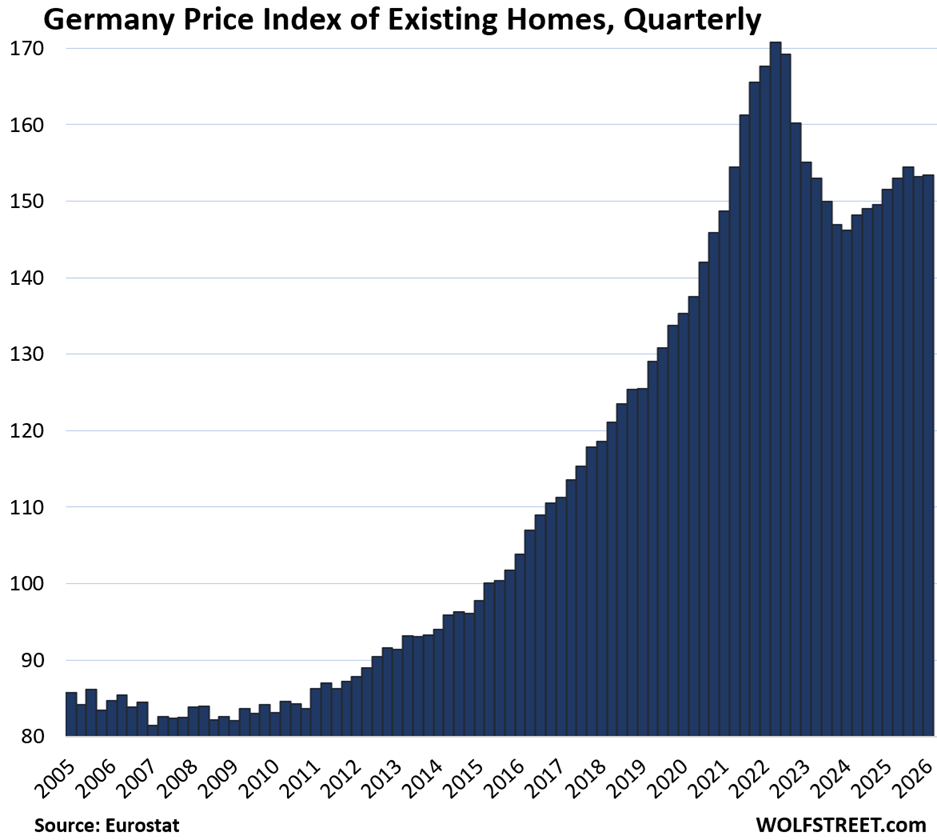
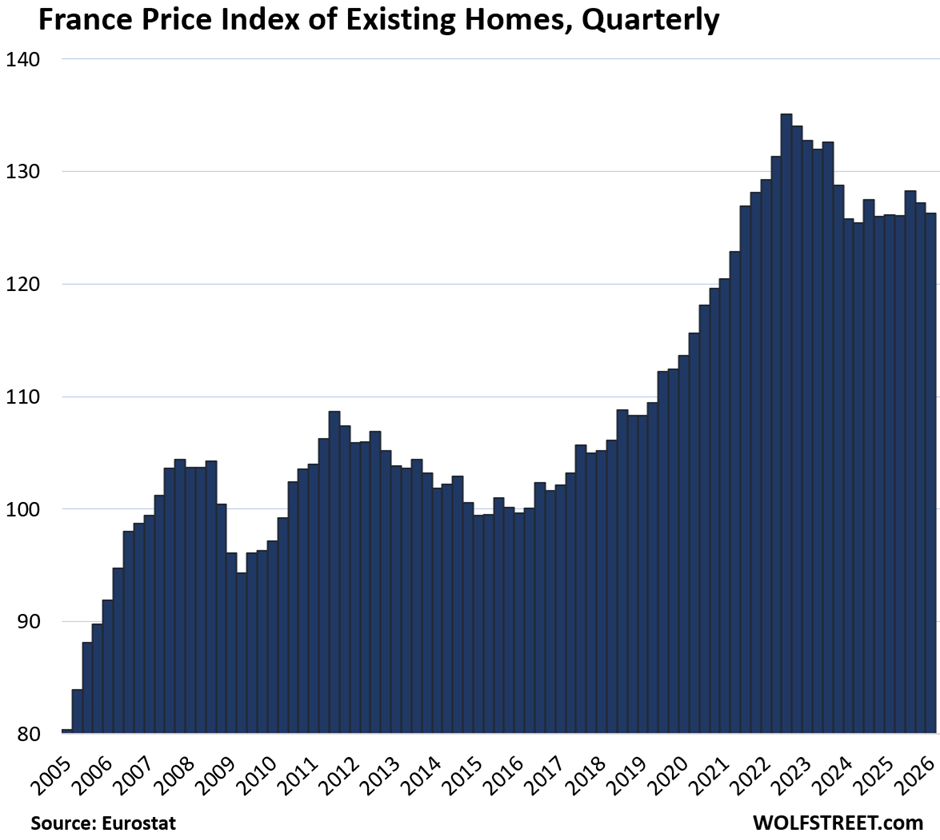
But in other countries, prices of existing homes have dropped from their highs reached some years ago, including the two biggest markets Germany and France.
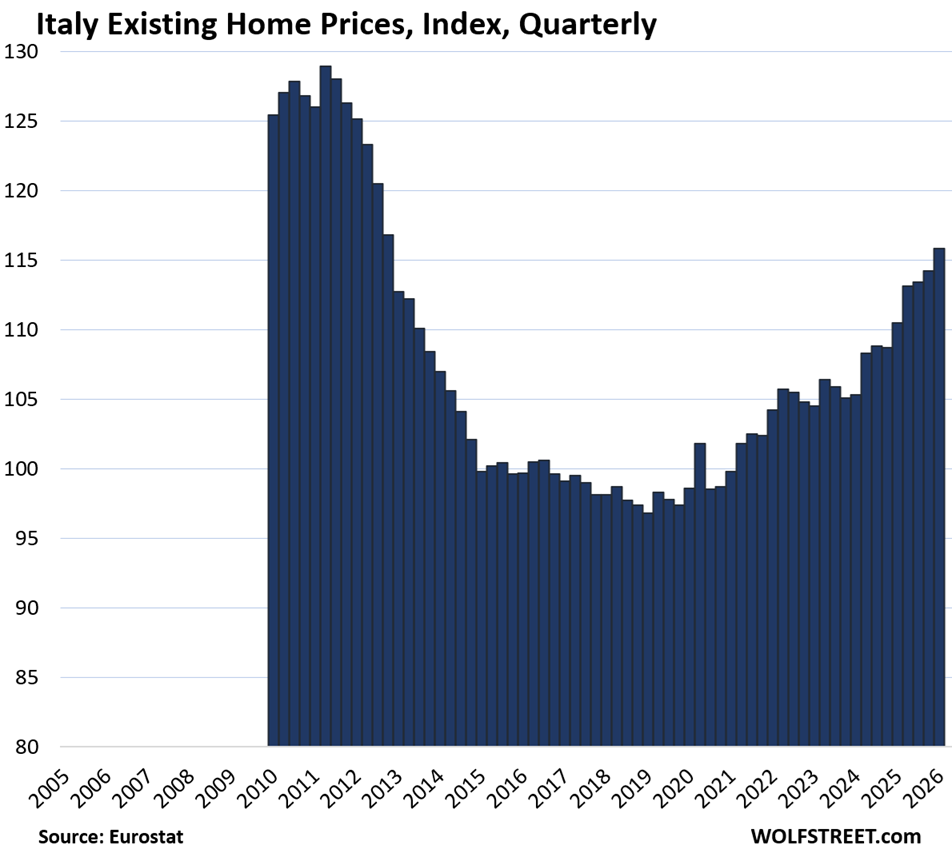
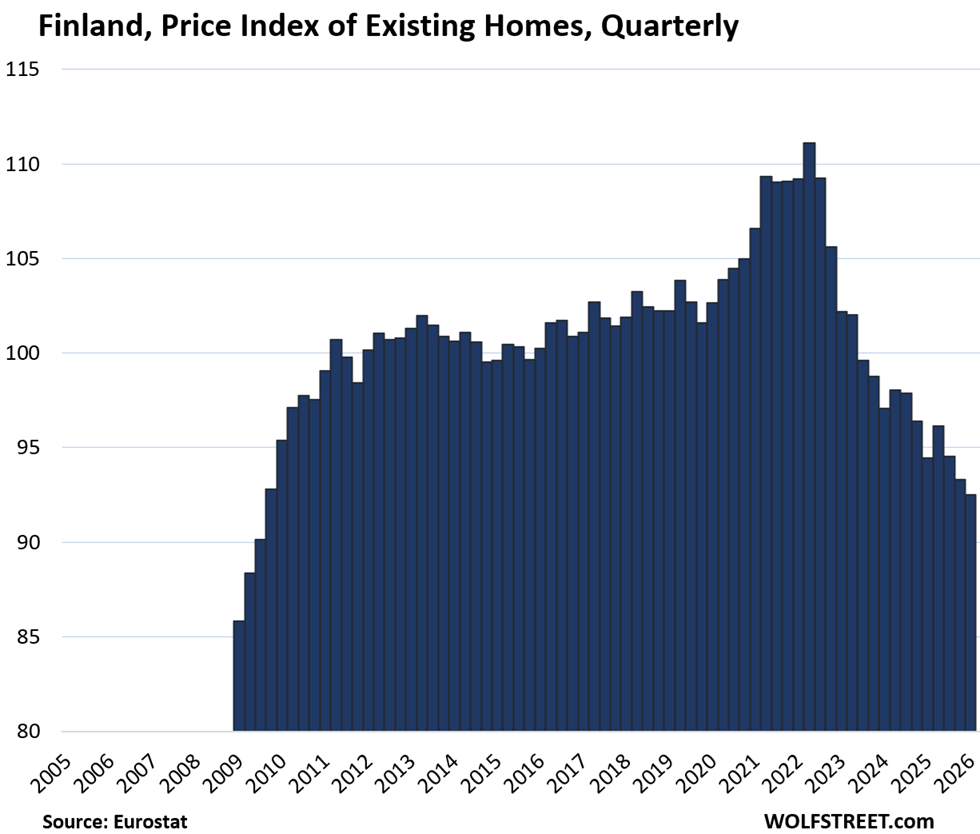
In Italy, prices of existing homes have surged in recent years, but are still below where they’d been during the prior housing bubble which imploded 15 years ago. And in Finland, prices have fallen by 16.8% from the peak in early 2022 after Russia invaded Ukraine, which made Finland very nervous, and prices are back to 2010 levels.
So this is our quarterly wild ride across the 19 largest housing markets in Europe, based on the new data from Eurostat through Q1 2026 for existing homes. But Greece is missing from this lineup as Eurostat does not provide home price data for Greece, noting that transaction-based data is not available for Greece.
Countries with prices below a peak in prior years and year of peak:
Finland: -16.8% (Q2 2022).
Italy: -10.2% (Q2 2011)
Germany: -10.2% (Q2 2022)
France: -6.5% (Q3 2022)
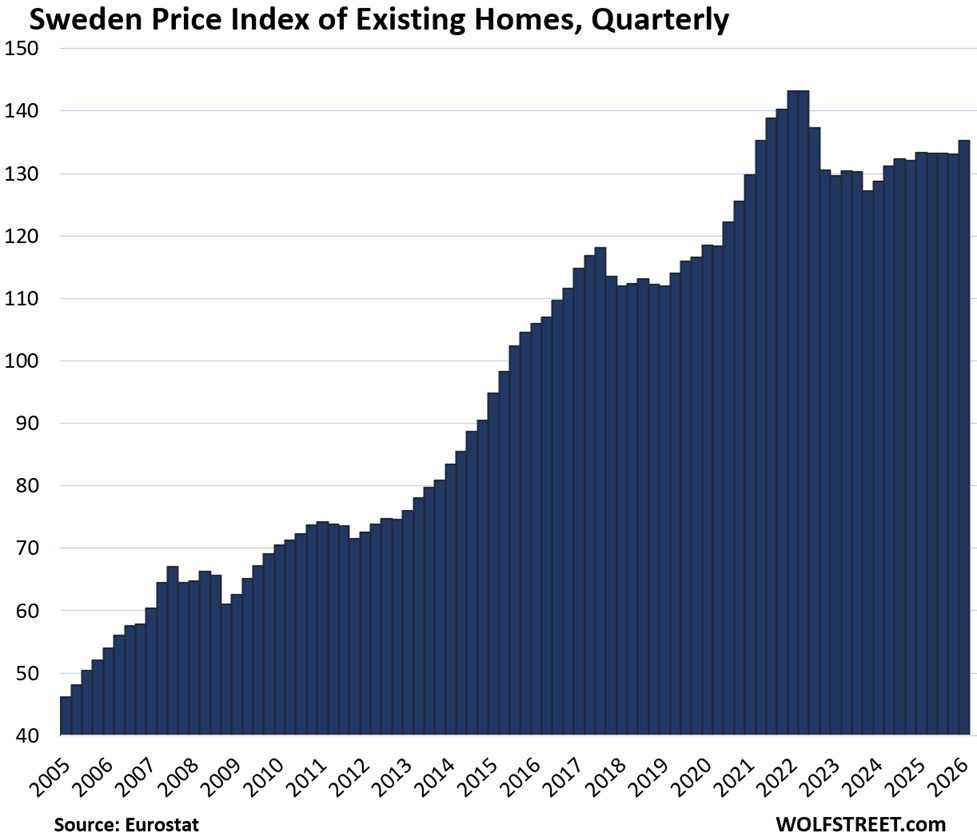
Sweden: -5.5% (Q2 2022)
Austria: -3.2% (Q3 2022)
Biggest price gains since 2010:
Hungary: +308%
Portugal: +186%
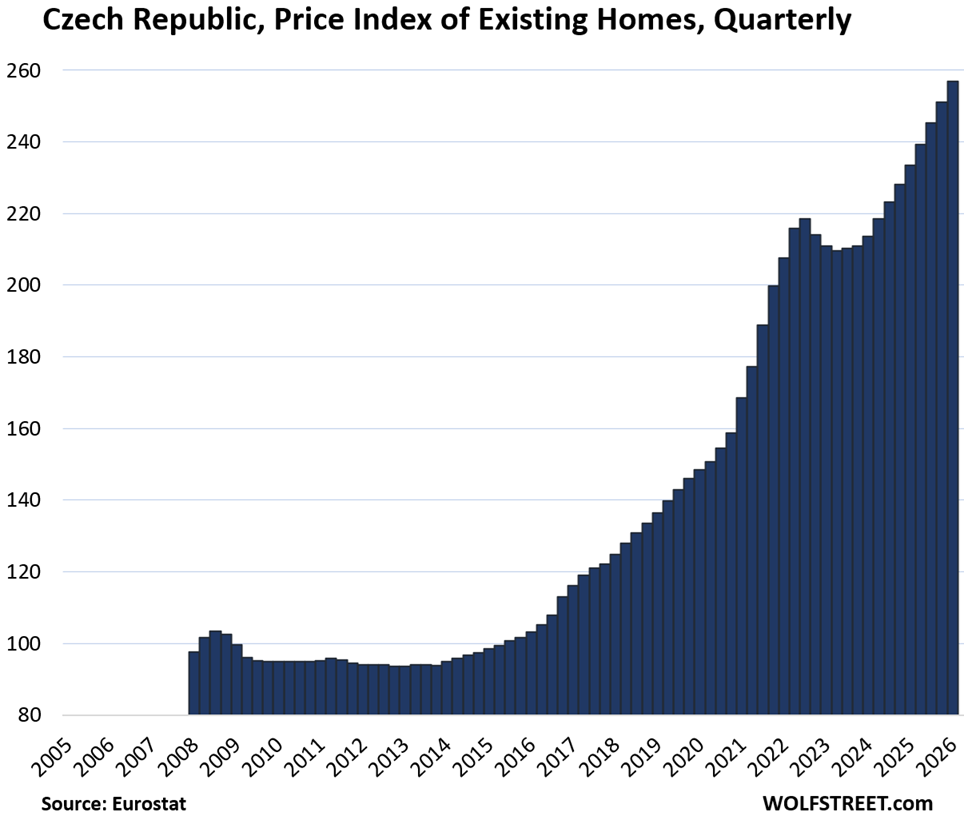
Czechia: +171%
Bulgaria: +165%
Slovakia: +146%
Austria: +129%
Poland: +119%
Norway: +118%
Netherlands: +96%
Sweden: +92%
Double-digit year-over-year gains in Q1 2026:
Portugal: +19.7%
Bulgaria: +16.3%
Slovakia: +15.2%
Hungary: 13.5%
Spain: +13.5%
Czechia: +10.1%
Biggest quarter-over-quarter gains in Q1:
Bulgaria: +7.3%
Portugal: +4.2%
Slovakia: +3.6%
Spain: +3.5%
Norway: +3.3%
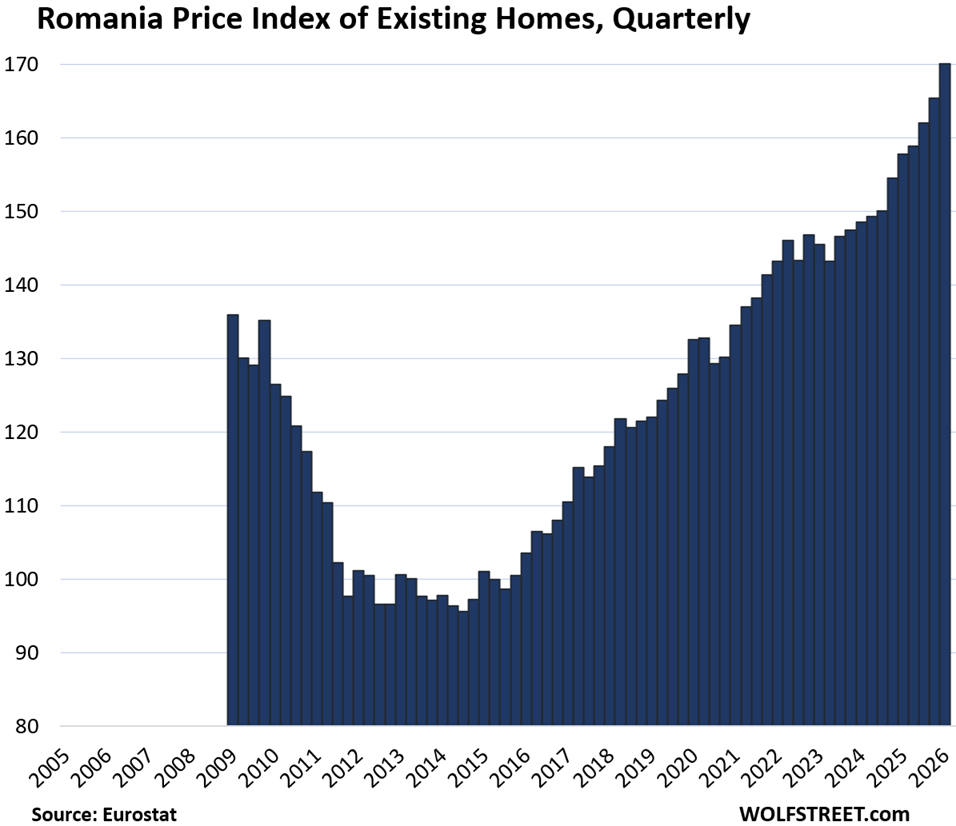
Romania: +2.8%
Denmark: +2.8%
Poland: +2.6%
Czechia: +2.3%
Home price indices for the 19 largest EU/EEA countries:
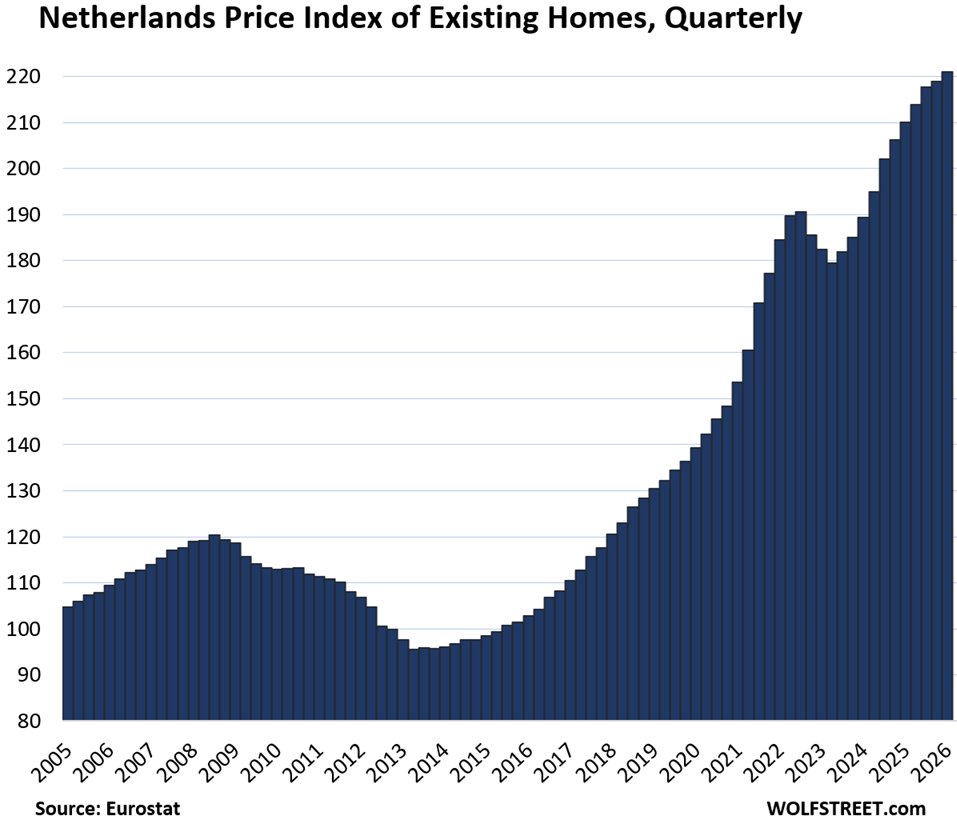
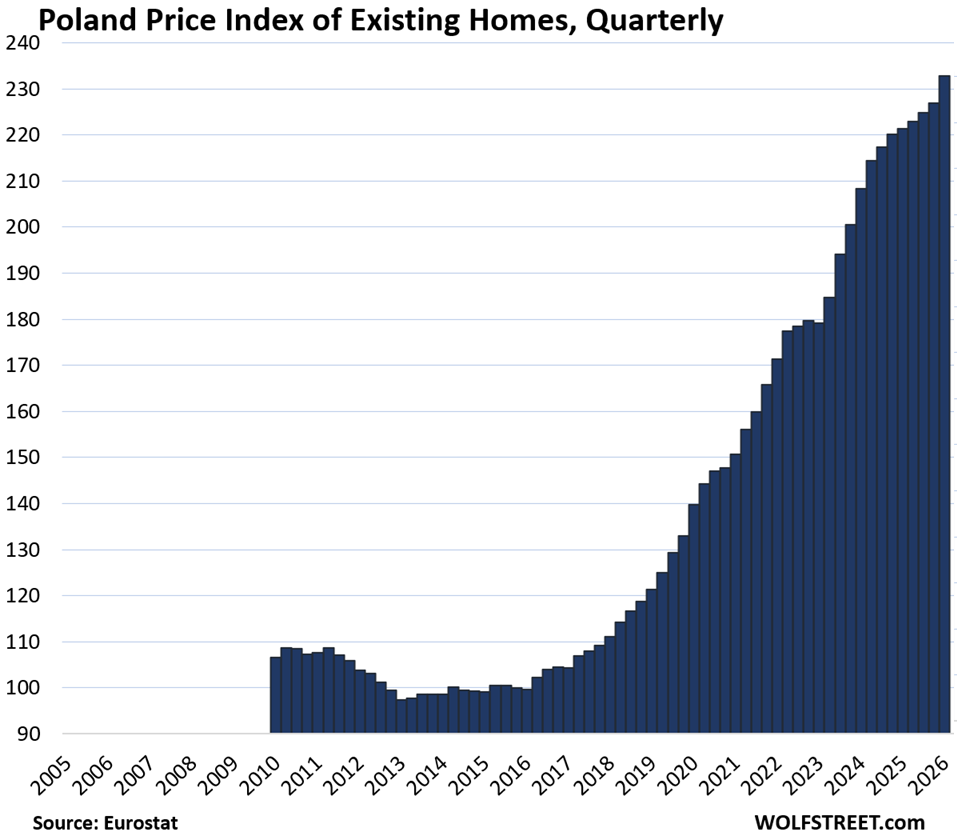
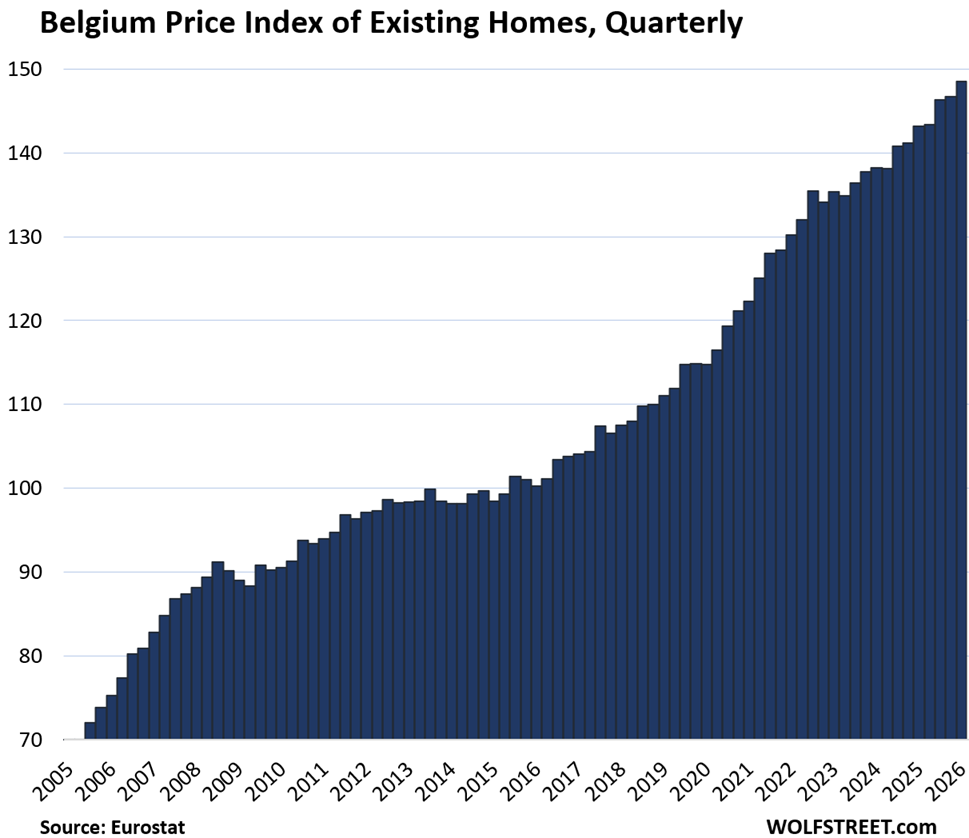
Eurostat’s transaction-based data goes back to 2005 for some countries; for other countries, it goes back less far. I put all of them on the same timeline going back to 2005 for easier comparison.
The vertical axis shows index values (where the values for 2015 were set at 100), rather than prices in currency, so it’s not possible to compare the price levels across the markets.
The little tables show three or four columns, from left to right: % change since 2010; quarter-over-quarter (QoQ) % change; year-over-year (YoY) % change; and % decline from the peak in prior years, for the six countries where that occurred.
Germany, Prices of Existing Homes
since 2010
QoQ
YoY
From peak
85%
0.1%
1.3%
-10.2%
France, Prices of Existing Homes
Since 2010
QoQ
YoY
From peak
30%
-0.7%
0.1%
-6.5%
Italy, Prices of Existing Homes
Since 2010
QoQ
YoY
From peak
-8%
1.4%
4.8%
-10.2%
Spain, Prices of Existing Homes
Since 2010
QoQ
YoY
35%
3.5%
13.5%
Netherlands, Prices of Existing Homes
Since 2010
QoQ
YoY
96%
1.0%
5.2%
Poland, Prices of Existing Homes
Since 2010
QoQ
YoY
119%
2.6%
5.2%
Belgium, Prices of Existing Homes
Since 2010
QoQ
YoY
64%
1.3%
3.8%
Sweden, Prices of Existing Homes
Since 2010
QoQ
YoY
From peak
92%
1.7%
1.4%
-5.5%
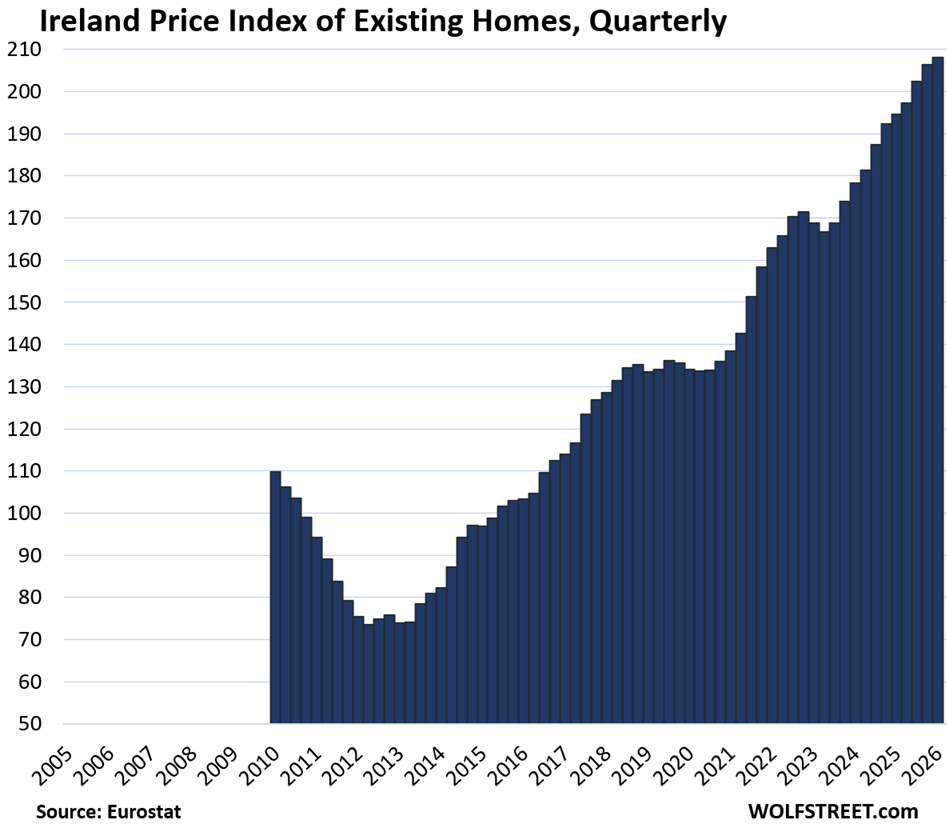
Ireland, Prices of Existing Homes
Since 2010
QoQ
YoY
89%
0.8%
6.9%
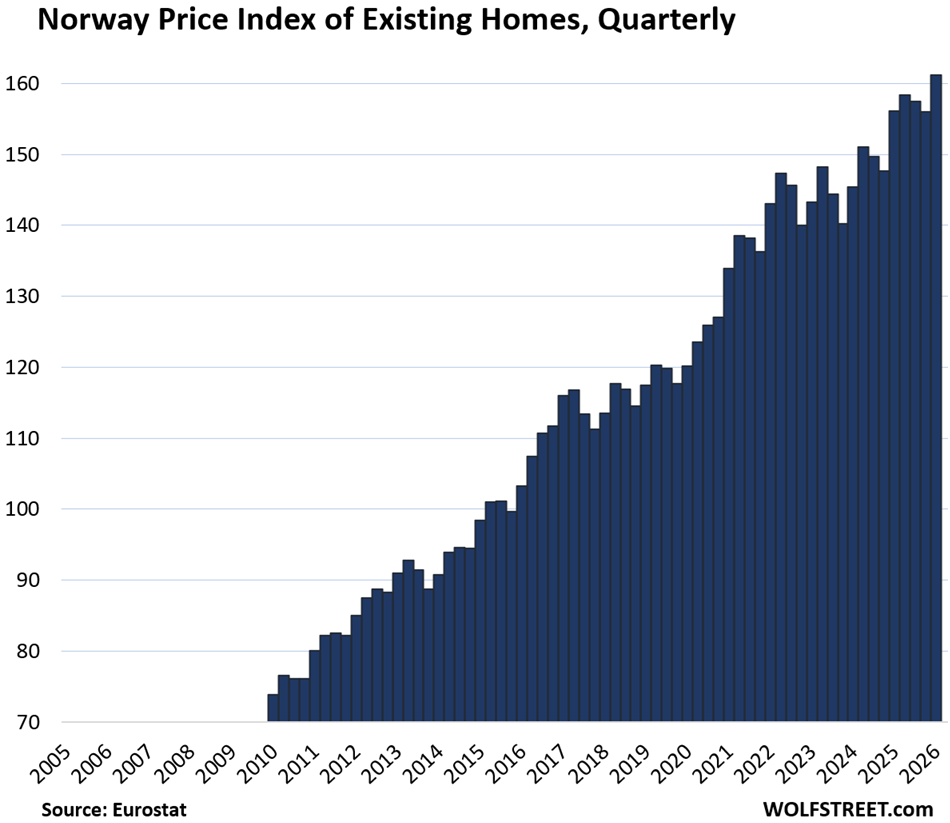
Norway, Prices of Existing Homes
Since 2010
QoQ
YoY
118%
3.3%
3.3%
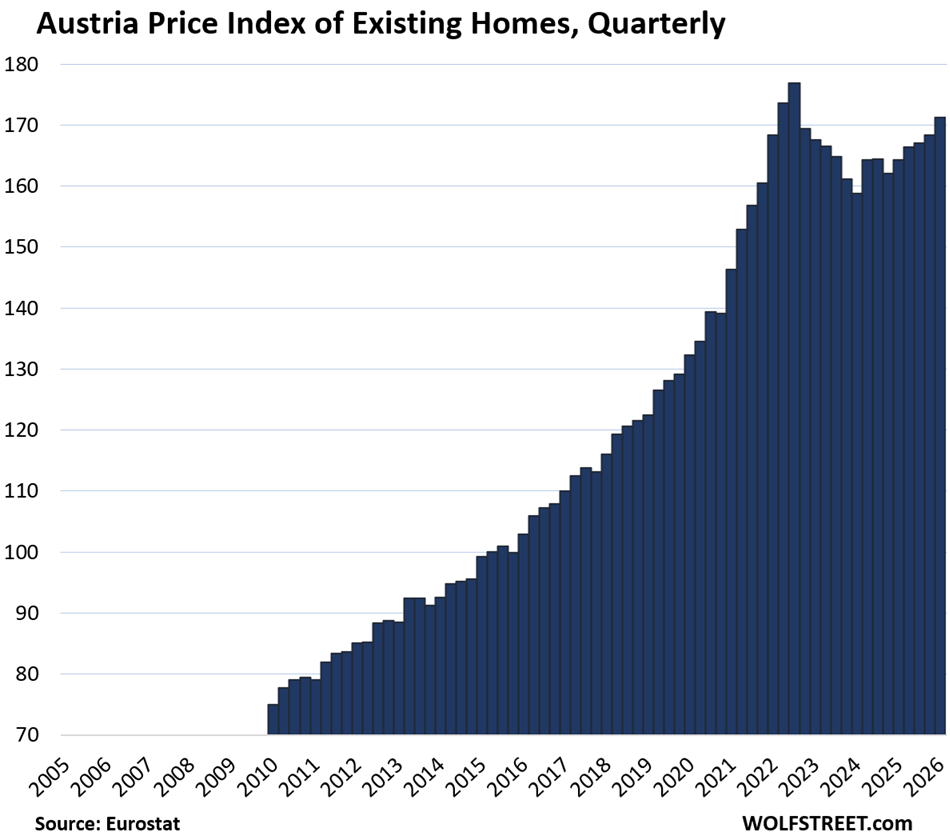
Austria, Prices of Existing Homes
Since 2010
QoQ
YoY
From peak
129%
1.7%
4.2%
-3.2%
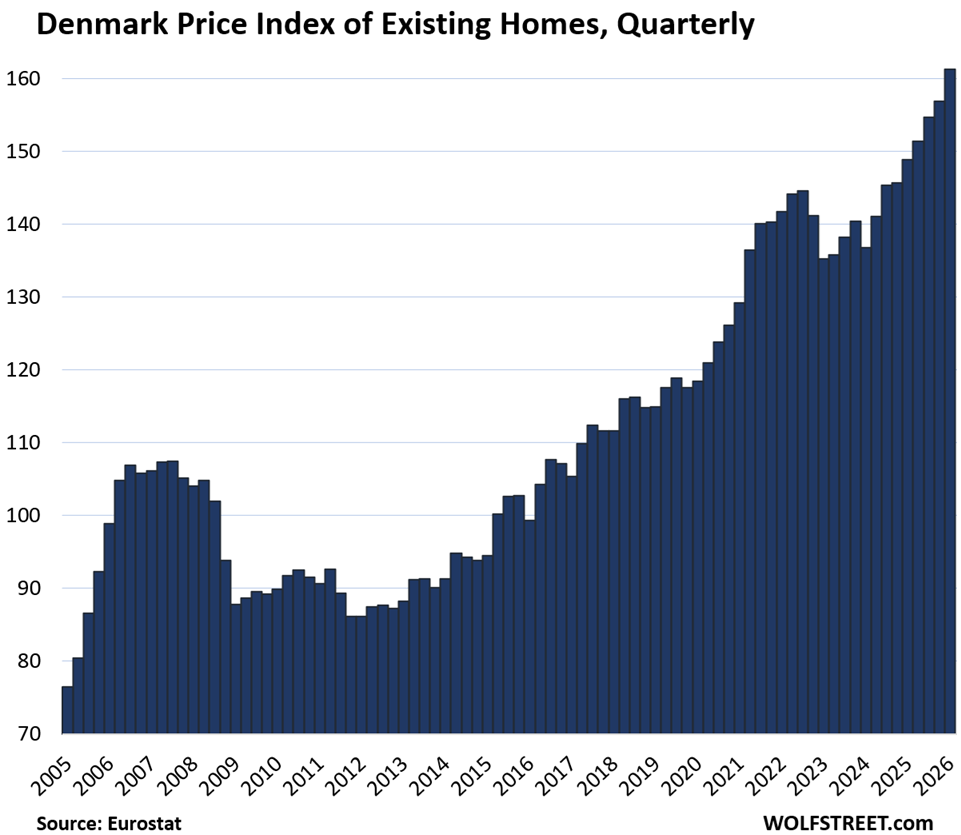
Denmark, Prices of Existing Homes
Since 2010
QoQ
YoY
79%
2.8%
8.3%
Romania, Prices of Existing Homes
Since 2010
QoQ
YoY
35%
2.8%
7.8%
Czech Republic, Prices of Existing Homes
Since 2010
QoQ
YoY
171%
2.3%
10.1%
Finland, Prices of Existing Homes
Since 2010
QoQ
YoY
From peak
-3%
-0.9%
-2.1%
-16.8%
Portugal, Prices of Existing Homes
Since 2010
QoQ
YoY
186%
4.2%
19.7%
Hungary, Prices of Existing Homes
Since 2010
QoQ
YoY
308%
0.2%
13.5%
Slovakia, Prices of Existing Homes
Since 2010
QoQ
YoY
146%
3.6%
15.2%
Bulgaria, Prices of Existing Homes
Since 2010
QoQ
YoY
165%
7.3%
16.3%
Enjoy reading WOLF STREET and want to support it? You can donate. I appreciate it immensely. Click on the mug to find out how: