

If you own JFrog stock or are considering a position, you’re likely asking the big question: is the market missing something, or is the stock already priced for perfection? JFrog, at a recent close of $48.07, has been delivering some eye-catching numbers over the long run. The stock is up 56.6% year-to-date and an impressive 76.6% over the past year. When you step back and take an even longer view, JFrog has returned 110.9% over three years, though it’s still facing a 37.4% drop compared to five years ago. This illustrates its up-and-down journey as market sentiment has shifted.
While recent weeks have been a bit rockier, with shares slipping 2.8% in the last week and 4.0% over the past month, the longer-term trends signal that investors continue to believe in the company’s growth potential. This optimism has been buoyed by broader market demand for software solutions that help businesses release and secure code faster, an area where JFrog is seen as a leader.
With all this movement, how does the current price stack up against the company’s fundamentals? A look at our valuation score, which adds a point for each of six standard checks where a company appears undervalued, gives JFrog a score of 0. That means, by the numbers, JFrog does not appear undervalued at all using traditional valuation benchmarks. Before you make any moves, let’s break down those valuation approaches. There is also an alternative lens for understanding valuation you may want to consider at the end of this article.
JFrog scores just 0/6 on our valuation checks. See what other red flags we found in the full valuation breakdown.
Approach 1: JFrog Discounted Cash Flow (DCF) Analysis
The Discounted Cash Flow (DCF) model estimates a company’s intrinsic worth by projecting its future cash flows and then discounting them back to today’s value, giving an idea of what the business is really worth based on expected future performance.
For JFrog, the DCF calculation uses a 2 Stage Free Cash Flow to Equity model. The company’s latest reported Free Cash Flow is $138 million. Analysts have projected steady growth, with Free Cash Flow expected to reach roughly $254.7 million in 2035. This highlights optimism about JFrog’s ability to generate more cash in the years ahead. Estimates for the first five years are directly from analysts, while later numbers are extrapolated to give a full decade-long outlook.
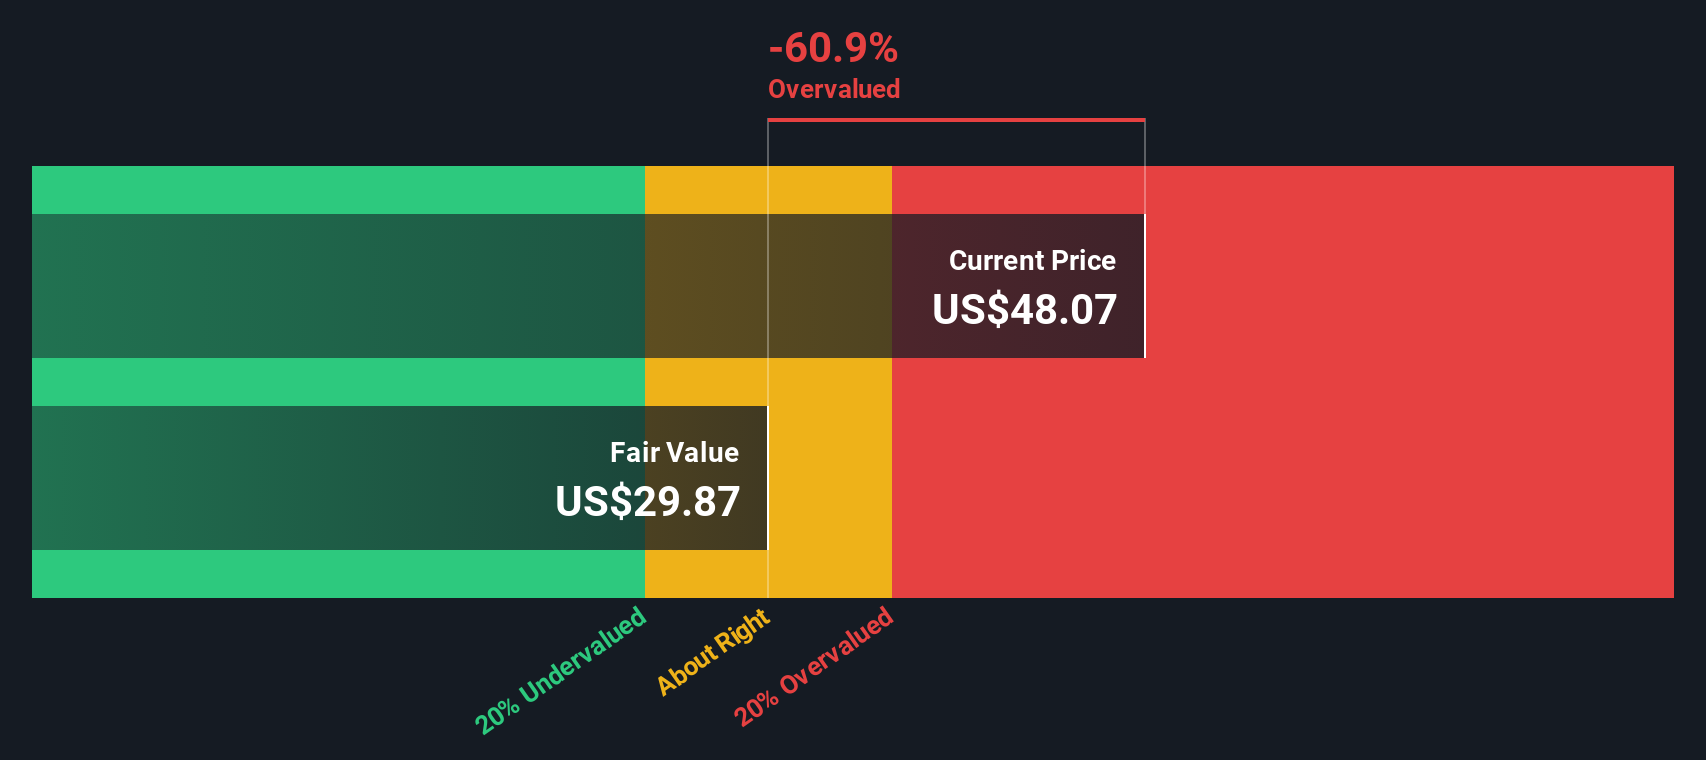
After crunching these projections, the DCF model arrives at an estimated fair value of $29.87 per share. With the stock recently trading around $48, this implies the shares are overvalued by 60.9% based on this intrinsic calculation. In short, even taking profitable future years into account, the current market price appears well above what the expected cash flows would justify.
Result: OVERVALUED
 FROG Discounted Cash Flow as at Oct 2025
Our Discounted Cash Flow (DCF) analysis suggests JFrog may be overvalued by 60.9%. Find undervalued stocks or create your own screener to find better value opportunities.
Approach 2: JFrog Price vs Sales
When it comes to valuing companies like JFrog, which consistently generate revenue but may or may not show strong profits yet, the Price-to-Sales (P/S) multiple is a particularly useful metric. The P/S ratio allows investors to assess how much the market is willing to pay for each dollar of JFrog’s sales. This makes it especially relevant for high-growth software businesses that often reinvest heavily in growth instead of showing immediate profits.
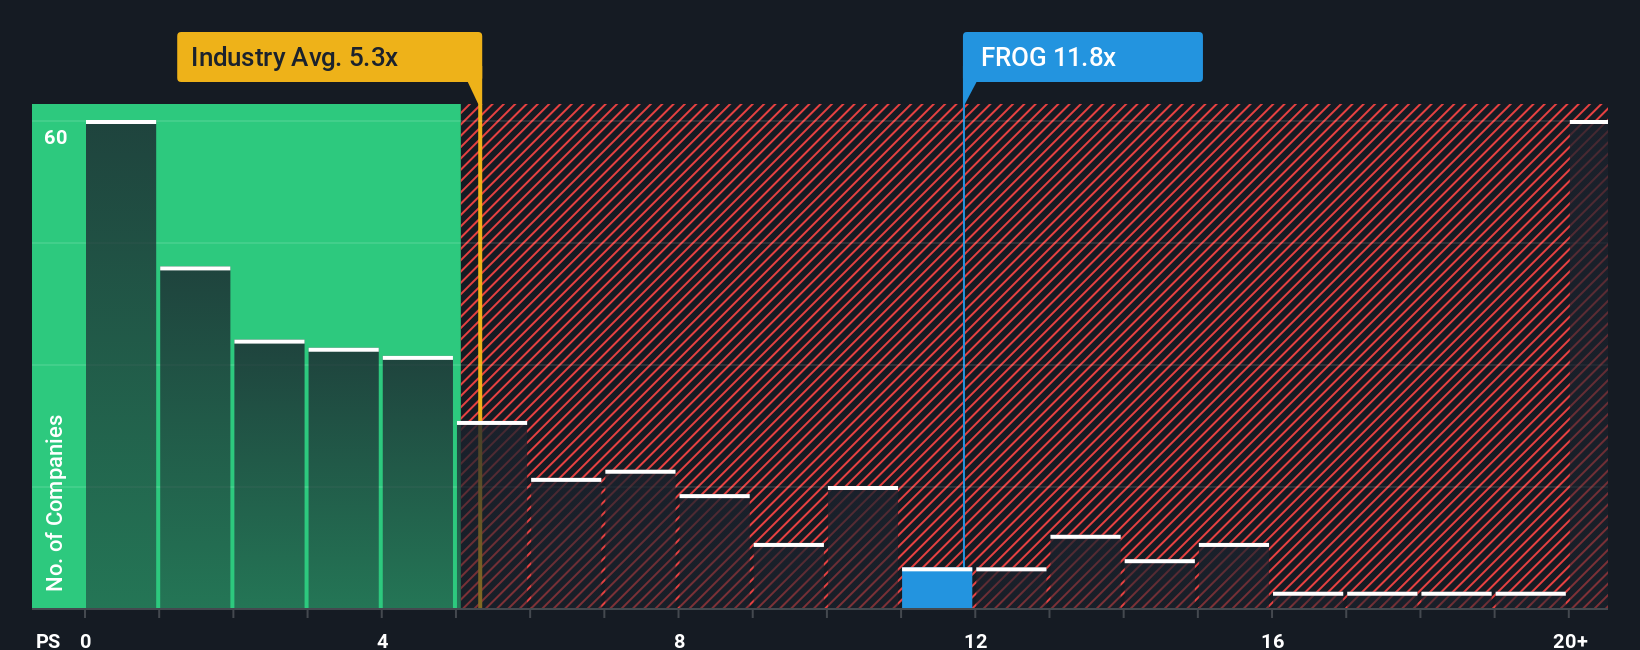
Growth expectations and risk play a major role in what is considered a reasonable P/S ratio. Companies with faster revenue growth or lower perceived risks tend to justify higher P/S multiples, while more mature or riskier businesses trade at lower levels. Comparing JFrog’s current P/S ratio of 11.82x to the software industry average of 5.29x and a peer average of 7.45x reveals that the stock trades at a significant premium to both these benchmarks.
To dig deeper, Simply Wall St calculates a proprietary “Fair Ratio” for JFrog at 6.89x, tailored to its unique mix of growth prospects, risk profile, size, and profitability. Unlike standard industry or peer comparisons, the Fair Ratio better reflects all of these company-specific variables and provides a more accurate barometer of fair value for JFrog.
With JFrog trading at 11.82x compared to its Fair Ratio of 6.89x, the shares appear overvalued when using this approach.
Result: OVERVALUED
 NasdaqGS:FROG PS Ratio as at Oct 2025
PS ratios tell one story, but what if the real opportunity lies elsewhere? Discover companies where insiders are betting big on explosive growth.
Upgrade Your Decision Making: Choose your JFrog Narrative
Earlier we mentioned there is an even better way to understand valuation, so let’s introduce you to Narratives. A Narrative is your personal story behind the numbers, where you connect your view of a company’s future, such as your own estimates for revenue, profit margins, or market opportunities, to a forecast and ultimately a fair value.
Rather than relying solely on static ratios or analyst models, Narratives let you link your investment thesis directly to financial forecasts, showing exactly how your beliefs shape the fair value you see for a stock. On Simply Wall St’s Community page, millions of investors use Narratives to turn their perspective, whether optimistic or cautious, into actionable insight, comparing their fair value to today’s price to decide if it’s time to buy, hold, or sell.
What makes Narratives especially powerful is that they update automatically as new information arrives, like fresh earnings reports or industry news, so your outlook is always relevant and dynamic. For example, one current JFrog Narrative forecasts a fair value of $54.88, highlighting strong growth in AI and platform adoption. Another takes a more conservative stance, stressing competitive pressures and gives a fair value of $29.87. This makes it easy to see where your point of view fits, and how it can guide better decisions in your investing journey.
Do you think there’s more to the story for JFrog? Create your own Narrative to let the Community know!
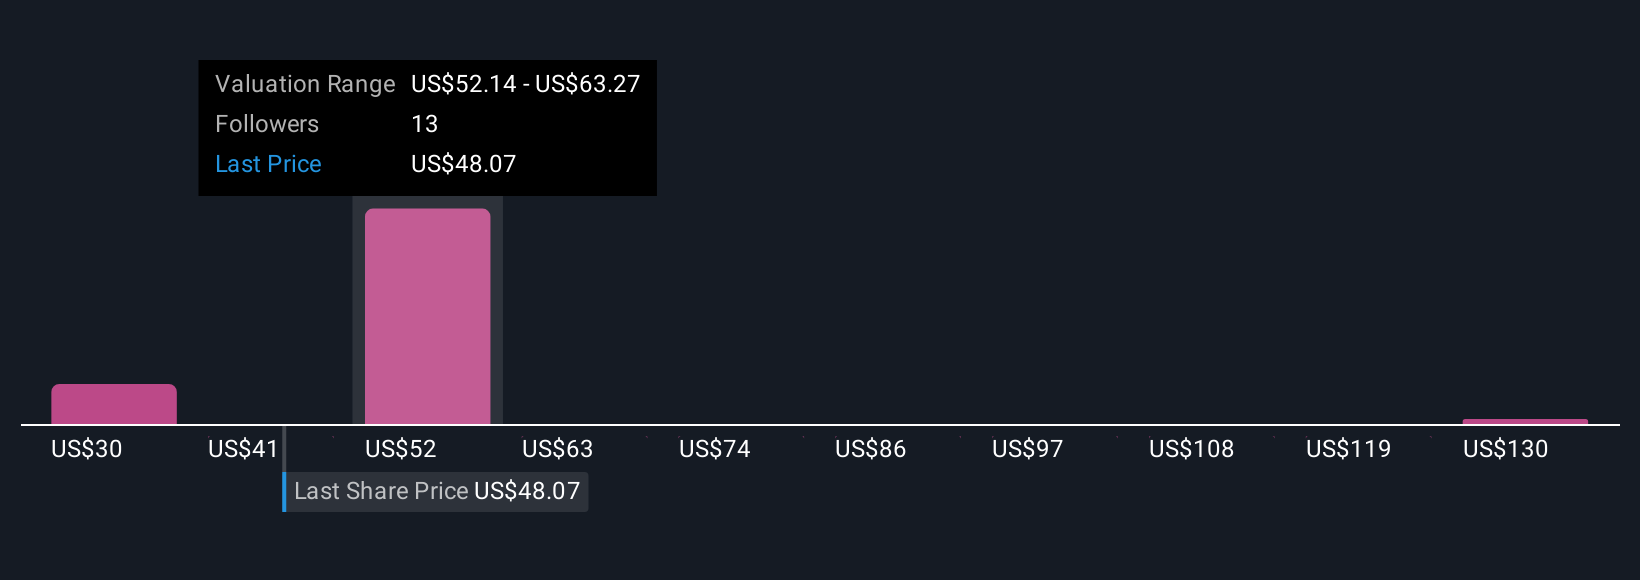 NasdaqGS:FROG Community Fair Values as at Oct 2025
This article by Simply Wall St is general in nature. We provide commentary based on historical data
and analyst forecasts only using an unbiased methodology and our articles are not intended to be financial advice. It does not constitute a recommendation to buy or sell any stock, and does not take account of your objectives, or your
financial situation. We aim to bring you long-term focused analysis driven by fundamental data.
Note that our analysis may not factor in the latest price-sensitive company announcements or qualitative material.
Simply Wall St has no position in any stocks mentioned.
New: Manage All Your Stock Portfolios in One Place
We’ve created the ultimate portfolio companion for stock investors, and it’s free.
• Connect an unlimited number of Portfolios and see your total in one currency
• Be alerted to new Warning Signs or Risks via email or mobile
• Track the Fair Value of your stocks
Have feedback on this article? Concerned about the content? Get in touch with us directly. Alternatively, email editorial-team@simplywallst.com