
Gold prices surged to their highest level in a week on Friday (September 18), posting their first weekly gain after four consecutive weeks of declines. Oil prices tumbled for a third straight session, dramatically easing market concerns about persistently elevated inflationary pressures and prompting precious metals investors who had built substantial short positions in gold to rapidly cover their bets—a key catalyst behind the rebound.
Spot gold finished the session up 1.2% at $4,390.11 per ounce (approximately NT$140,000), after touching its highest intraday level since September 11. The metal posted a weekly gain of roughly 1%. Gold futures for December delivery on the New York Mercantile Exchange (COMEX) also advanced, settling up 0.6% at $4,424.90 per ounce (approximately NT$140,000).
Oil Prices Plunge for Third Day, Short Positions Unwind Rapidly
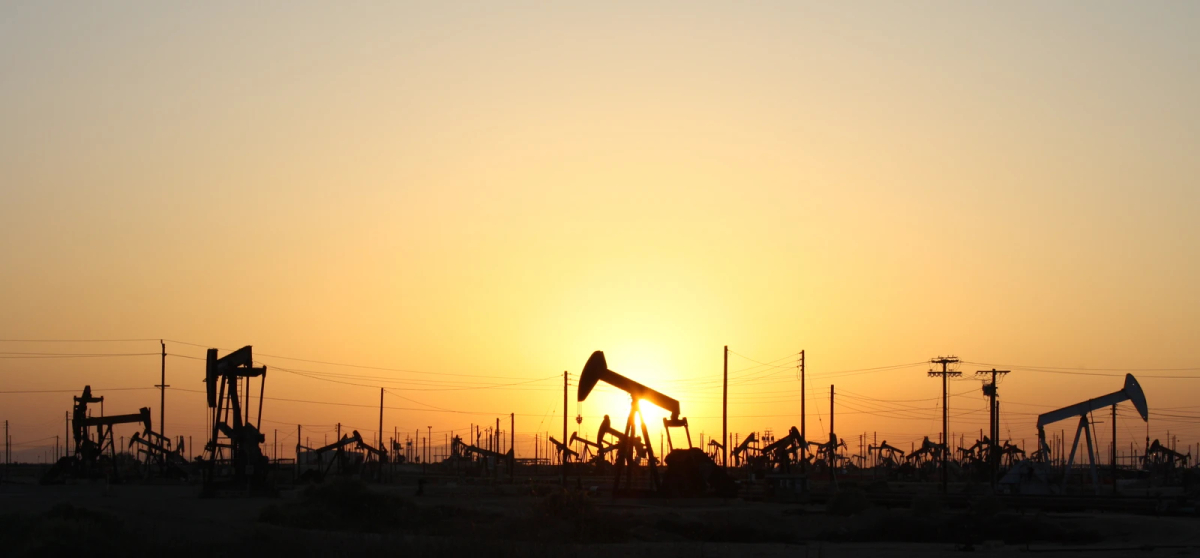
The core driver behind gold’s advance stemmed from dramatic shifts in the energy market. West Texas Intermediate (WTI) crude for October delivery tumbled 2.17% on Thursday to settle at $99.70 per barrel, marking a third consecutive daily decline and briefly dipping below the psychologically important $100 threshold. Reports emerged that Saudi Arabia was moving to restore operations on a critical oil pipeline within days, while some tankers continued to transit the tense Strait of Hormuz, significantly cooling supply disruption concerns. Additionally, US President Donald Trump’s remarks that the conflict with Iran was nearing an end further compressed the geopolitical risk premium.
The East-West Pipeline spans approximately 1,200 kilometers, stretching from the eastern oil-producing region across the Arabian Peninsula to the Red Sea port of Yanbu. It represents one of the few alternative routes Saudi Arabia can use to export crude at scale if the Strait of Hormuz is effectively blocked. The pipeline was knocked offline on September 10 when a drone attack damaged its main pumping facilities. Saudi Arabia’s current objective is to restore roughly half of its transport capacity within days; according to foreign media reports citing Middle Eastern officials, full restoration could take an additional three to five weeks.
The market’s sensitivity to news about this pipeline stems from the outsized importance of the Strait of Hormuz. The International Energy Agency (IEA) estimates that approximately 20 million barrels of crude oil transit the strait daily under normal conditions—equivalent to a quarter of global seaborne oil trade—with roughly 80% destined for Asia. More than 90% of Japan’s crude oil imports pass through this waterway.
RouteCapacity (million bbl/day)StatusStrait of Hormuz (maritime)~20Normal daily transit volumeSaudi East-West Pipeline (to Yanbu on Red Sea)7Offline after attack; target ~50% restorationUAE ADCOP Pipeline (to Fujairah on Gulf of Oman)1.8~60% utilization before crisis
The two overland pipelines listed above represent design capacity ceilings. Even if both were operating at full capacity simultaneously, their combined throughput would still be less than half of the Strait of Hormuz’s volume. Factoring in that the pipelines must also supply domestic refining and power generation needs, plus loading bottlenecks at Yanbu, the actual exportable volume would be further reduced. This explains why news of even “partial restoration” was sufficient to send oil prices down more than 2% in a single day.
EverBank Global Markets President Chris Gaffney noted: “Lower oil prices reduce inflationary pressure, because oil has been a major driver of overall inflation.” He further explained that precious metals investors had anticipated US rate hikes would trigger gold selling, so they built substantial short positions to profit from the expected decline. But the sharp drop in oil prices changed the market dynamic, and “those positions have been quickly unwound.”
The force of short covering was clearly visible on the charts. After spot gold surged nearly 2% on Thursday, it continued to hold above its 100-day moving average on Friday—a level widely viewed as a key indicator of medium-term momentum. Even with this week’s rebound, however, gold prices remain nearly one-fifth below the highs reached before the Iran conflict erupted in late February.
The Tug-of-War Between the Dollar and Rate Environment
Gold’s path this week was not entirely smooth. The US Dollar Index climbed to a more than seven-week high, which in theory makes dollar-denominated gold more expensive for holders of other currencies and constitutes real pressure. Meanwhile, the Federal Reserve unanimously voted on Wednesday to raise rates by a quarter point (0.25 percentage points), lifting the federal funds rate to a range of 3.75% to 4%, and signaled room for further tightening in the coming months. Fed Chair Kevin Warsh’s hawkish stance on inflation reinforced market expectations for at least one more rate hike this year, with the possibility of up to two additional increases by 2027.
Rising rates have historically been unfavorable for gold, a non-yielding asset, because the opportunity cost of holding it increases. According to the CME FedWatch tool, traders currently assign a 55% probability to another rate hike at the Fed’s October meeting. However, US Treasury yields, which initially spiked following the rate announcement, subsequently declined across all maturities this week—a shift that partially offset the pressure from the rate environment.
The Bank of Japan (BOJ) also announced a quarter-point rate hike on Friday, lifting rates to their highest level in 31 years and signaling readiness to continue raising borrowing costs. The synchronized tightening environment among major global central banks adds another layer of uncertainty for gold’s outlook.
Resistance Zone in Focus; Precious Metals Rally Broadly
Gaffney believes gold is currently testing the resistance zone around $4,400 to $4,440 (approximately NT$140,000), stating that “a breakout above this resistance level could open the path for further gains.” If gold can decisively clear this zone, the technical picture would show a clear breakout signal; conversely, if the rebound stalls here, this week’s rally may prove to be merely a short-term correction driven by short covering.
Other precious metals performed even more strongly this week. Spot silver rose 2.3% to settle at $66.70 per ounce (approximately NT$2,100); platinum gained 2.2% to $1,812.50 per ounce (approximately NT$58,000); and palladium advanced 1.5% to $1,310.20 per ounce (approximately NT$42,000). All three metals posted weekly gains, each outpacing gold’s advance, indicating broad-based capital inflows across the precious metals complex.
Precious MetalSpot Price (USD/oz)Daily ChangeGold4,390.11+1.2%Silver66.70+2.3%Platinum1,812.50+2.2%Palladium1,310.20+1.5%
Note: Prices are spot closing levels as of September 18; percentage changes calculated on a daily basis.
Physical Demand Mixed
In the physical gold market, demand in India was notably subdued this week as buyers held back on purchases, anticipating that prices could retreat further. By contrast, premiums in the Chinese market remained stable, with robust investment demand continuing to provide support. Gold ETFs recorded net inflows even during periods of price declines, indicating that long-term investors’ appetite for gold allocation has not been shaken by short-term volatility.
According to statistics released by the World Gold Council (WGC) on September 9, global gold ETFs saw net inflows of $18 billion in August—the second-largest monthly inflow on record. Total holdings increased by 121 metric tons to a record high of 4,189 metric tons, with assets under management rising 16% month-over-month to $615 billion. Cumulative inflows for the first eight months of the year reached $29 billion. The WGC noted that with heightened geo-economic uncertainty and unchanged incentives for countries to diversify foreign exchange reserves, central bank gold purchases are expected to continue making a significant contribution to global demand. Taiwan’s central bank also holds approximately 424 metric tons of gold, ranking 13th among global official reserves.
From a fund flow perspective, investors have continued to pour into the gold market in recent weeks, betting that the long-term structural factors underpinning gold prices remain intact. The interplay between oil price movements, Middle East geopolitical developments, and global central bank monetary policy will continue to dominate gold’s performance in the coming weeks. Market attention has now shifted to the Federal Reserve’s October rate decision and whether oil prices can hold current levels—two key variables that will determine whether gold can break through the critical $4,440 resistance level.