
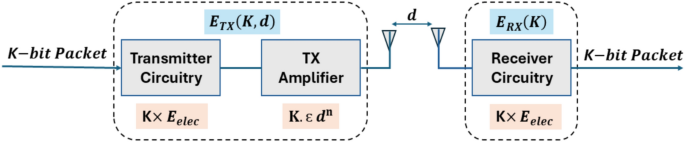
Simulation setting
In this section, the simulations are conducted using the MATLAB environment. All reported results are obtained by averaging over 100 independent Monte Carlo runs to mitigate the impact of random node deployment. This study is based on an idealized network model; therefore, effects such as channel interference, fading, and traffic congestion are not considered. Consequently, the obtained results reflect the relative performance of the evaluated protocols under controlled conditions and may not fully represent real-world deployment scenarios.
We compare the proposed DA-MC-SEP with SEP, Imp-LEACH, DARE-SEP, and EEMCL. The network is implemented in a square area of A = [100 × 100 m2] with 12 sectors of cluster and with random distribution of 100 heterogeneous SNs. Specifically, the network includes 68 normal nodes with initial energy of 0.5 J, 20 advanced nodes with initial energy of 1.2 J, and 12 LCH nodes with initial energy of 3 J. All protocols are evaluated using a fixed total energy of 80 Joules per node. Table 2 shows the details of the simulation parameters used to appreciate the proposed protocol.
Table 2 The simulation parameters.
A comparative performance analysis of DA-MC-SEP with SEP, Imp-LEACH, DARE-SEP, and EEMCL is presented. Furthermore, the following metrics are used for performance evaluation and analysis:
Dead Nodes (DN): they represent the total number of SNs whose power is less than or equal to zero, calculated as the dead nodes every round. Moreover, there are three metrics that will be calculated namely, the first sensor node’s death (FND) that represents the number of round When the battery life of the first SN is consumed, the half sensor node’s death (HND) that represents the number of round when the battery life of the half SN is consumed, and the last sensor node’s death (LND) that represents the number of round when the battery life of the last SN is consumed.
Packets to CHs: packets to live CH-election, it represents the number of packets that will be delivered to CHs.
Throughput called Packet to base station (BS), it describes the number of packets that will be transmitted in one-hop or two-hop from either CHs or 12 LCH SNs to the BS.
Stability period (FDN), it represents the no. of rounds measured at which the network begins its operation until the FDN starts in the network.
Instability-period, it clarifies the no. of rounds computed at which the FDN until the LDN.
Network Lifetime, it is measured by no. of rounds from the start of network operation until the LND in the network.
The Packet Delivery Ratio (PDR), it is represented as the ratio of total number of packets successfully received to BS \(N{P}_{\text{R}\text{X}}\) and transmitted from the source \(N{P}_{ \text{T}\text{X}}\). To obtain the percentage, multiply the PDR by 100, as in Eq. (17).
$${{P}_{i}}_{(nrm)}=\frac{N{P}_{\text{R}\text{X} }}{N{P}_{ \text{T}\text{X}}} X 100 \%$$
(17)
The Standard Deviation of Cluster Size (\({{\varvec{\sigma}}}_{{\varvec{S}}{\varvec{D}}}\)) measures the dispersion of sensor nodes among cluster heads to evaluate load balancing efficiency in clustering-based routing protocols. Mathematically, the standard deviation of cluster size is defined as in Eq. (18):
$${\sigma}_{SD}=\sqrt{\frac{1}{{m}_{c}}\sum_{i=1}^{{m}_{c}}({M}_{ic}-\overline{\text{M} }{)}^{2}}$$
(18)
where \({m}_{c}\) denotes the total number of clusters in the network, \({M}_{ic}\) represents the number of member nodes associated with the \({i}^{th}\) cluster, and \(\overline{\text{M} }\) is the average number of member nodes per cluster.
The simulation results of the proposed protocol are evaluated for a heterogeneous network with three types of SNs (normal, advanced and LCH SNs), where we assume m = 0.2 and α = 1.2, meaning the number of total advanced SNs is 20, with additional energy level of α = 1.2 compared to the normal SNs. Moreover, v = 0.12 and β = 3, meaning the total number of LCH SNs is 12, with additional energy level of β = 3 above that of the normal SNs.
Simulation of evaluation results
Imp-LEACH, DARE-SEP, and EEMCL protocols were all evaluated under a fixed total network energy of 80 Joules. This consistent energy allocation ensures a fair performance comparison across all protocols. The evaluation results are based on key performance metrics, including total number of dead nodes, total number of live nodes, stability period, namely the first-death of SNs (FDN), the death point of half SNs (HDN), the last-death of SNs per rounds (LDN), network lifetime per number of rounds, number of CHs during rounds, the data packets transmitted to the cluster-heads (CHs) during rounds, throughput, packet delivery ratio (PDR), normalized remaining energy and Standard deviation of cluster size.
Figures 4 and 5 show the comparison of the total number of live SNs and dead SNs for the proposed DA-MC-SEP protocol with SEP, Imp-LEACH, DARE-SEP, and EEMCL. DA-MC-SEP performs better than the other protocols during the network lifetime. The first dead node (FDN), representing the stability period, appears at round 1755 for DA-MC-SEP, while for SEP, Imp-LEACH, DARE-SEP, and EEMCL, the FDN occurs at rounds 1184, 1287, 1321, and 1362, respectively. The network lifetime is measured from the start of operation until the last node dies (LDN). The last dead node (LDN) of DA-MC-SEP occurs at round 9440, while the LDN for SEP, Imp-LEACH, DARE-SEP, and EEMCL occurs at rounds 5048, 5699, 6030, and 9020, respectively. The observed performance of DA-MC-SEP is associated with its three-level heterogeneity and hybrid single-hop and multi-hop transmission strategy, which helps mitigate energy bottlenecks associated with single-hop communication. By partitioning the network into clusters and deploying 12 high-power Leader Cluster Head (LCH) nodes to support remote low-power SNs and CHs in data transmission, the protocol contributes to a more balanced network load and facilitates data relaying. Additionally, CH selection considers the average energy of SNs as well as both distance and power factors, helping to reduce uneven energy depletion across the network.
Fig. 4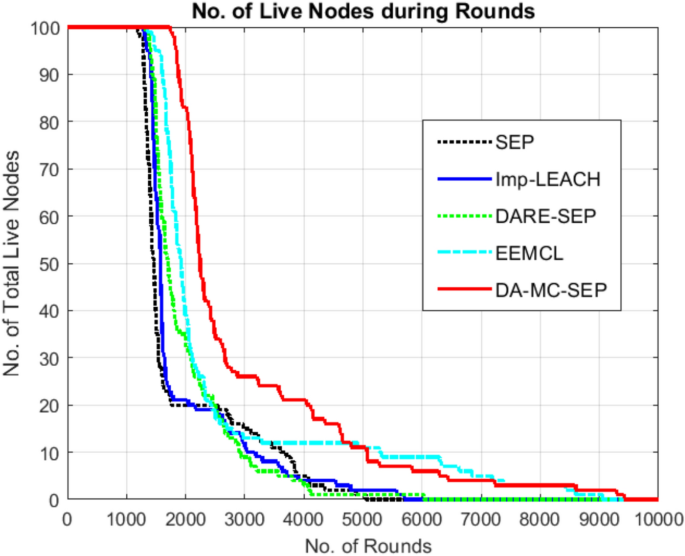
Total number of live nodes versus rounds for DA-MC-SEP, SEP, Imp-LEACH, DARE-SEP, and EEMCL in a network with 100 heterogeneous SNs and a fixed total energy of 80 J. For DA-MC-SEP, nodes are classified into 68 normal, 20 advanced, and 12 LCHs across three energy levels (0.5 J, 1.2 J, 3 J). DA-MC-SEP maintains a higher number of active nodes over time due to its hybrid single-hop and multi-hop strategy.
Fig. 5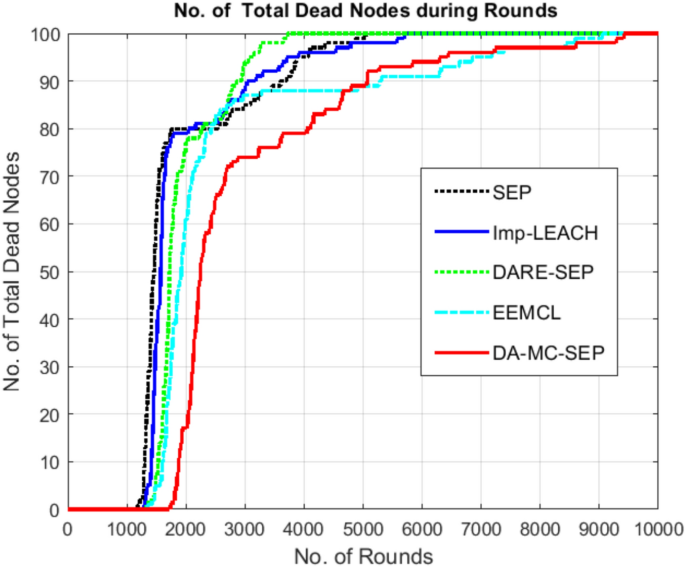
Total number of dead nodes versus network rounds for DA-MC-SEP, SEP, Imp-LEACH, DARE-SEP, and EEMCL. In DA-MC-SEP, the first dead node occurs at round 1755, and the last dead node occurs at round 9440.
To directly assess load concentration, Fig. 6 illustrates the total number of dead normal nodes per simulation round. The results show that normal nodes under the proposed DA-MC-SEP have a longer lifetime than those to in the benchmark protocols. Specifically, the first normal node dies at round 1755 in DA-MC-SEP, compared to rounds 1183 and 1287 for SEP and Imp-LEACH, respectively. This improvement is associated with the presence of Leader Cluster Heads (LCHs), which reduce the energy burden on normal nodes by assisting in data forwarding, particularly when a normal node is selected as a Cluster Head (CH).
Fig. 6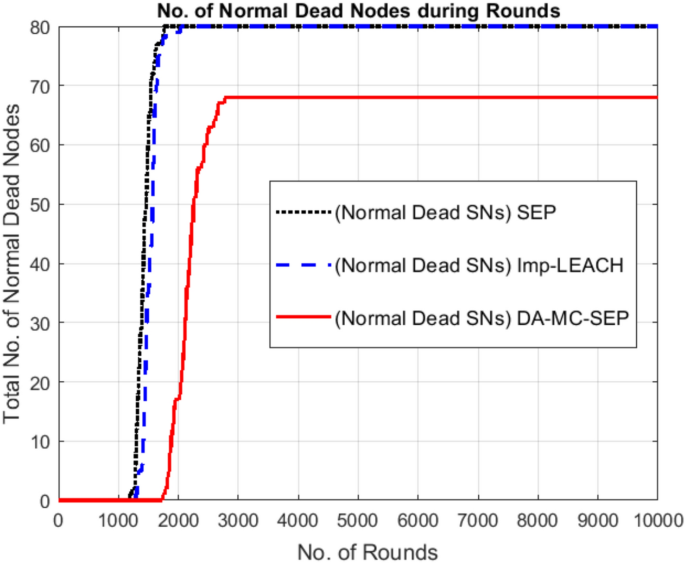
Total number of dead normal nodes per round for DA-MC-SEP, SEP and Imp-LEACH. In DA-MC-SEP, normal nodes remain active longer due to the support of LCHs.
Figure 7 presents the number of dead advanced and LCH nodes per simulation round. Advanced nodes under the proposed DA-MC-SEP show longer survival, with the first-node death delayed compared to the reference protocols SEP and Imp-LEACH, where node death occurs at rounds 2160, 2545, and 3330. This behavior indicates more balanced energy usage among heterogeneous nodes. Furthermore, LCH nodes remain active for a longer period, with the first LCH node dying at round 4217, while the last LCH node remains active until round 9440. These observations highlight the function of LCHs in supporting distant SNs and CHs, helping to reduce early energy depletion and contributing to network stability.
Fig. 7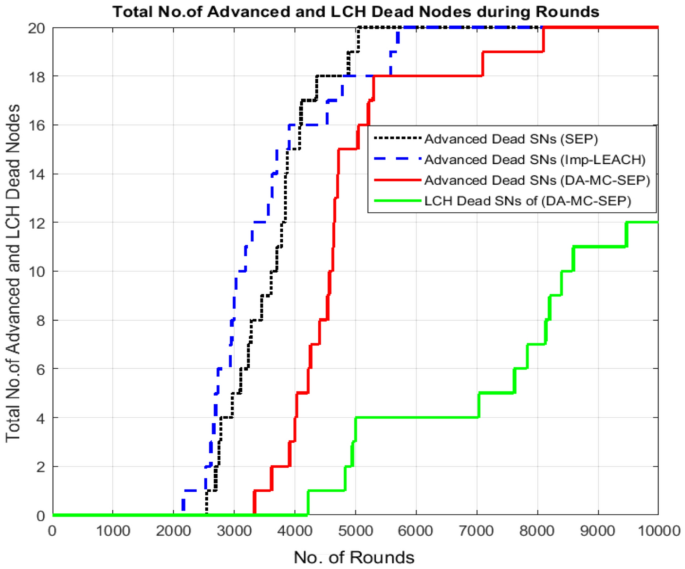
Total number of dead advanced and LCH nodes per round for DA-MC-SEP, SEP, and Imp-LEACH, with parameters \(m=0.2\), \(\alpha =1.2\), \(v=0.12\), and \(\beta =3\). In DA-MC-SEP, the first advanced node dies at round 2160, compared to 2545 and 3330 in SEP and Imp-LEACH, respectively. LCH nodes die between rounds 4217 and 9440, providing support to distant sensor nodes and cluster heads.
Figure 8 illustrates the network lifetime of the SEP, Imp-LEACH, DARE-SEP, EEMCL, and the proposed DA-MC-SEP protocols under the considered simulation settings. Table 3 compares FDN, HDN, and LDN for all evaluated protocols. The results show that DA-MC-SEP achieves a longer network lifetime and extended stability and instability periods compared to other protocols. This performance indicates a balance between protocol complexity and efficiency, where the energy savings gained through Leader Cluster Head (LCH) management and optimized routing effectively compensate for the additional control overhead, resulting in an increase in network lifetime.
Fig. 8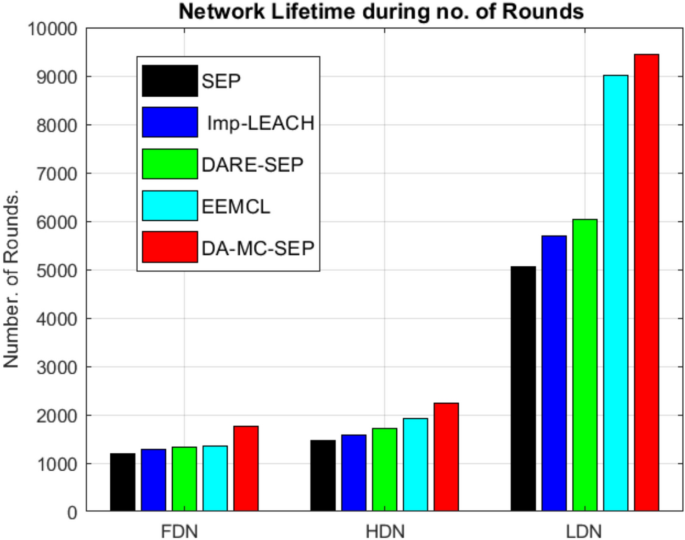
Network lifetime comparison of DA-MC-SEP with SEP, Imp-LEACH, DARE-SEP, and EEMCL protocols, showing the number of rounds until all nodes die.
Table 3 Comparison of proposed protocol DA-MC-SEP with SEP, Imp-LEACH, DARE-SEP, and EEMCL against number of rounds.
Figure 9 shows the number of CHs during the simulation rounds for DA-MC-SEP, SEP, Imp-LEACH, DARE-SEP, and EEMCL protocols. In DA-MC-SEP, the heterogeneous CH election mechanism, which considers both energy and distance factors, along with the formation of appropriately sized clusters where high-energy LCH SNs receive data from CHs and forward it to the BS, helps maintain CH activity for a longer duration compared to the other protocols. Consequently, Fig. 10 illustrates the total data packets transmitted to the cluster heads (CHs) during the simulation rounds across all protocols, The results indicate that DA-MC-SEP achieves a higher number of data packets compared to SEP, Imp-LEACH, DARE-SEP, and EEMCL.
Fig. 9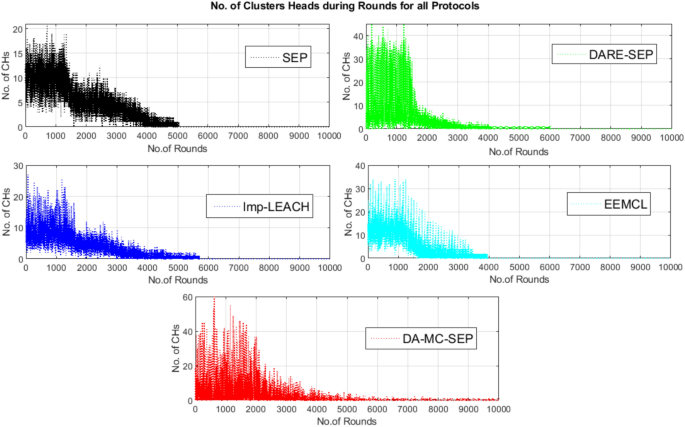
Number of cluster heads versus rounds for DA-MC-SEP, SEP, Imp-LEACH, DARE-SEP, and EEMCL in a 100-node network, showing the distribution and stability of cluster formation over time.
Fig. 10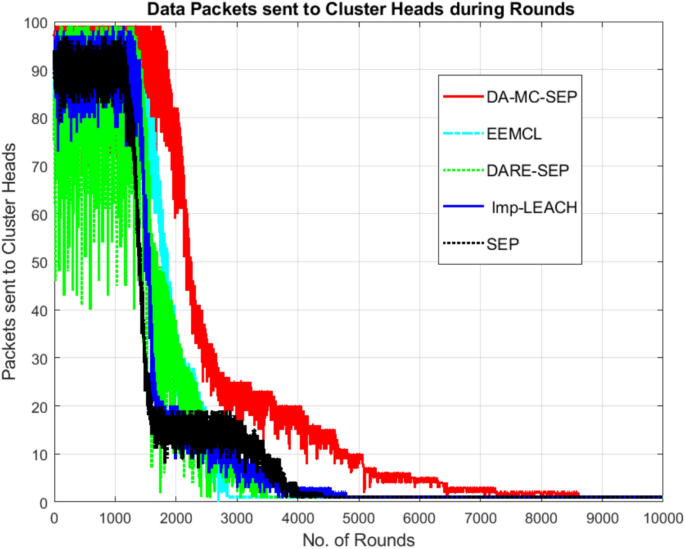
The data packets sent to cluster heads versus number of rounds for DA-MC-SEP and the benchmark protocols, showing that DA-MC-SEP delivers higher data throughput to the CHs.
Figure 11 shows the total number of packets sent to the BS (Throughput) for the proposed protocol compared with SEP, Imp-LEACH, DARE-SEP, and EEMCL protocols. This metric serves as a primary indicator of the protocol’s reliability and effectiveness in data collection. All protocols are evaluated under the same total initial network energy of 80 J to ensure a fair comparison. The results indicate that DA-MC-SEP achieves higher throughput to the BS compared to the other protocols. This improvement is primarily due to the hybrid routing strategy and the involvement of LCH nodes, which help reduce energy-intensive long-range transmissions and allow more nodes to remain active for longer periods. Consequently, the higher throughput corresponds to more efficient data delivery to the BS, reduced packet loss, and better utilization of the network’s available energy throughout its operational lifetime.
Fig. 11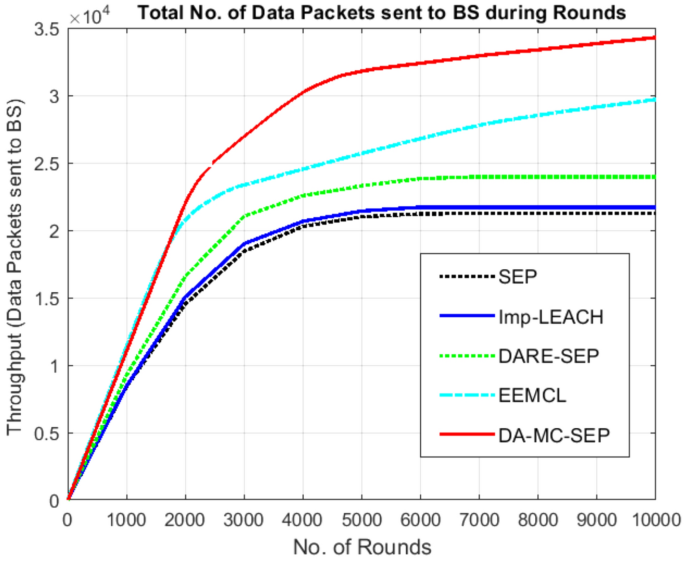
Total number of data packets sent to the BS (Throughput) versus rounds for DA-MC-SEP, SEP, Imp-LEACH, DARE-SEP, and EEMCL, showing the data delivery over time.
Figure 12 shows the comparison of PDR percentage versus the number of sensor nodes for the proposed DA-MC-SEP protocol and the SEP, Imp-LEACH, DARE-SEP, and EEMCL protocols. The results indicate that DA-MC-SEP achieves a higher PDR compared to the existing approaches. This improvement is associated with the hybrid single-hop and multi-hop transmission strategy, which helps optimize routing paths and reduce the impact of premature node death, a frequent cause of significant data flow disruptions in SEP, Imp-LEACH, DARE-SEP, and EEMCL protocols.
Fig. 12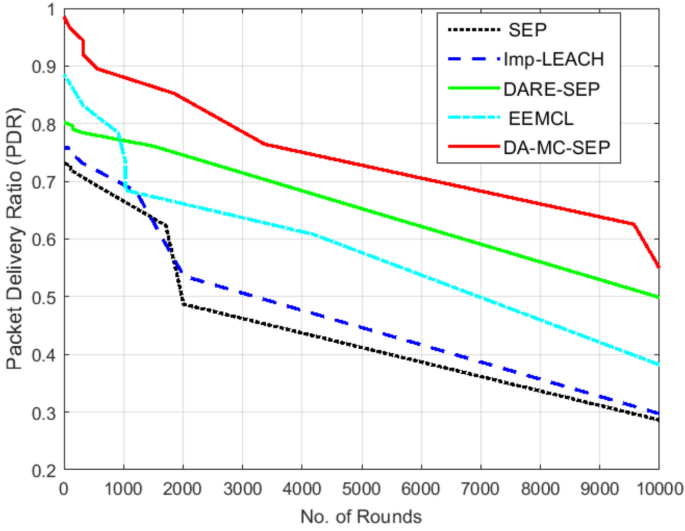
Packet delivery ratio (PDR) versus the number of sensor nodes for DA-MC-SEP, SEP, Imp-LEACH, DARE-SEP, and EEMCL. DA-MC-SEP uses 12 LCHs as relay nodes during data transmission.
Furthermore, the stable PDR curve of DA-MC-SEP demonstrates effective maintenance of link reliability. By employing Leader Cluster Heads (LCHs) for data aggregation and forwarding, the protocol reduces channel contention and interference during transmission. Consequently, even as network size increases, retransmission overhead remains low, ensuring consistent and high packet delivery rates under realistic communication conditions.
Figure 13 shows the total normalized remaining energy of the network over the simulation rounds. Since energy consumption is a critical metric in WSN routing, the instantaneous energy usage per round is compared across protocols. The total network energy for all protocols is set constant at 80 J for 100 SNs, according to the simulation setup. DA-MC-SEP aims to balance energy consumption across clusters. The results indicate that DA-MC-SEP maintains a higher level of remaining energy compared to SEP, Imp-LEACH, DARE-SEP, and EEMCL, from the start of network operation and throughout more than 10,000 rounds.
Fig. 13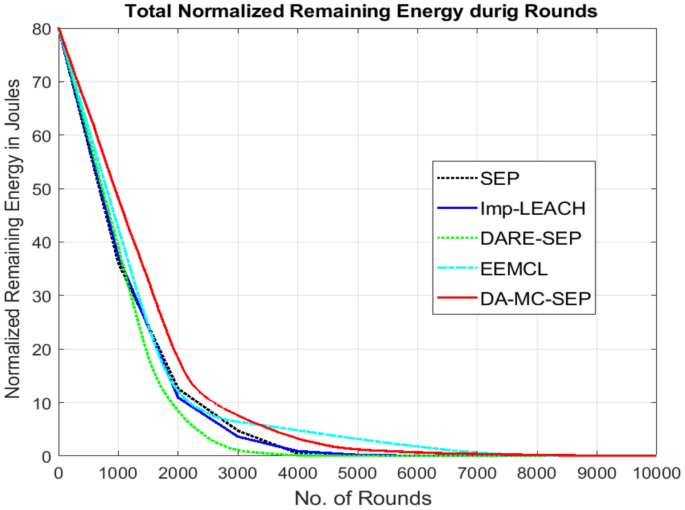
Total normalized remaining energy versus rounds for DA-MC-SEP, SEP, Imp-LEACH, DARE-SEP, and EEMCL under the considered simulation settings.
Figure 14 illustrates the standard deviation (SD) of cluster size, comparing DA-MC-SEP with SEP, Imp-LEACH, DARE-SEP, and EEMCL. DA-MC-SEP consistently achieves the lowest SD, remaining below 5 even as network density increases, indicating effective load balancing where cluster heads manage a comparable number of nodes, avoiding overload and enhancing energy stability.
Fig. 14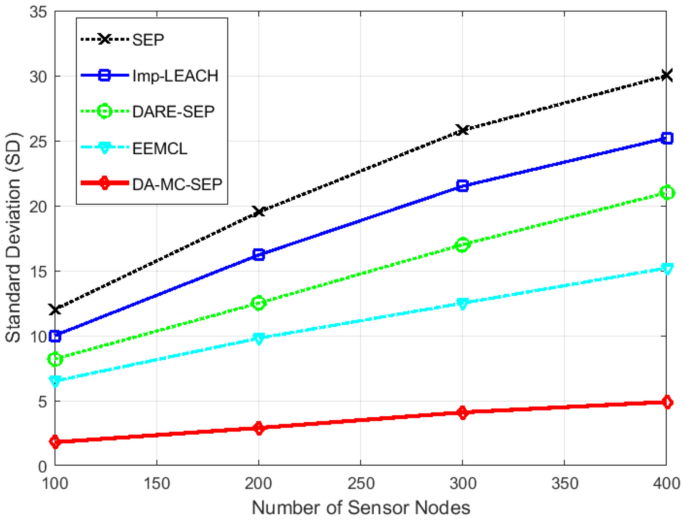
Standard deviation of cluster size versus the number of nodes for DA-MC-SEP, SEP, Imp-LEACH, DARE-SEP, and EEMCL, showing the variation in cluster size distribution among the protocols.
Figure 15 presents the average remaining energy per node role versus the number of rounds. While SEP and Imp-LEACH exhibit rapid and uneven energy depletion due to repeated and unbalanced role assignments, DA-MC-SEP demonstrates synchronized energy consumption among normal, advanced, and LCH-SN nodes, confirming fair role rotation.
Fig. 15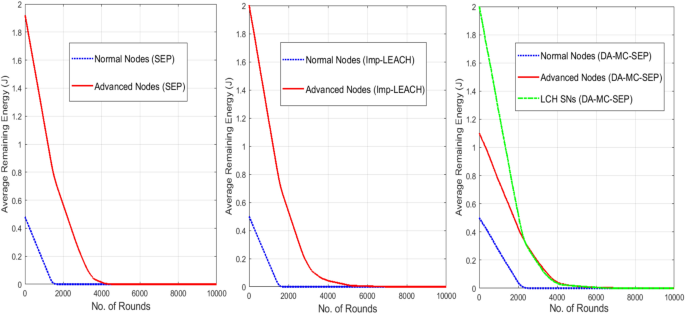
Comparative analysis of role-wise energy depletion, showing enhanced fairness and load balancing in DA-MC-SEP compared with SEP and Imp-LEACH.
The performance gains of DA-MC-SEP result from the joint contribution of its core components: distance-aware cluster-head election reduces transmission energy, residual-energy weighting prevents premature node failures, and the LCH-assisted forwarding mechanism balances the communication load. Removal of any of these components negatively affects network stability, lifetime, and packet delivery performance, this will be further explained in the next paragraph, as confirmed by the ablation study.
Ablation study and component analysis
In this section, an ablation study evaluates the contribution of each DA-MC-SEP component under the same network settings and energy model. Distance-awareness and residual-energy weighting mechanisms are disabled to assess their impact.
Figure 16 compares the full DA-MC-SEP, its ablated variant, SEP, and Imp-LEACH. The results (summarized in Table 4) show that removing these adaptive factors degrades network stability, lifetime, and energy balance, bringing performance closer to conventional protocols.
Fig. 16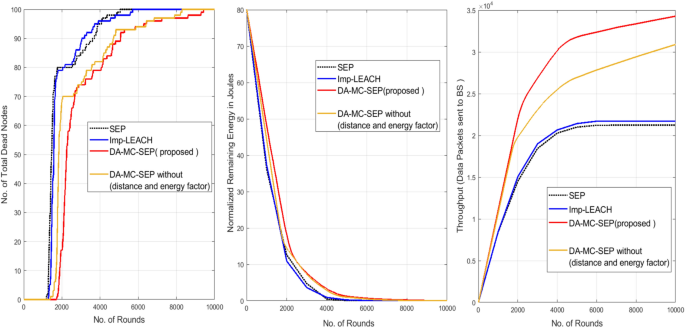
Presents the ablation study results and fairness/load-balancing comparison among SEP, Imp-LEACH, the proposed DA-MC-SEP, and DA-MC-SEP without distance and energy factors.
Table 4 Comparison of proposed protocol DA-MC-SEP with SEP, Imp-LEACH, and DA-MC-SEP (without distance and energy factor) against number of rounds.
In contrast, the complete DA-MC-SEP achieves uniform energy consumption, delayed node failures, and higher throughput. While the LCH layer structures clustering, distance-awareness and residual-energy weighting are key to preventing premature depletion and enhancing load balancing, as reflected in the balanced energy dissipation and prolonged stability observed in Fig. 16.
Sensitivity analysis of LCH count
The impact of the number of Leader Cluster Heads (LCHs) on network performance is evaluated to justify the selection of 12 LCHs. As shown in Fig. 17, different LCH densities affect energy consumption and network stability.
Fig. 17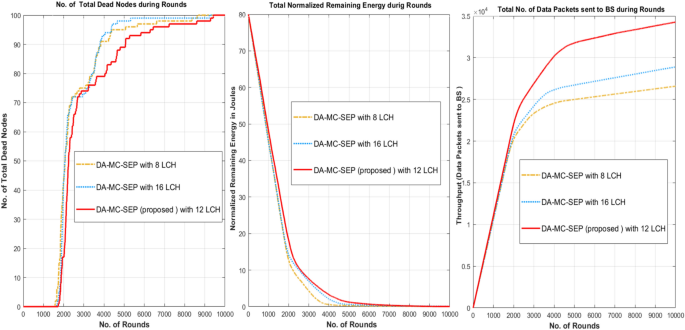
Sensitivity analysis of DA-MC-SEP under different numbers of LCHs (8, 12, and 16), showing their effect on network stability, energy consumption, and data transmission over the simulation.
A lower LCH count (8%) leads to longer transmission distances and earlier energy depletion, particularly for distant nodes. In contrast, a higher LCH count (16%) increases coordination overhead and control packet exchange, which reduces efficiency in early rounds. The 12% configuration provides a balanced trade-off between communication cost and energy consumption, with a stability period (FDN) of 1755 rounds compared to 1577 and 1660 rounds for 8% and 16%, respectively. The results (summarized in Table 5) further support these observations. Figure 17 compares dead nodes, normalized remaining energy, and data packets transmitted to the Base Station (BS). The results show that the 12-LCH configuration maintains more consistent energy consumption and delivers a higher number of packets compared to the other configurations, indicating improved network stability and data transmission performance.
Table 5 Comparison of DA-MC-SEP under different LCH configurations (8, 12, and 16 LCHs) in terms of FDN, HDN, LDN, and throughput.Computational complexity and quantitative overhead analysis
The efficiency of the proposed DA-MC-SEP protocol is evaluated through a formal analysis of its computational complexity and communication overhead, utilizing the specific network parameters defined in Table 2.
Computational complexity
The complexity is assessed per sensor node (SN) per round. Each SN performs local arithmetic operations to calculate its election probability \({P}_{i}\) and the distance-aware threshold. Since these calculations (multiplication, division, and comparison) involve a constant number of steps, the time complexity per node is \(O(1)\). For a network of n = 100 nodes, the total computational complexity per round is \(O(n)\). This linear complexity is identical to baseline protocols such as SEP and LEACH, ensuring the protocol is computationally lightweight for energy-constrained SNs.
Message complexity
DA-MC-SEP maintains a message complexity of \(O(n)\), consistent with classical clustering protocols. The communication flow follows a structured setup phase. The introduction of the LCH SNs (v = 0.12) introduces a small number of additional coordination messages (approximately \(v \text{x} n=12\) messages per round), which does not alter the overall complexity class.
Quantitative overhead estimation
To provide a numerical assessment, the overhead is measured by the ratio of total control packets (CP) to data packets (K) transmitted per round. Given CP = 160 bits and K = 4000 bits, the baseline overhead for a standard protocol is 4%. In DA-MC-SEP, the introduction of the LCH SNs adds coordination messages for the \(v \text{x} n\) nodes. The total overhead ratio is calculated as follows:
$$Overhead Ratio =\frac{\left(n+\left(v x n\right)\right) x CP}{n x K}=\frac{\left(100+12\right) x 160 }{100 x 4000 }\approx 4.48\text{\%} $$
(19)
This low ratio confirms that the control overhead is minimal. Furthermore, with \(Eelec= 50 \text{n}\text{J}/\text{b}\text{i}\text{t}\), the energy consumed by this overhead is approximately = \(\text{T}\text{o}\text{t}\text{a}\text{l} \text{B}\text{i}\text{t}\text{s} \text{x} Eelec=8.96 x{10}^{-4} \text{J}\) ,which is negligible compared to the total initial system energy of 80 J.
Energy–overhead trade-off
Although the distance-aware mechanism and LCH introduce minor additional steps, this cost is outweighed by the reduction in transmission energy. By optimizing transmission distances and balancing the load among nodes, DA-MC-SEP achieves higher data throughput within the same 80 J budget, demonstrating that the energy spent on coordination effectively extends network longevity.
Impact on clustering stability
As illustrated in Fig. 14, the lower variance in cluster size confirms that the introduced overhead supports balanced clustering. This leads to a more stable and fair network performance compared to SEP and Imp-LEACH, as the coordination overhead effectively prevents the early depletion of low-energy nodes.
Overall, these quantitative results indicate that the additional computational and communication overhead remains limited (≈4.48%), while the proposed protocol contributes to improved energy efficiency, fairness, and network lifetime. A quantitative comparison between the proposed DA-MC-SEP protocol and the baseline SEP protocol is summarized in Table 6.
Table 6 Quantitative complexity and overhead comparison (n = 100, K = 4000, CP = 160).