
Baseline Maps
Figures 1 and 2a illustrate the area percentage of drought susceptibility classes across three agricultural periods: Kharif-1, Kharif-2, and Rabi, categorized into very low, low, moderate, high, and very high drought susceptibility. Kharif-1 exhibited the highest susceptibility in the very high category (34.21%), followed by high (27.12%), indicating a significant drought risk during this period. The high proportion of very high drought susceptibility suggests that this season experiences pronounced water stress, which may influence agricultural productivity. In Kharif-2, the high susceptibility category dominated (55.64%), followed by very high (24.74%), indicating that drought susceptibility remains a significant concern during this period. The Rabi period exhibited a more balanced distribution, with the highest percentage in the very low category (23.64%), suggesting relatively lower drought susceptibility. However, the presence of significant areas in the high (25.19%) and very high (24.09%) categories indicates that drought conditions persist in many regions, requiring careful water management strategies to mitigate risks.
Fig. 1: Baseline maps of water-related stressors.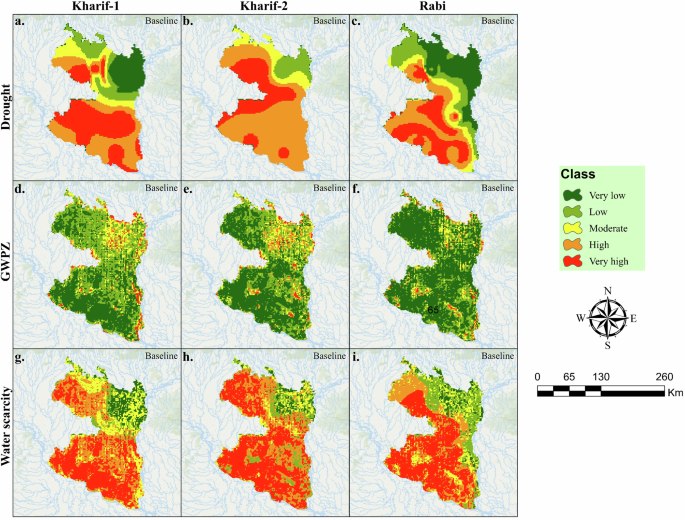
This figure shows a–c drought susceptibility, d–f groundwater potential zones (GWPZ), and g–i water scarcity distribution during the Kharif-1, Kharif-2, and Rabi seasons. Each map is classified into five categories—very low, low, moderate, high, and very high—representing the intensity levels of each stressor across the study region.
Fig. 2: Area distribution across baseline water stress categories.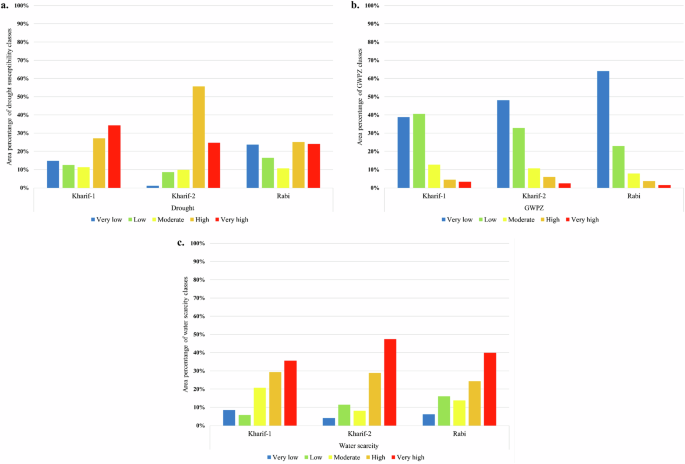
Panels show the percentage of the study area classified under different levels of a drought susceptibility, b groundwater potential zones (GWPZ), and c water scarcity during the Kharif-1, Kharif-2, and Rabi seasons. Each bar indicates the proportion of land within five categories—very low, low, moderate, high, and very high—capturing the intensity of water-related stressors across seasons.
Figures 1 and 2b illustrate the GWPZ classifications for Kharif-1, Kharif-2, and Rabi, categorized into very low, low, moderate, high, and very high. During Kharif-1, the low (40.57%) and very low (38.84%) categories were dominant, suggesting that groundwater potential is largely constrained in this season. Kharif-2 exhibited a further decline in groundwater potential, with very low groundwater potential areas covering 48.06% of the study region, indicating significant limitations in groundwater availability during this period. The Rabi period had the highest proportion of very low groundwater potential areas (64.06%), highlighting a further reduction in groundwater resources, which may be linked to seasonal variations and increasing extraction pressures. The trends across all three agricultural periods indicate persistent groundwater constraints, particularly in Kharif-2 and Rabi, which necessitate effective groundwater conservation and management strategies.
Figures 1 and 2c illustrate the water scarcity classifications for Kharif-1, Kharif-2, and Rabi, categorized into very low, low, moderate, high, and very high. Kharif-1 recorded the highest percentage of areas in the very high (35.63%) and high (29.28%) categories, indicating significant water scarcity risks in this period. In Kharif-2, the very high category was dominant (47.42%), followed by high (28.94%), suggesting even greater water scarcity in this season. The Rabi period also exhibited persistent water scarcity, with very high (39.84%) and high (24.38%) categories remaining prominent, indicating that water shortages continue post-monsoon. These findings highlight the seasonal variation in water scarcity and emphasize the need for targeted water management strategies, particularly during Kharif-2 and Rabi, to mitigate severe water shortages.
Validation of baseline drought, GWPZ, water scarcity maps
Figure 3 presents the total operating characteristic (TOC) and area under the curve (AUC) for various GWPZ and drought conditions across different agricultural periods: Kharif-1, Kharif-2, and Rabi. The AUC values, which are a measure of the accuracy of the model, are indicated for each scenario. For GWPZ during Kharif-1, the AUC was 0.8329, indicating a high model accuracy in predicting groundwater potential. In Kharif-2, the GWPZ AUC dropped to 0.7006, reflecting a lower predictive accuracy, potentially due to increased variability in groundwater levels during this period. For Rabi, the GWPZ AUC was 0.7283, indicating a moderate accuracy.
Fig. 3: Performance of TOC and AUC for GWPZ and drought conditions by season.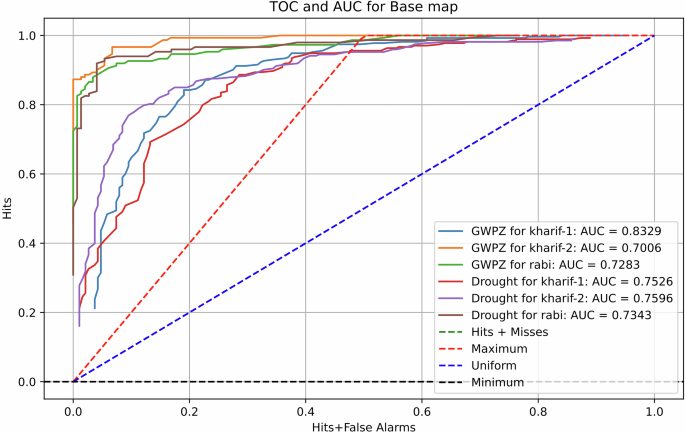
Panels show the TOC curves and AUC values for GWPZ and drought susceptibility during the Kharif-1, Kharif-2, and Rabi seasons, illustrating the model’s performance across different agricultural seasons.
The drought prediction models also varied in accuracy; Kharif-1 had an AUC of 0.7526, Kharif-2 had an AUC of 0.7596, and Rabi had an AUC of 0.7343. These values suggest that the drought models are reasonably effective, with the highest accuracy in Kharif-2, possibly because of more distinct drought patterns during the peak agricultural season. The TOC curves further illustrate the relationship between hits and false alarms, with lines closer to the top-left corner indicating better performance. The “Hits + Misses” line represents the ideal model performance, while the “Maximum,” “Uniform,” and “Minimum” lines provide benchmarks for evaluating model accuracy. Overall, the high AUC values for the GWPZ and drought models during Kharif-1 and Kharif-2 suggest strong model performance, aiding in reliable water scarcity prediction and resource management.
In addition, Table 1 presents the performance metrics (R², RMSE, and mean absolute error (MAE)) for predicting drought and GWPZ across different seasons (Kharif-1, Kharif-2, and Rabi) during training and testing phases. Drought prediction shows high accuracy, with R² values above 0.94 across all seasons, and the best performance in Kharif-2 (R² = 0.9702, RMSE = 0.0719). GWPZ predictions also demonstrate strong reliability, with R² values above 0.91, slightly lower than drought predictions, but still within an acceptable range. Testing phase results remain consistent with training, indicating robust model performance.
Table 1 Performance metrics (R², RMSE, and MAE) for drought and GWPZ predictions across different seasons (Kharif-1, Kharif-2, and Rabi) during training and testing phases
Additionally, the validation results confirm the high reliability of the water scarcity map across all seasons, with strong agreement observed between our classification and the reference map developed using catastrophe theory (Fig. S1). The Cohen’s Kappa (κ) coefficient indicates the highest agreement in Kharif-1 (0.9649), followed by Rabi (0.9200) and Kharif-2 (0.8975), reflecting the model’s accuracy in capturing seasonal water scarcity variations (Table S1). Similarly, the R² values further support the model’s predictive strength, with Kharif-1 (0.9353) showing the best performance, followed by Rabi (0.8659) and Kharif-2 (0.8223), suggesting slightly higher seasonal variability in Kharif-2 due to fluctuations in groundwater recharge and surface water availability. The standard deviation values, lowest in Kharif-1 (0.1080) and highest in Rabi (0.1632), indicate greater variability in water scarcity levels during the dry season. Overall, these results validate the robustness and accuracy of the model, with high classification agreement and predictive performance, making it a reliable tool for assessing seasonal water scarcity.
Future projections of drought susceptibility
Figures 4, 5, and S2 illustrate the area percentage of drought susceptibility classes for the Kharif-1, Kharif-2, and Rabi seasons under different SSPs for the years 2070 and 2100. The drought susceptibility classes were categorized into very low, low, moderate, high, and very high.
Fig. 4: Projected drought susceptibility for the year 2070.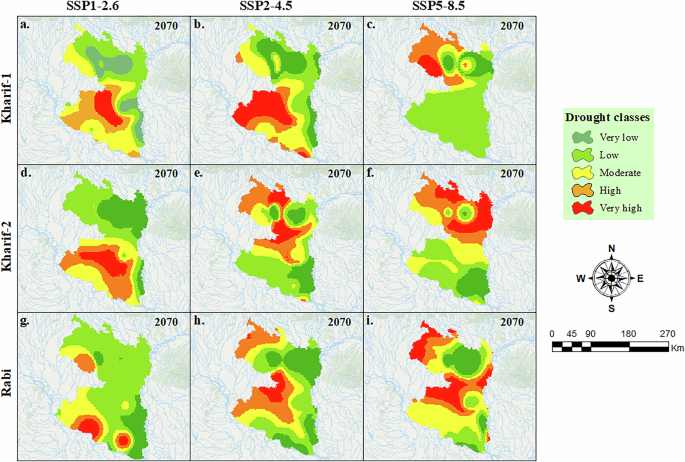
The map illustrates future drought susceptibility under climate change scenarios (e.g., SSP1-2.6, SSP2-4.5, and SSP5-8.5), highlighting spatial variation in drought risk by 2070 for Kharif-1 a–c, Kharif-2 d–f, and Rabi g–i. Color gradients represent different susceptibility classes.
Fig. 5: Area distribution of drought susceptibility under SSPs across seasonal periods.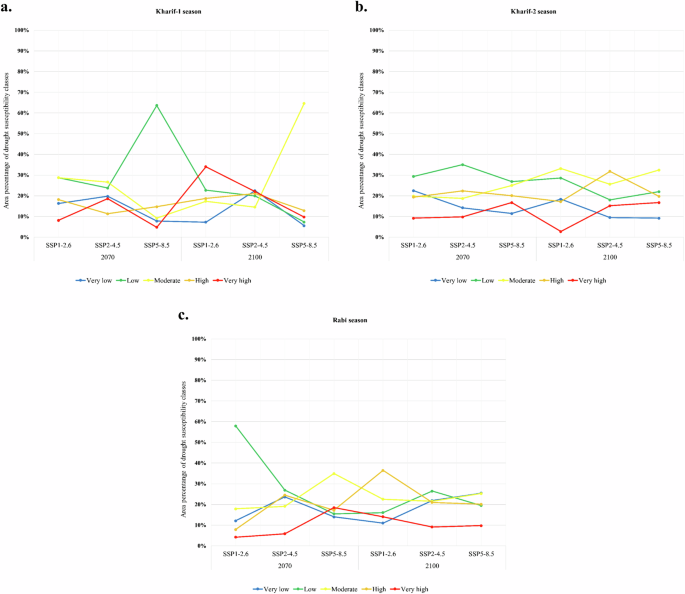
Line charts show the percentage area under various drought susceptibility levels for a Kharif-1, b Kharif-2, and c Rabi, based on different shared socioeconomic pathways (SSPs). Each line reflects the spatial impact per scenario and season.
In the Kharif-1 season, moderate and low susceptibility classes dominated most SSP scenarios. By 2070, under SSP1-2.6, both the low (28.72%) and moderate (28.73%) classes showed nearly equal distribution, while SSP5-8.5 saw a sharp increase in the low class to 63.61%. By 2100, the very high class significantly increases under SSP1-2.6 (34.01%), indicating a growing risk of severe droughts in this scenario. These shifts suggest that climate mitigation efforts can substantially reduce or exacerbate drought susceptibility.
For the Kharif-2 season, drought susceptibility remained relatively stable across the scenarios. The low and moderate classes generally maintain higher percentages, with the very high class peaking under SSP2-4.5 in 2070 (9.78%). By 2100, the percentages reflect similar trends with the moderate class remaining significant, but the very high class slightly increases under SSP5-8.5 (16.73%). This indicates that while the overall drought susceptibility does not drastically change, there is still a notable risk under the highest emission scenarios.
Marked variability in drought susceptibility was observed during the rabi season. In 2070, the low class is most prominent under SSP1-2.6 (57.95%), suggesting a lower drought risk with strong mitigation efforts. However, under SSP5-8.5, the moderate class increased by 34.90%. By 2100, there was a noticeable increase in the high and very high classes under SSP2-4.5 (36.43% and 18.45%, respectively), indicating heightened drought risk under this scenario. This variability underscores the critical impact of long-term climate projections on drought-risk management.
These figures collectively highlight the influence of different climate scenarios and future projections of drought susceptibility. The variations across SSPs and timeframes suggest that strong mitigation efforts (SSP1-2.6) can significantly reduce drought risks, whereas high-emission scenarios (SSP5-8.5) exacerbate susceptibility, especially in the Kharif-1 and Rabi seasons. Understanding these trends is essential for developing adaptive strategies to mitigate the impacts of drought under changing climatic conditions.
Future projections of GWPZ
Figures 6, 7, and S3 depict the area percentage of GWPZ classes for the Kharif-1, Kharif-2, and Rabi seasons under different SSPs for the years 2070 and 2100, providing insights into groundwater availability.
Fig. 6: Projected groundwater potential zones (GWPZ) for the year 2070.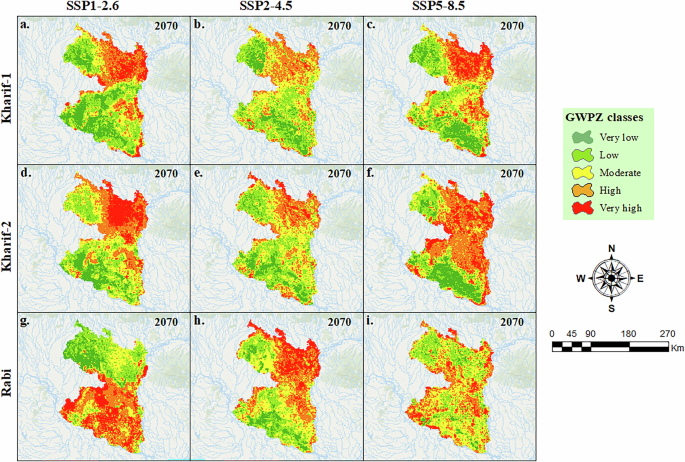
The map shows future GWPZ distribution under climate scenarios (e.g., SSP1-2.6, SSP2-4.5, and SSP5-8.5), illustrating spatial shifts in groundwater availability by 2070 for Kharif-1 a–c, Kharif-2 d–f, and Rabi g–i. Color codes represent different potential zones.
Fig. 7: Area percentages of GWPZ classes for Kharif-1, Kharif-2, and Rabi seasons.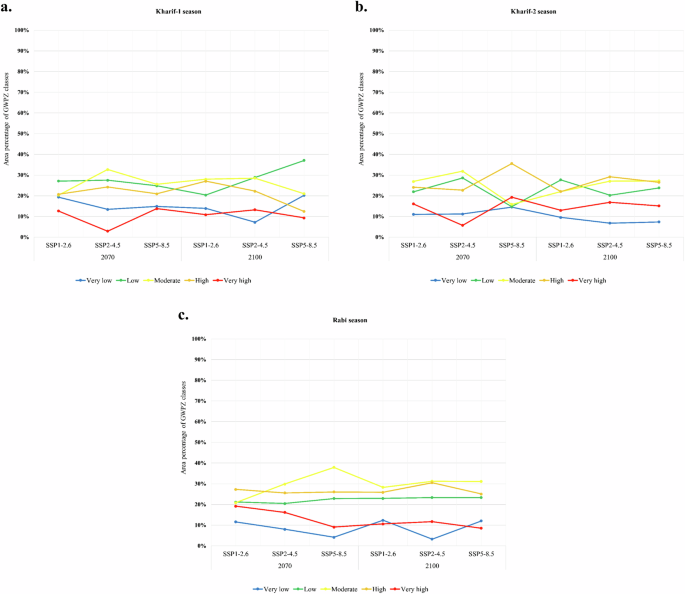
The figure shows the line charts of the area percentage of GWPZ classes (very low, low, moderate, high, and very high) under different SSPs for the years 2070 and 2100, providing insights into future groundwater availability for each specified season: a Kharif-1, b Kharif-2, and c Rabi.
During the Kharif-1 season in 2070, the moderate class was highest under SSP2-4.5 (32.66%), indicating substantial groundwater potential. The very low class was lowest under SSP2-4.5 (13.38%), suggesting minimal areas with poor groundwater availability. By 2100, the low class increases under SSP5-8.5 (37.09%), indicating an improvement in groundwater potential, whereas the very low class was highest under SSP2-4.5 (7.17%). This trend suggests that different emission scenarios significantly impact groundwater recharge, with high emissions potentially improving groundwater availability owing to increased variability in precipitation.
During the Kharif-2 season in 2070, the moderate class remained significant under SSP2-4.5 (31.86%) and SSP5-8.5 (38.16%), indicating a stable groundwater potential. The very low class was lowest under SSP5-8.5 (14.55%). By 2100, the moderate class remains prominent under SSP5-8.5 (31.44%), while the high class increases under SSP2-4.5 (30.17%). These patterns suggest that while groundwater potential remains relatively stable, high-emission scenarios could enhance groundwater recharge.
During the Rabi season in 2070, the moderate class was highest under SSP5-8.5 (37.92%), reflecting significant groundwater potential. The very low class was lowest under SSP5-8.5 (4.10%), suggesting fewer areas with poor groundwater availability. By 2100, the moderate class remained high under SSP2-4.5 (31.18%) and SSP5-8.5 (31.08%), while the high class peaked under SSP2-4.5 (30.53%). This indicates that the groundwater potential may improve under high-emission scenarios, but variability remains a concern.
The figures collectively demonstrate that different climate scenarios significantly influence the groundwater potential. High-emission scenarios (SSP5-8.5) tend to show improved groundwater recharge and potential, possibly due to increased precipitation variability. Understanding these trends is crucial for developing adaptive groundwater management strategies to ensure sustainable groundwater availability under changing climate conditions.
Future projections of water scarcity
Figures 8, 9, and S4 illustrate the area percentage of water scarcity classes for the Kharif-1, Kharif-2, and Rabi seasons under different SSPs for the years 2070 and 2100. The water scarcity classes were categorized into very low, low, moderate, high, and very high, providing insights into future water availability and risks.
Fig. 8: Projected water scarcity distribution for the year 2070.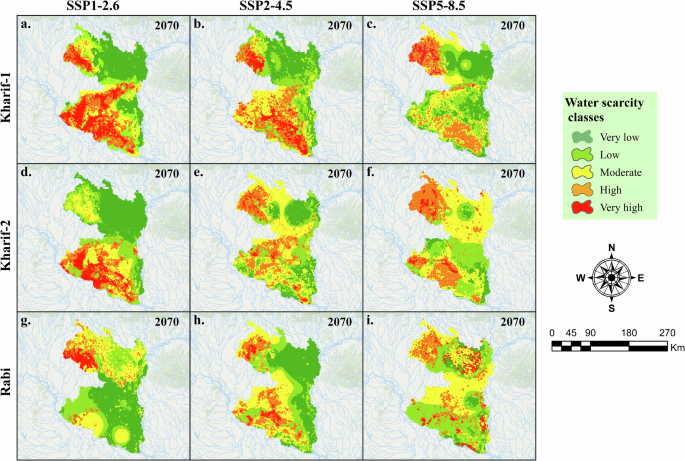
The map shows future water scarcity patterns under climate scenarios (e.g., SSP1-2.6, SSP2-4.5, and SSP5-8.5), highlighting spatial variations in water scarcity levels by 2070 for Kharif-1 a–c, Kharif-2 d–f, and Rabi g–i. Color gradients represent varying levels of water stress.
Fig. 9: Area distribution of water scarcity levels across seasonal periods.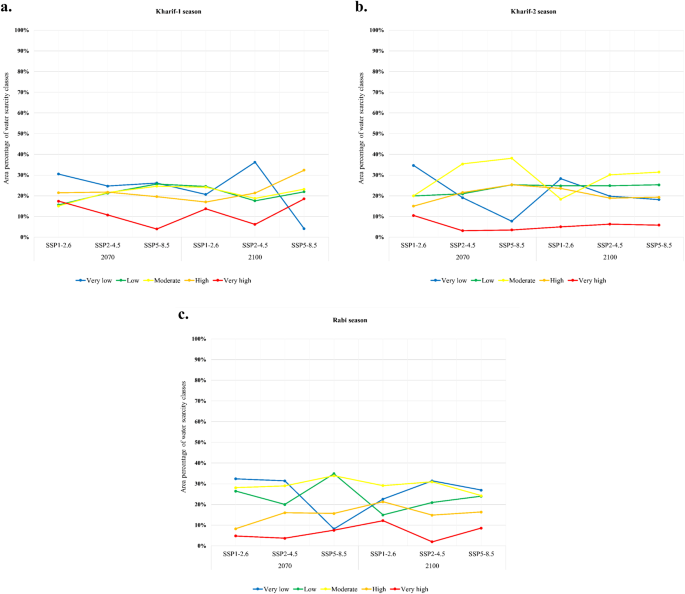
The figure shows line charts depicting the percentage area under different water scarcity classes (e.g., very low, low, moderate, high, and very high) for a Kharif-1, b Kharif-2, and c Rabi seasons. Each chart highlights the seasonal variations in water stress across the specified periods.
During the Kharif-1 season in 2070, the very low water scarcity class is highest under SSP1-2.6 (30.53%), indicating a lower risk of water scarcity due to effective mitigation efforts. Conversely, the very high class was lowest under SSP2-4.5 (10.7%), suggesting moderate risk. By 2100, the very low-class peaks under SSP2-4.5 (36.19%) and drastically drops under SSP5-8.5 (4.07%), highlighting the severe impact of high emission scenarios on increasing water scarcity. This trend suggests that stringent climate policies can significantly mitigate water scarcity, whereas high emissions can exacerbate water scarcity.
During the Kharif-2 season in 2070, the moderate water scarcity class was highest under SSP5-8.5 (38.16%), indicating considerable water scarcity risk. The very low class under SSP5-8.5 was notably low (7.73%), reflecting high scarcity. By 2100, the moderate class remains prominent under SSP5-8.5 (31.44%), with very low water scarcity under SSP1-2.6 (28.26%), indicating that high emission scenarios maintain high water scarcity risks. These patterns underscore the sustained risk of water scarcity in high-emission scenarios, particularly during peak agricultural seasons.
During the Rabi season in 2070, the very low class was highest under SSP1-2.6 (32.41%) and SSP2-4.5 (31.37%), and lowest under SSP5-8.5 (8.18%). The moderate class under SSP5-8.5 was significant (37.92%), suggesting persistent moderate water scarcity. By 2100, the very low class is reduced under SSP5-8.5 (12.38%), while the high class increases under SSP2-4.5 (30.53%), indicating a shift towards higher water scarcity risks. These findings suggest that without stringent climate mitigation, the rabi season will face increased water scarcity.
The figures collectively highlight that different climate scenarios significantly influence water scarcity levels. Strong mitigation efforts (SSP1-2.6) can substantially reduce water scarcity risks, whereas high-emission scenarios (SSP5-8.5) exacerbate water scarcity, particularly during critical agricultural periods. Understanding these trends is vital for developing adaptive water management strategies to ensure sustainable water availability under various future climate conditions.
Figure 10 illustrates the percentage change in the area of different water scarcity classes from 2070 to 2100 under various SSPs for the Kharif-1, Kharif-2, and Rabi seasons. During the Kharif-1 season, the very low class increased by 9.91% under SSP1-2.6, and 22.08% under SSP5-8.5, indicating a reduction in water scarcity with both strong mitigation and high emission scenarios. Conversely, the very high class decreased by 14.53% under SSP5-8.5, suggesting that extreme water scarcity was reduced in high emission scenarios, likely due to increased precipitation variability. The moderate class showed minor changes, indicating stability data moderate water scarcity risk.
Fig. 10: Projected percentage change in water scarcity area from 2070 to 2100 under SSPs.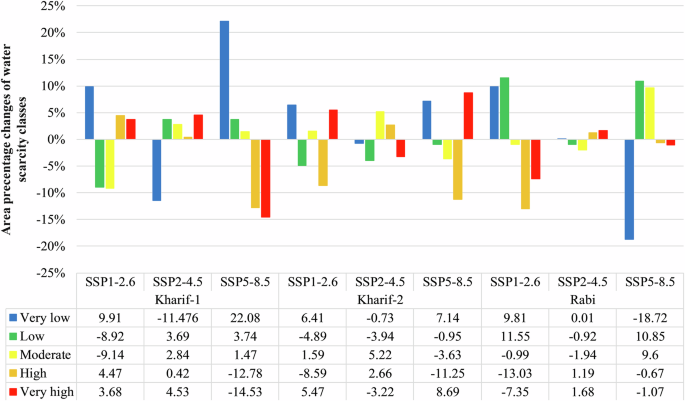
Bar charts show the change in the area for each water scarcity class between 2070 and 2100 across different shared socioeconomic pathways (SSPs), highlighting long-term trends in water stress.
During Kharif-2 season, the very low class increases slightly under SSP1-2.6 (6.41%) and SSP5-8.5 (7.14%), reflecting a slight reduction in water scarcity. The very high class fluctuated, with a decrease of 3.22% under SSP2-4.5, and an increase of 8.69% under SSP5-8.5, indicating varying impacts on extreme water scarcity. These patterns suggest that high-emission scenarios may increase water availability variability, thereby affecting scarcity levels.
During the Rabi season, the very low class showed a significant decrease under SSP5-8.5 (−18.72%), indicating a rise in water scarcity. The low class increases notably under SSP1-2.6 (11.55%) and SSP5-8.5 (10.85%), suggesting improved water availability under both strong mitigation and high emission scenarios. The high class decreases under SSP1-2.6 (−13.03%), showing reduced water scarcity with effective mitigation efforts.
The percentage changes in water scarcity classes from 2070 to 2100 revealed that both strong mitigation (SSP1-2.6) and high emission scenarios (SSP5-8.5) can influence water scarcity differently across seasons. Strong mitigation efforts generally reduce water scarcity, whereas high emission scenarios increase variability in water availability, which can either alleviate or exacerbate water scarcity depending on the season. These trends underscore the need for adaptive water management strategies tailored to specific future climatic conditions to ensure sustainable water availability.
Validation of future projected drought and GWPZ maps
Figure 11 illustrates the TOC and AUC for drought conditions and GWPZ across Kharif-1, Kharif-2, and Rabi seasons under different SSP scenarios for the years 2070 and 2100. These metrics provide insights into model performance for predicting drought and groundwater potential.
Fig. 11: TOC and AUC performance for future drought and GWPZ projections by season.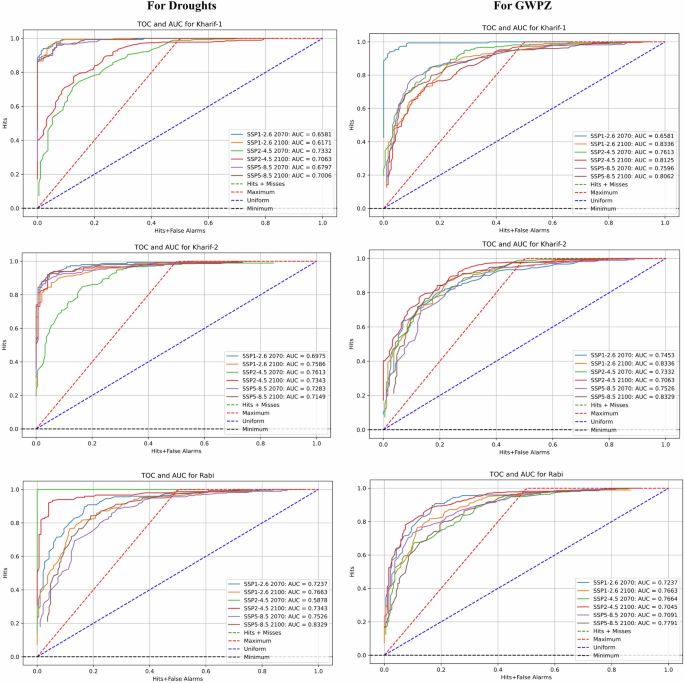
Panels display total operating characteristic (TOC) curves and area under the curve (AUC) values for projected drought and GWPZ susceptibility during Kharif-1, Kharif-2, and Rabi seasons, reflecting model accuracy across different future seasonal scenarios.
For the Kharif-1 season, the AUC values for drought indicate the model accuracy for different SSPs. For instance, SSP1-2.6 in 2070 has an AUC of 0.6581, which improves to 0.8336 by 2100, showing a better predictive performance with mitigation efforts. SSP2-4.5 shows a slight decrease from 0.7613 in 2070 to 0.7063 in 2100, indicating variability in the model performance. The higher AUC values under SSP5-8.5 (0.7596 in 2070 and 0.8062 in 2100) suggest robust performance in high emission scenarios, potentially due to increased variability in climate conditions enhancing model training data. For the Kharif-2 season, SSP1-2.6 showed an improvement from an AUC of 0.7453 in 2070 to 0.8336 in 2100, indicating enhanced model reliability with strong mitigation. SSP2-4.5 and SSP5-8.5 exhibited stable performance, with AUC values of approximately 0.7332 and 0.7526 in 2070, improving slightly by 2100. These trends suggest that the model’s ability to predict drought conditions improves with both mitigation and high-emission scenarios, although mitigation provides more consistent improvements. For the Rabi season, SSP1-2.6 and SSP2-4.5 showed AUC values of 0.7237 and 0.7664 in 2070, respectively, improving to 0.7663 and 0.7045 by 2100, respectively. SSP5-8.5 demonstrated notable improvements with AUC values of 0.7091 in 2070 and 0.7791 in 2100, indicating the model’s adaptability to high-variability conditions. Overall, the Rabi season models showed improved performance over time, particularly under high-emission scenarios.
The AUC values for GWPZ indicated a good predictive performance across different SSPs. In the Kharif-1 season, SSP2-4.5 in 2070 showed an AUC of 0.7613, and SSP5-8.5 in 2100 reached 0.8062, suggesting that the models performed well in predicting groundwater potential under varying climate scenarios. For the Kharif-2 season, the AUC values remained high for SSP1-2.6, improving from 0.7453 in 2070 to 0.8336 in 2100, indicating reliable predictions with mitigation. SSP5-8.5 shows a strong performance, with AUC values improving from 0.7526 in 2070 to 0.8329 in 2100. The stable and high AUC values across the scenarios highlight the robustness of the model in predicting groundwater potential during the Kharif-2 season. For the Rabi season, SSP1-2.6 and SSP5-8.5 exhibited consistent AUC improvements, indicating an enhanced model accuracy over time. The AUC values reflect the model’s strong predictive capability for groundwater potential, with high performance under both mitigation and high-emission scenarios.
In summary, the TOC and AUC analyses demonstrate that the models for predicting drought conditions and GWPZ perform well across different SSP scenarios. Mitigation efforts (SSP1-2.6) generally improve model accuracy over time, while high-emission scenarios (SSP5-8.5) also show strong performance due to increased variability in climate conditions. These trends underscore the importance of adaptive management strategies to ensure reliable predictions and effective resource management under changing climatic conditions.
Tables S2 and S3 illustrate the model performance metrics for drought and GWPZ predictions under SSP1-2.6, SSP2-4.5, and SSP5-8.5 across three agricultural seasons (Kharif-1, Kharif-2, and Rabi) for the year of 2070 and 2100. The table presents R², RMSE, and MAE for both training and testing phases, indicating the model’s predictive accuracy. The results show strong predictive accuracy for both drought and GWPZ across all SSPs, with variations in performance influenced by seasonal dynamics and climate scenarios.