
Data sourcesSugar-sweetened beverage intake
We used dietary intake and demographic data from the 2018 National Health and Nutrition Survey (ENSANUT by its acronym in Spanish), a nationally representative, cross-sectional, multi-stage survey representative at the national, regional, rural and levels. The design and methods of the ENSANUT 2018 had been described elsewhere [10]. The survey research protocol was approved by the ethics, biosafety, and research committees of the Mexican National Institute of Public Health.
Dietary intake was collected in a subsample of ENSANUT 2018 by trained interviewers using a validated food frequency questionnaire (FFQ) [11]. For each item, participants were asked to specify, on average, how often did they consume a common unit or portion size of a given food or beverage over the previous week. Data collected included: number of days, times per day, portion size, and number of portions consumed. For the analysis of all SSBs, we included homemade fruit drinks, homemade flavored drinks with sugar, regular soft drinks, industrialized fruit drinks, and industrialized flavored drinks with sugar; for the analysis of industrialized SSBs, the last three items were included. FFQ data for individuals aged 20 years and older was considered for the study (n = 16 978). Participants with non-valid dietary information as defined for ENSANUT by Ramírez, et al. [12] were excluded (n = 1 242). Our final analytic sample included 15 736 individuals, representing 79 223 787 Mexican adults in 2018. Flow chart is available in Supplementary Fig. 1.
Measures of association
We conducted a literature review to identify longitudinal studies and meta-analyses that studied the association between industrialized SSB intake and NCD risk. We included five NCDs with evidence of an increased risk associated with industrialized SSB intake: obesity [13], hypertension [13], type-2 diabetes [4, 14], cardiovascular diseases (ischemic heart disease and stroke) [15], and diet-related cancers (liver, prostate, ovary, gallbladder, kidney, colorectal, esophagus, postmenopausal breast, pancreas, endometrium, and stomach)[16] (Table S1: Magnitudes, characteristics, and data source of relative risk by NCD, in Appendix 1). We looked for studies that estimated the total effect of SSB intake on NCD risk, excluding studies that adjusted for BMI, since BMI is a mediator between SSB and NCD. For type-2 diabetes, we used the hazard ratio (HR) from a large longitudinal study in Mexico [14]. For the other diseases, no longitudinal studies were found in Mexico, so we relied on meta-analyses. For cancer, the most recent meta-analysis included studies that adjusted for BMI. Thus, we used a longitudinal study from Australia evaluating the association between SSB and diet-related cancers [16]. The measures of association for each disease standardized to 355 ml (1 serving) are available in Table S1: Magnitudes, characteristics, and data source of relative risk by NCD, in Appendix 1.
Incident cases
Incident cases were obtained from publicly available records for the 20–99-year-old population in Mexico (Table S3: Data source and incident cases by NCD, in Appendix 1). Incident cases of obesity, hypertension, type-2 diabetes, and cardiovascular disease were extracted from the 2018 Ministry of Health Morbidity Yearbook, which gathers data from the National Information System for Epidemiological Surveillance (SUIVE by its acronym in Spanish) [17]. The morbidity yearbook is an open-source database from the Ministry of Health that collates notified new cases in public and private hospitals at the national level. We could not find incident diet-related cancers within Mexican sources; therefore, we obtained them from the 2020 Global Cancer Observatory [18].
Direct healthcare costs
We used yearly direct healthcare costs per case which include ambulatory and hospital care at public health Mexican institutions for four NCDs: hypertension [19], type-2 diabetes [19], cardiovascular disease [20, 21], and diet-related cancers [20, 22] (Table S4: Data source and direct healthcare costs by NCD, in Appendix 1). Obesity costs were not considered in the analyses because they are already included in obesity-related co-morbidities costs, which could cause double counting. For cancers (ovarian, breast, endometrium, prostate, colorectal, esophagus, and pancreas), we estimated the corresponding proportion of diet-related cancer costs considering the number of cases for each cancer type. Costs from liver, gallbladder, kidney, and stomach cancers were not available for Mexico, so we could not include them in this estimation. To compare our costs with other studies, we converted Mexican pesos (MXN) from the year of study into Mexican pesos in 2018 using the national Consumer Price Index of the National Institute of Statistics and Geography (INEGI from its Spanish acronym). 2018 Mexican pesos were then converted into USD dollars using the average exchange rate for 2018 (Table S4: Data source and direct healthcare costs by NCD, in Appendix 1).
Statistical analysis
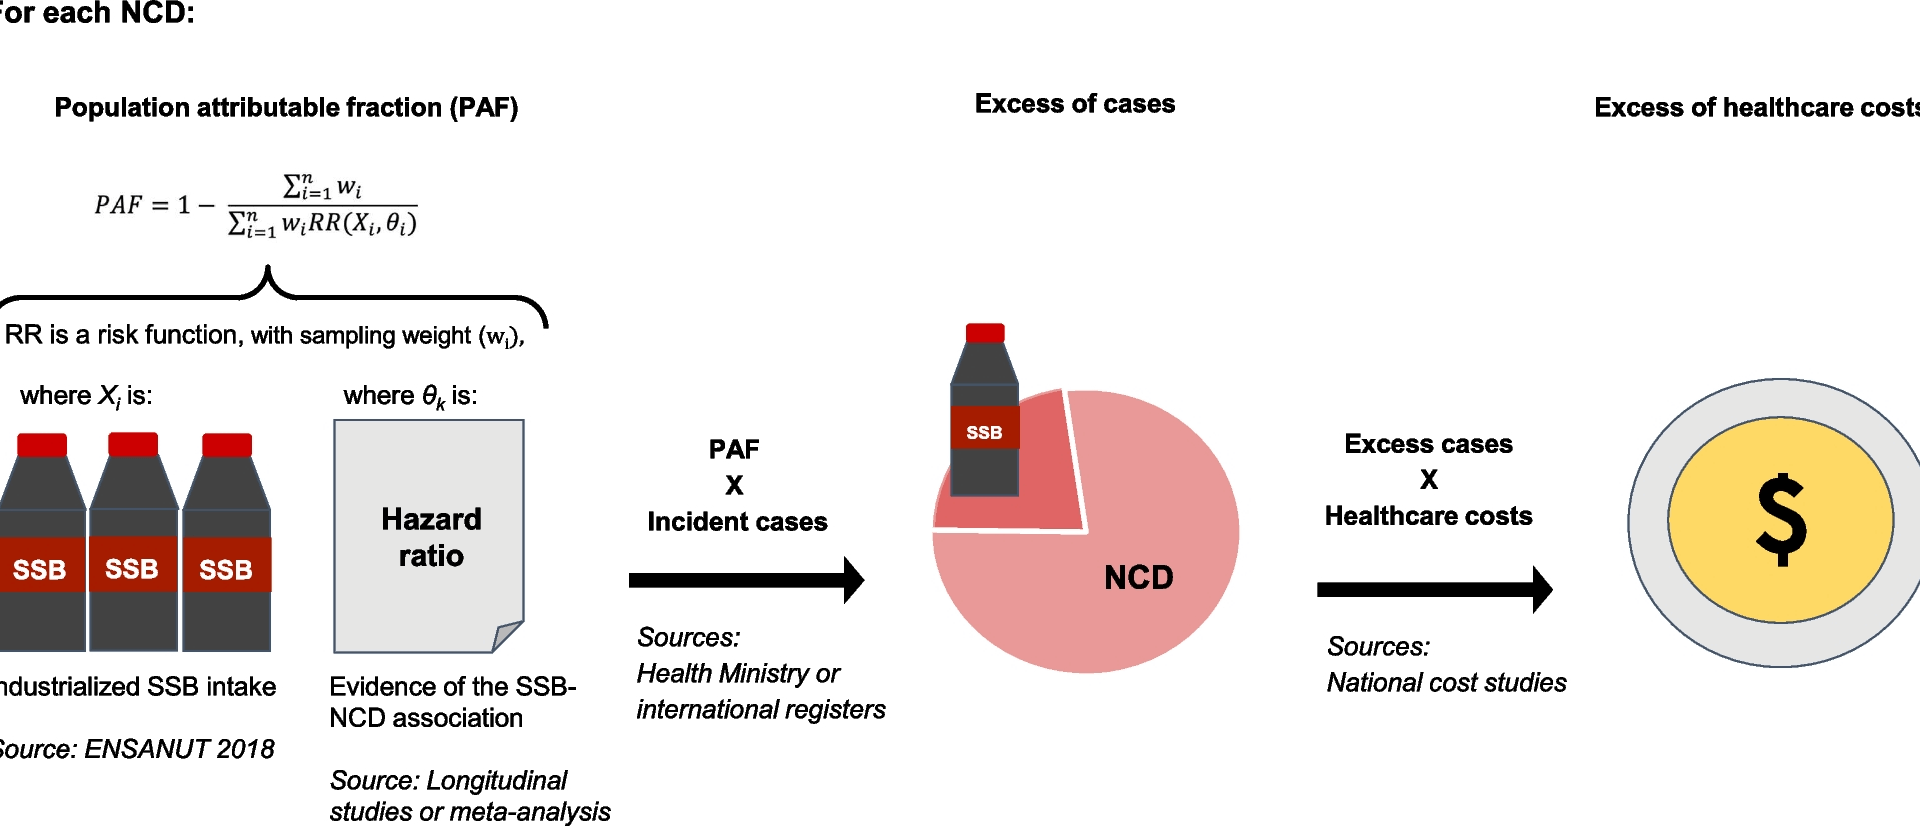
Figure 1 provides an overview of our modeling strategy. We estimated PAF for each disease, using the SSB intake distribution and the association measures from published literature. To estimate the number of excess cases by NCD, we multiplied the PAFs by the corresponding incidence cases reported in the Ministry of Health or international registries. Finally, we obtained excess costs by multiplying the excess cases by the annual direct healthcare costs. More details of the estimation process are described in the next subsections.
Fig. 1
Modeling strategy to estimate excess NCD cases and excess healthcare costs associated with industrialized SSB intake in Mexico. First, we estimated the distribution of SSB consumption in Mexico. We obtained hazard ratios from the literature to estimate the PAF. We then multiplied the PAF by the yearly incident cases to estimate excess cases. Excess cases were multiplied by yearly NCD diseases’ costs to estimate excess direct healthcare costs. PAF: Potential attributable fraction, NCD: Non-communicable chronic diseases, RR: Relative risk, SSB: Sugar-sweetened beverages, ENSANUT: National Health and Nutrition Survey. Details about the PAF equation are available in the methods section and Appendix 1
Estimation of population attributable fraction
In our study, the PAF quantifies the contribution of SSB intake to the burden of disease for five diseases by comparing the observed disease burden under current SSB consumption levels to a counterfactual scenario with no SSB intake. Each NCD was analyzed independently, without accounting for individuals who might experience NCDs multimorbidity, meaning the PAFs should not be summed across diseases to avoid double-counting preventable cases [23]. For each disease, individuals in the sample were assigned an incidence risk based on their SSB consumption; PAF was calculated using a non-parametric approach to estimate the proportion of cases attributable to SSBs (Sect. 1.3 in Appendix 1) [24]. Analyses were conducted in R software with the “pifpaf” package, developed by our research group and used the code set.seed(9371) for reproducible results [25]. Details about the estimation process are available in Appendix 1. We used population-weighted factors for all the statistical analyses and considered the survey’s complex sampling design.
Estimation of healthcare costs
For each selected disease, we estimated direct healthcare costs attributable to SSB intake. For this purpose, we multiplied the yearly direct healthcare costs per case by the number of incident cases attributable to SSB intake estimated for 2018.
Sensitivity analyses
We conducted three sensitivity analyses to evaluate the robustness of our findings. First, we used a meta-analytic relative risk (RR) for type-2 diabetes (RR = 1.42; 95%CI: 1.19, 1.69) (Table S1: Magnitudes, characteristics, and data source of relative risk by NCD, in Appendix 1), instead of the Mexican longitudinal estimate (HR = 1.27; 95%CI: 1.16, 1.38) because the Mexican study was conducted among women, and only included soft drinks. The RRs standardized to the same volume of SSBs in ml is available in Table S1: Magnitudes, characteristics, and data source of relative risk by NCD, in Appendix 1. Second, not all NCDs are notified to the national health registry, leading to underreporting; to estimate the potential impact of this underestimation we used estimated cases as reported by the Global Burden of Disease Study (GBD). To estimate incident cases in Mexico, the GBD study uses hospital discharge records, epidemiological surveillance records, and epidemiological studies, in addition to national health and nutrition surveys, representing an adequate alternative data source [21]. We extracted incident cases for type-2 diabetes, cardiovascular disease, and diet-related cancers from GBD (Table S3: Data source and incident cases by NCD, in Appendix 1). Incident cases of hypertension and obesity were not available in GBD and could not be subjected to sensitivity analysis. Third, we estimated PAFs by age group considering the incident cases by the five age groups reported in the Ministry of Health Morbidity Yearbook (20–24, 25–44, 45–59, 60–64 and 65 years), assuming constant relative risks within each age group (Table S5: Population attributable fraction, NCD cases associated to all SSBs by age group in Mexican adults and S6: Population attributable fraction, NCD cases associated to industrialized SSBs by age group in Mexican adults, in Appendix 1).