
An epidemiological cross-sectional study design was used, and data were collected from autumn 2021 until summer 2022 through an online questionnaire (Additional file 1).
Recruitment process
The recruitment process for the data collection started in spring 2021. Contact was made with Swedish companies (n = 15) in the private sector and with various trade unions (n = 15), primarily representing employees working in the private sector, to reach currently working individuals. Information about the study was provided at follow-up meetings and through emails. Private employers who agreed to support the project provided the employees’ email addresses. Unionized employees were invited to the survey through their trade union representatives via newsletters and emails. Municipalities and regional authorities (n = 136) were contacted to recruit participants working in the public sector in the same manner. The number of individuals recruited was insufficient to address the research questions. Therefore, a web panel (the Norstatpanel) was utilized to expand the sample size. The Norstatpanel consists of individuals who have been randomly contacted via telephone and subsequently agreed to participate in the overall panel. The panel is broadly representative of the population and has a nationwide scope [26]. Participants were recruited based on their match to the specified target population, defined as individuals aged 18 years or older who were currently working.
Data collection
The data were collected from three different sources at three time points. The initial data collection commenced in November 2021, and a second data collection phase was initiated in April 2022. The third data collection based on the Norstatpanel commenced in May 2022. Detailed information about the study, including ethical considerations and unique links to the questionnaire, was sent directly to employees in private companies and public organizations via email. Open-ended links were sent to union members via trade unions through newsletters and emails. The survey was concluded in August 2022. Two reminders were sent during each data collection period. Respondents were required to identify themselves using an e-ID to participate in the survey. The number of respondents from the first data collection was 397; there were 3764 and 6119 respondents from the second and third data collections, respectively, resulting in a total of 10 280 respondents.
Study population
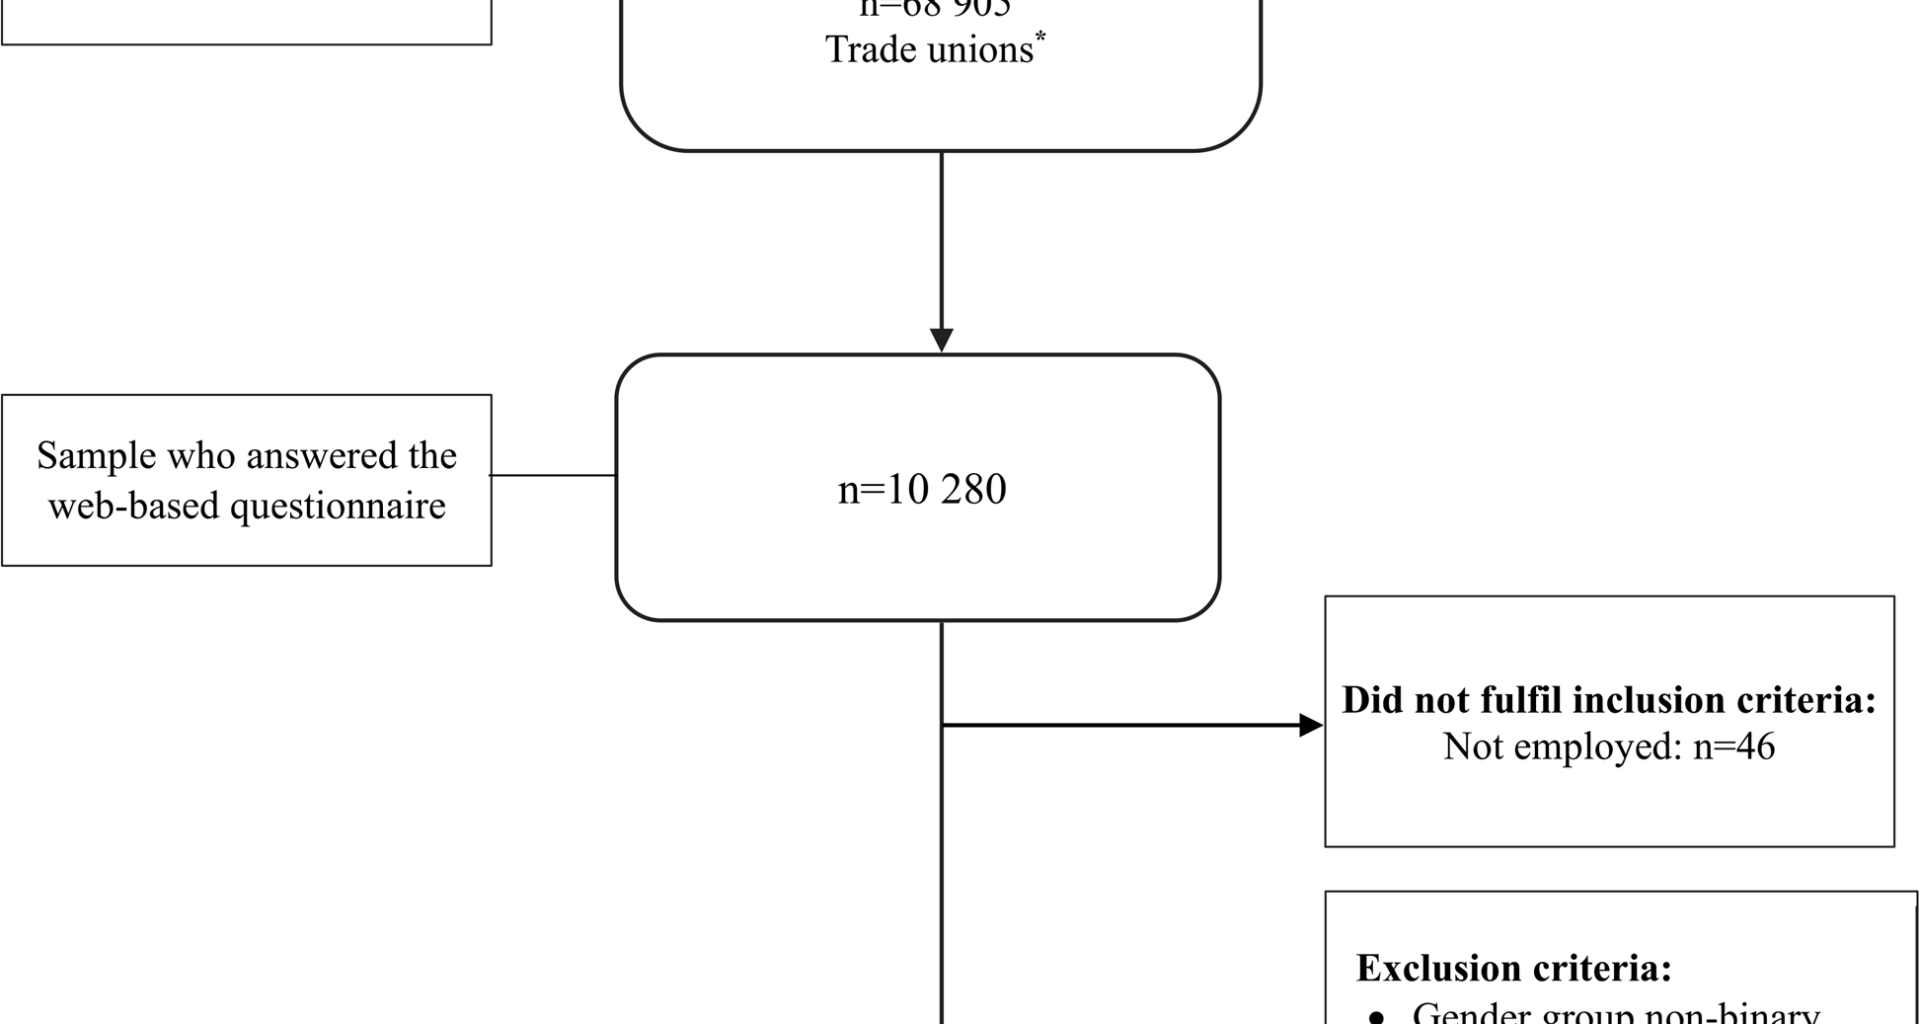
The target population consisted of individuals aged 18–75 who reported being currently working. The inclusion procedure is presented in Fig. 1. Respondents not currently in active labour were excluded (n = 46). The data used in the descriptive statistics and statistical analyses were based on excluding cases with missing data for gender (n = 7) and the non-binary group (n = 37). For the Capacity to Work instrument (C2WI), we excluded response option 5 in any of the statements, as the combination “don’t know/not relevant” made it unclear (n = 1416). Those with items missing at random (n = 191) and those with internal data missing (n = 121) were also excluded. The proportion of women (58%) and men (42%) in the final study sample (n = 8462) was compared with that of the general working population and found to be similar (54% women and 46% men) [27].
Fig. 1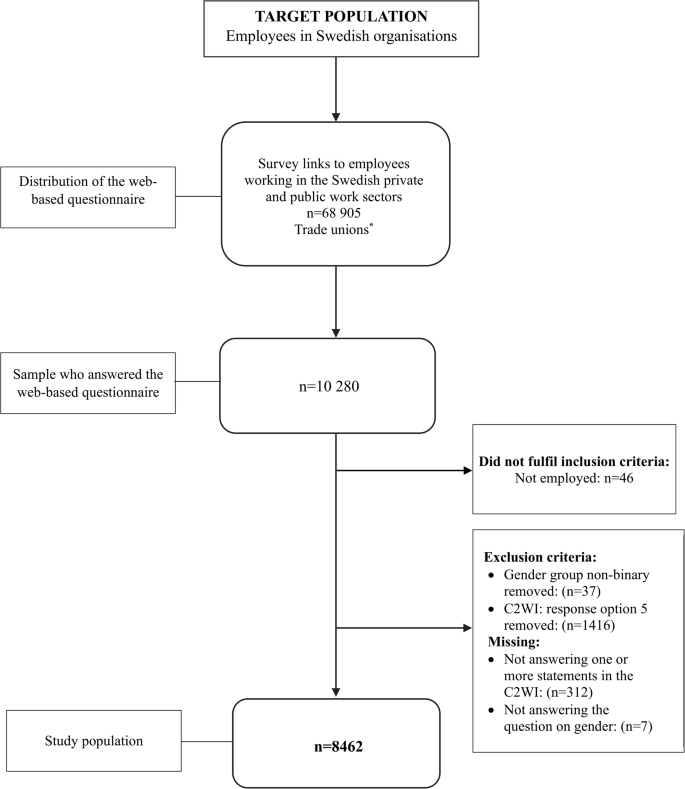
Flowchart of the inclusion procedure and response rates based on the Swedish “Work Participation and Mental Health at Work” (ADAPT) project, 2021-2022
*The trade unions distributed survey links to trade union members through newsletters and e-mail
Survey and instruments
The online survey included questions regarding sociodemographic characteristics and utilized instruments relevant for assessing the association between self-perceived mental well-being and work capacity (Additional file 1).
Dependent variable
The C2WI was developed to capture the different aspects of CMD-related work capacity [25]. In this study, it was applied as an indicator of strained work capacity. Capacity to work was measured through 14 statements (Additional file 2), such as “Thinking has been tough and slow”, “I have had to choose to not do free-time activities to have energy to work”, and “I have felt wound up”. Each statement had four response options: “not at all” (1), “to a low degree” (2), “to a moderate degree” (3), “to a high degree” (4). The minimum score for the C2WI was 14 (score 1 for 14 items) and the maximum score was 56 (score 4 for 14 items). For the descriptive statistics, scores were dichotomized at the 75th percentile (≥ 32) (range 14–56). The higher the scores, the more strained the work capacity. A continuous variable was used for the regression analyses. Cronbach’s alpha was 0.92.
Independent variable
The World Health Organization’s 5-item Well-Being Index (WHO-5) is a generic tool designed to measure subjective mental well-being [28], and the Swedish version of the WHO-5 has been deemed psychometrically sound [29]. The WHO-5 uses positively framed statements: ”I have felt cheerful and in good spirits”, “I have felt calm and relaxed”, “I have felt active and vigorous”, “I woke up feeling fresh and rested”, and “My daily life has been filled with things that interest me”, with response options ranging from “at no time” (0) to “all of the time” (5) on a 6-point Likert scale. Scores were summed and multiplied by four to form a scale from 0 (lowest) to 100 (highest). For the descriptive statistics, scores were dichotomized at the 25th percentile (≤ 44). Lower scores indicate reduced mental well-being. A continuous variable was used in the regression analysis. Cronbach’s alpha was 0.89.
Covariates
Sociodemographic characteristics such as age, education, and occupational class influence working conditions and access to health-supporting resources, which are associated with risks of work disability [14,15,16]. Mental well-being, general health status, and the presence of long-term health conditions are closely linked to perceived work capacity [18,19,20]. Finally, working positions such as work sector, managerial position and working time were added [21, 22].
The respondent’s birth year was recalculated into age, ranging from 18 to 74 years, and recoded into the categories: 18–34, 35–54, and 55–74 years. In Sweden, the official retirement age is 67 years. Thereafter, an employee may continue working until 69 years of age, and beyond that age, upon mutual agreement between the employee and the employer. Level of education was recoded into four categories: compulsory or lower secondary school, upper secondary school, post-secondary school, and university or higher education. Occupational class was determined using the Swedish Standard for Swedish Occupational Classification (SSYK2012) [30]. SSYK is based on a four-level hierarchy and was recoded into four categories: non-manual high-skilled; non-manual low-skilled; manual high-skilled, and manual low-skilled as an indicator of occupational class.
General health status was assessed with one question from the from the 36-Item Short Form Survey (SF-36) [31]: “In general, how would you describe your health?” with response options ranging from “very good” (1) “ good” (2), “fair” (3), “poor” (4) and “very poor” (5). The categories were recoded into three levels: low (“poor, very poor” (1), moderate (“fair”) (2), and high (“good, very good”) (3).
A question on long-term health conditions encompassed 12 different disease groups. Respondents could select multiple disease groups. We created four groups: (i) none of the listed disease groups, (ii) mental health conditions only, (iii) mental health conditions combined with other long-term health conditions, and (iv) other long-term health conditions only [32].
Work sector was categorized as public, private, or other. The category “other” was deemed too small (n = 117) and was therefore excluded.
A managerial position provides occupational prestige and increased job autonomy, both of which positively affect job satisfaction [33]. At the same time, gender inequality regarding the benefits associated with managerial roles has been identified and was therefore included. Managerial position was measured as a binary variable (“yes” or “no”). Female employees are more likely to work part-time than men [34]. This phenomenon is more prevalent in female-dominated occupations and is partly driven by occupational segregation [35]. Working part-time or full-time was measured as a binary variable (“yes” or “no”).
Statistical analysis
Data analyses were performed using IBM SPSS Statistics 29.0.2.0 [36]. The baseline characteristics are presented as proportions with 95% confidence intervals (95% CI).
Descriptive and inferential methods were employed to assess mental well-being and work capacity. Building on previous research on mental well-being in a population sample, this study adopted the same approach, using a cutoff score at the first quartile [37, 38]. As the C2WI is a newly developed instrument, we applied the same method. With a high score reflecting a negative outcome, the scale was dichotomized at the third quartile (Additional files 3 and 4).
Univariable linear regression was conducted to examine the individual associations between mental well-being, each covariate, and work capacity. This approach allows for an initial assessment of the strength and direction of the relationship before adjusting for potential confounders in the multivariable models. The assumption of linearity between the continuous independent variable and the dependent variable was assessed using residual plots and found to be acceptable. The regression analyses were performed with the C2WI as the dependent variable and mental well-being (WHO–5) as the independent variable. Both entered as continuous variables. Age, level of education, general health, long-term health conditions, occupational class, work sector, managerial position and working time were entered as categorical variables. Long-term health conditions were grouped into two groups: No (none of the listed disease groups) and Yes (mental health conditions only and mental health conditions combined with other conditions). Long-term health conditions only were excluded.
In Model I, adjustments were made for sociodemographic characteristics. In Model II, adjustment was made for general health, long-term health conditions, and the variables in Model I. Based on regression analysis, we present the unstandardized regression coefficient (B), and the corresponding 95% CIs.
When tested with Chi2 analysis, we found a statistically significant difference in the distribution of work capacity scores between genders. In addition, it is well-documented that industrial countries reflect a traditional divide through occupational segregation, which warrants analytical consideration [35, 39]. The normality of the residuals was confirmed by examining the variation inflation factors and tolerances. No problems with multicollinearity were noted between the variables.