
The Waikare Gorge bridge was one of many Hawke’s Bay bridges destroyed during the Cyclone Gabrielle floods in 2023. Photo / NZME
The research ranked Taranaki as the least flood-exposed region, where about 8% of people would be impacted by flooding in a one-in-100-year rainfall event (or a flood with a 1% annual exceedance probability).
Comparatively, the West Coast is easily the most flood-exposed region, where 34.4% of the population would be exposed to flooding in a one-in-100-year rainfall event under the current climate.
The West Coast is followed by Nelson where 24.3% of the population would be impacted, then Hawke’s Bay (22.1%), Canterbury (21.5%), Marlborough (20.8%) and Gisborne (20.6%).
The research includes predictions for all 16 regions.
Scientists relied on rainfall data collected prior to 2016, as their high-density rainfall design system had not been updated since then.
The new flood maps overlooking Wairoa and Mahia. Photo / ESNZ
The new research also took into consideration climate change.
It calculated different scenarios during a one-in-100-year rainfall event based on “additional warming” of 1%, 2%, and 3%.
For Hawke’s Bay, that had a big impact.
With just 1% additional warming to the climate – which could occur between 2029 and 2042 according to Earth Sciences NZ – the amount of the population exposed to a one-in-100-year rainfall event would impact 31% of the population in Hawke’s Bay.
At 3% additional warming, it would impact 36% of the population.
“When we add climate change, [Hawke’s Bay] has by far one of the biggest increases of the entire country,” Earth Sciences NZ principal climate scientist Dr Sam Dean said.
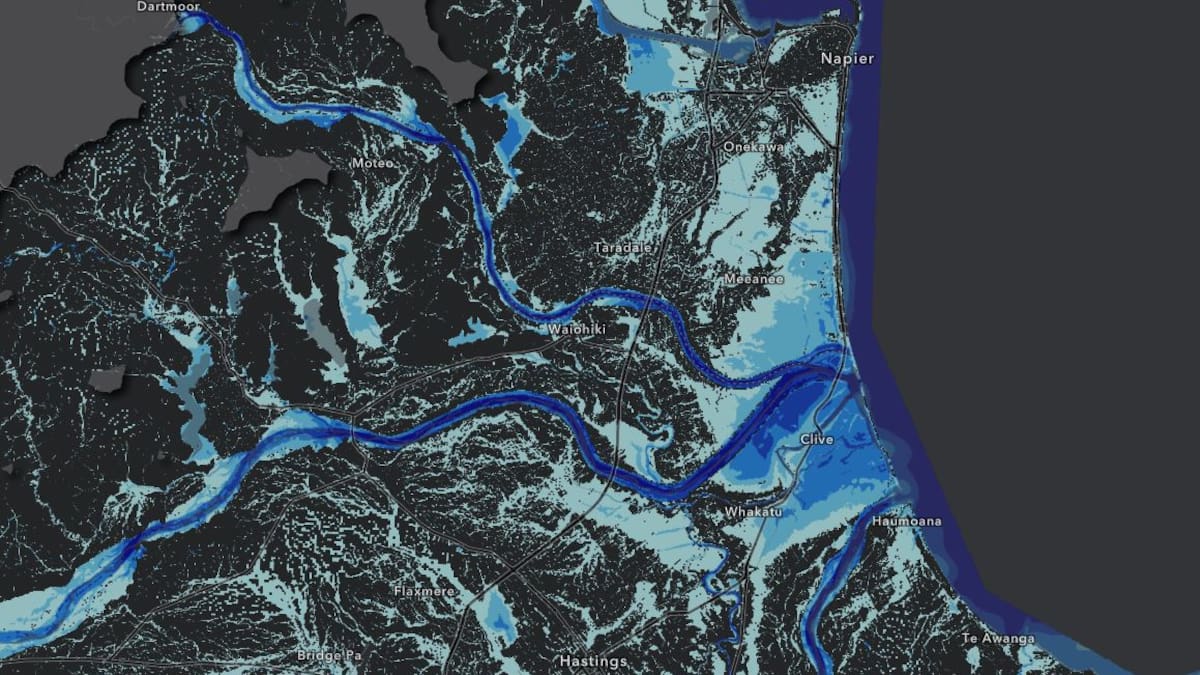
“It is primarily because of Napier and the flooding from the Tūtaekurī River, which a long time ago used to flow north and out to the estuary through Napier.
“Then it got opened out to the sea [north of Clive], but when it floods the water actually goes back that way.”
He said the regions most exposed to flooding all had large rivers coming down from the mountains into floodplains.
“We’ve looked all around the country and West Coast and Hawke’s Bay and Nelson stand out.”
The new flood maps overlooking Waipawa and Waipukurau. Photo / ESNZ
Despite that, the likes of Canterbury, Marlborough and Gisborne are also closely behind Hawke’s Bay in terms of comparative flood risk, under the current climate.
Dean said the research would help the likes of central Government with where best to invest in flood protection.
While a breakdown of data is available for each region, a deeper breakdown of data for cities and towns is not yet available.
You can view the new maps on the Earth Sciences NZ website.
Do the maps replace council flood maps?
No.
The new nationwide flood maps do not take into consideration the state of stormwater infrastructure in different regions, and have not been designed to be used for regulatory decision making.
That means they will not be added to a property’s LIM report, or used by councils for granting (or declining) building and resource consents, according to Earth Sciences NZ.
Many councils have their own maps for that purpose which will continue to be used, such as Napier City Council which updated its own rainfall flood maps last year.
Hawke’s Bay Regional Council CEO Nic Peet echoed that point.
“We appreciate Earth Sciences NZ directing users to regional information where it exists because that’s where the most accurate, locally informed data can be found.”
However, the Ministry for the Environment is working on another set of nationwide flood maps, which could become the main source of flood hazard information for homeowners and home buyers in future.
“A National Flood Map will unify the best available local, regional and national-scale data, so everyone can access information to help them make informed decisions,” a blurb read, about those planned future maps.
Gary Hamilton-Irvine is a Hawke’s Bay-based reporter who covers a range of news topics including business, councils, breaking news and cyclone recovery. He formerly worked at News Corp Australia.