
Dielectric characterization
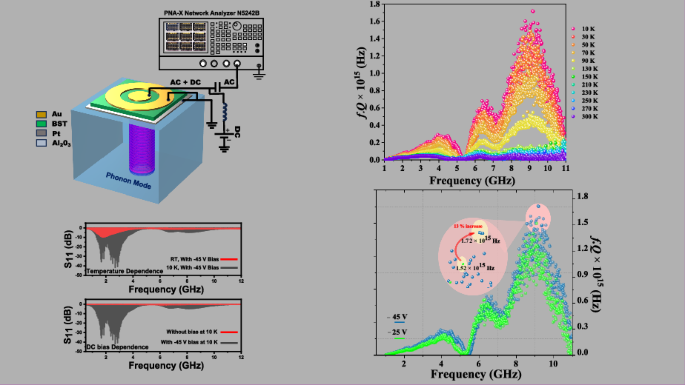
The dielectric property of the Ba0.5Sr0.5TiO3 thin film is first characterized at an off-resonance frequency (10–500 MHz) over 10 K to 350 K temperature (without DC bias) using a network analyzer (Keysight PNA-X) and a Lakeshore probe station (CRX-4K, liquid He). The permittivity and loss tangent of the circular patch capacitor (MIM) are extracted from the scattering parameter (S11)38 and plotted in Fig. 2. In Fig. 2(a), for all the frequency under consideration, the peak of the permittivity occurs at temperature around 220 K which is identified as the phase transition temperature i.e. the ferroelectric phase to paraelectric phase of the BST thin film and the permittivity decreases with increase of frequency because of dielectric relaxation phenomenon. The dielectric loss i.e. the loss tangent increases with increasing temperature and frequency as shown in Fig. 2(b). The effect which is observed for the ferroelectric BST film with temperature can be extended with the inclusion of DC bias where the DC bias has an effect which can be thought of as changing the phase transition temperature of the material because of which the permittivity decreases with an increasing bias applied39,40,41. The resonance characteristics of the acoustic wave devices employing ferroelectrics takes advantage of the DC bias dependence controllability of its dielectric properties for achieving reconfigurability and here in this work we explore this effect in conjunction with the influence it has on the HBAR responses at cryo-temperatures.
Fig. 2: Dielectric characteristics of the BST thin film.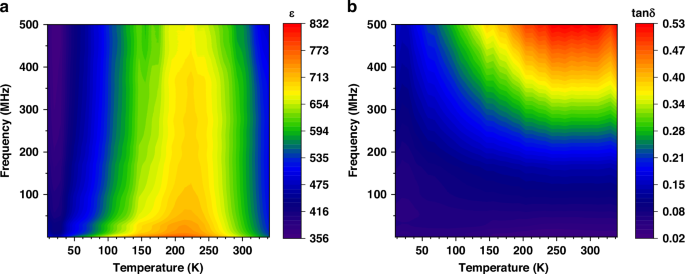
a Permittivity and b loss tangent variation for wide range of frequency (off resonance) and temperature; measurements performed without the application of DC bias
Additionally, the use of high permittivity and tunable dielectric material in QAD circuits could be beneficial for realizing varactor as the coupling element between qubit and resonators and in enhancing electric field confinement from the qubit. Recent works have explored the use of bulk single crystal quantum paraelectric material i.e. strontium titanate and potassium tantalate for designing varactor for readout of carbon nanotube quantum dot devices at millikelvin temperatures42. The electric field dependent permittivity allows for both impedance matching and frequency tuning of resonator allowing a highly sensitive readout of solid-state quantum devices.
Resonator characterization
Here in this section, we present the characteristics of the HBAR with changing temperature (10 K to 300 K) and DC bias (−45 V to +45 V) conditions. Figure 3(a–d) shows the frequency spectra of the HBAR at different temperatures with a positive bias and negative bias condition, respectively. The S parameter reflection responses and the impedance characteristics of the HBAR are plotted in Figs. S1, S2 of Supplementary Material. The fundamental mode of the transducer translates as the first envelope in the spectra where the intense multimode response is observed around 2 GHz for both (+) and (–) bias conditions. The distribution of the modes in the first envelope of the HBAR response is different for the two biasing polarities where the positive bias condition excites overtone modes in the frequency range of 1 GHz to 7 GHz (L to C band) while the negative bias in the range 0.5 GHz to 5 GHz. The third harmonics of the transducer translates as the second envelope in the HBAR spectra around 8-12 GHz (X-band) with the positive bias condition while the negative bias condition presents a strong multimode response in the frequency range 6 – 10 GHz (C to X band). Significant modes are excited in the second envelope relating to the third harmonic modulation of the BST transducer in the negative bias condition compared to the positive bias condition. The variations in the envelope shape and region as shown in Fig. 3(c) between a positive and negative bias conditions might be attributed to the difference in resonance response with different bias polarity for the BST transducer and this fundamental behaviour is yet to be explored in detail. Without a DC bias no significant resonant modes are excited thereby proving the switchability and reconfigurability of the resonator response.
Fig. 3: Impedance spectra of HBAR.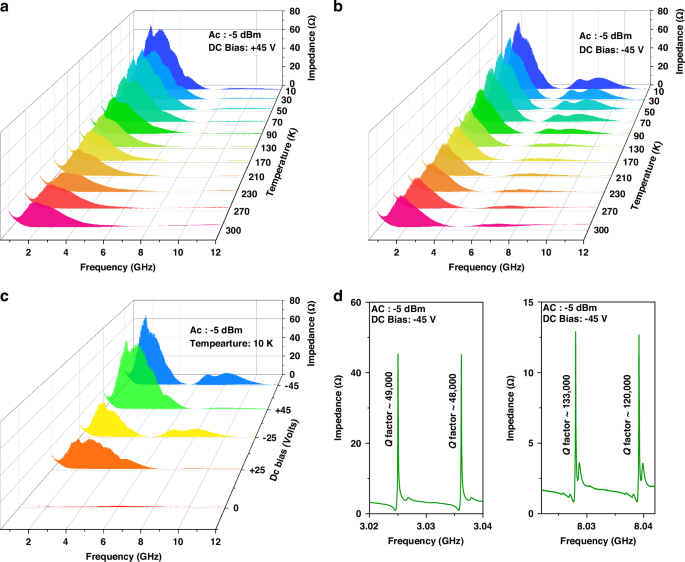
Impedance spectra of HBAR for a +45 V and b −45 V, DC bias at with different temperature (10 K to 300 K), c effect of DC bias on the HBAR at 10 K and d narrow frequency band response from the first envelope (around 3 GHz) and second envelope (around 8 GHz) with −45 V biasing at 10 K
Since the resonator exhibits multitude of modes over a wide range, to understand the overall behaviour, it is useful to study the distributions of the effective coupling coefficient and the free spectral range (FSR) rather than focusing on one mode at a time43. The distribution of effective electromechanical coupling factor (\({k}_{{eff}}^{2}\)) for all the modes occurring in the first envelope of the spectra are plotted in Fig. 4(a, b) and for varying temperatures with +45 V and -45 V DC bias, respectively. The \({k}_{{eff}}^{2}\) is calculated using:
$${k}_{{eff}}^{2}\left(m\right)=\frac{{\pi }^{2}}{4}\,\cdot \,\frac{{f}_{s\,}\left(m\right)}{{f}_{p}\left(m\right)}\,\cdot \,\left[1-\frac{{f}_{s}\left(m\right)}{{f}_{p}\left(m\right)}\right]$$
(1)
fs and fp represent series and parallel resonance frequency, respectively, while m is the mth mode under consideration. The spacing of the parallel resonance frequency (SPRF) otherwise referred to as the free spectral range (FSR) is given by:
$$\,\Delta {f}_{p}\left(m\right)={f}_{p}\left(m+1\right)-{f}_{p}\left(m\right)$$
(2)
Fig. 4: Electromechanical coupling.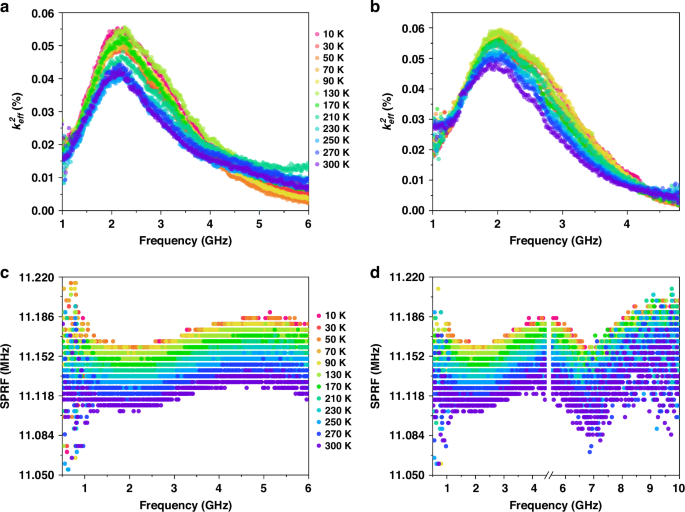
Distribution of effective coupling coefficient considering only the first spectra in the spectra of HBAR with temperature variation for a +45 V and b −45 V, DC bias. FSR for c +45 V first envelope of HBAR and d −45 V with first and second envelope
The FSR is plotted in Fig. 4(c, d) for varying temperatures with +45 V and -45 V DC bias, respectively. Upon closer inspection, the distribution of \({k}_{{eff}}^{2}\) in Fig. 4(a, b) is not identical. This can be correlated with different frequency spectra for different bias polarity as shown in Fig. 3(a–c). This set of studies establishes the thin-film dominance on defining the transducer envelope and its subsequent tailoring of the high-performance phonon modes encapsulated in the sapphire substrate. The HBAR exhibits a \({k}_{{eff}}^{2}\) of 5.6*10-4 at 2 GHz (1st lobe of the envelope) and 2.7*10−4 at 7 GHz (2nd lobe of the envelope) at temperature 10 K with a bias of – 45 V (Fig. S3 in supplementary materials).
The resonance spectra, the distribution of \({k}_{{eff}}^{2}\) and the FSR offer us information about acoustic impedance characteristic of the whole resonator stack43. The acoustic impedance mismatch in the resonator stack (BST/Sapphire) is seen as the sinusoidal like distribution in FSR in contrast to an impedance matched case where the FSR distribution ideally gives a flat (straight) distribution34,35,36. The standard deviation of the FSR for an HBAR with BST/Sapphire configuration is as high as 33.6 kHz while that of an impedance matched HBAR with AlN/ SiC is 13 kHz35. Impedance matching is proven to vastly improve the performance of the resonator due to efficient energy injection from transducer to substrate34. Apart from the acoustic impedance matching for the resonator stack, a parameter which plays major role in the excitation of high Q modes is the thickness of the substrate being used. In our design we utilize a 500 µm thick sapphire, which is a major contribution to the high Q response of the HBAR. Due to the thickness effect of the substrate, the fQ reported in this work are much higher when compared to even acoustically matched HBARs with SiC substrate thicknesses of 244 µm35 and 360 µm36. The coupling coefficient for the ferroelectric HBAR discussed here show considerable improvement while decreasing the temperature and by increasing DC bias (Section S2 in Supplementary Material) which can be considered as way to efficiently inject acoustic energy from transducer to substrate. Furthermore, apart from the fQ product, the ratio of the coupling strength (between photon and phonon) to FSR in QAD systems is an important parameter deciding the multimode interactions for facilitating quantum memory operations and studying superstrong coupling regimes9.
Quality factor
In order not to overestimate the Q of the resonator, care has been taken both in the measurement procedure as well as in the post processing of the collected data from measurement by using multiple Q analysis methods. During the measurement, SOL (1-port) calibration is carried out at each temperature step of interest. And to eliminate erroneous estimation of quality factor, multiple channel calibrations for multiple windows (window span of 500 MHz with 100,000 data points) of the required frequency ranges are performed instead of performing a single calibration for the whole frequency range at once and extrapolating the calibration for narrower band. All measurements were conducted for an AC power of -5 dBm. Bias tee is included in the setup for providing the external DC bias with a power supply. No smoothing of data is done for the Q calculation. Most effort has been put forth in defining the optimal set up during measurements. To confirm the validity of the technique of Q extraction utilized in this work, two different methods of Q extractions i.e., QBode (Eq. 3) and QLakin (Eq. 4) are first employed on the highest Q mode of the resonator, one at around 5 GHz (for +45 V case) and the other at around 9 GHz (for -45 V case) for measurements performed at 10 K.
Figure 5(a, b) shows strong consistency for the utilized methods of extraction. The formulae for extraction of Q for both the methods are given below23,44:
$${Q}_{{Lakin}}={\left.\frac{f}{2}\frac{\partial \angle Z}{\partial f}\right|}_{f}$$
(3)
where \(\angle Z\) is the impedance phase angle and f is the resonant (series/parallel) frequency of interest.
$${Q}_{{Bode}}=\omega \times \frac{\left|{S}_{11}\right|{group}{\rm{\_}}{delay}({S}_{11})\,}{1-{\left|{S}_{11}\right|}^{2}}$$
(4)
Fig. 5: Q analysis methods.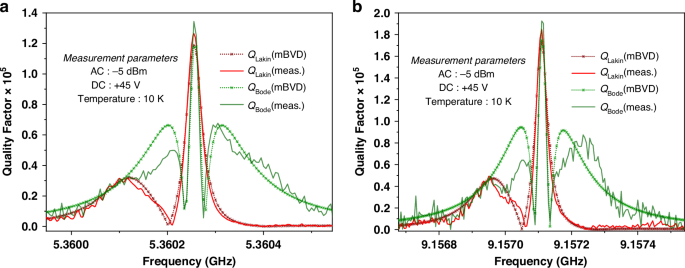
Quality factor extraction methodology confirmation for two modes of the highest Q reported at a +45 V, and b −45 V. A very close match between mBVD electromechanical modelling and measurement has been attained
The modified Butterworth Van Dyke (mBVD) model and parameters extraction are listed in supplementary materials (Section S3). Figure 6(a, b) show the fQ product distributions (Q calculated using Eq. 3) for the +45 V and −45 V DC biased resonator at varying temperatures, respectively. The distribution of Q with temperature for both cases is plotted in Figure S8 of supplementary materials. The drop in the fQ or the Q at around 70 K to 130 K relates to the relaxation behaviour of the attenuation coefficient of materials45. Interestingly, similar trends are also observed in temperature-dependent loss tangent studies for sapphire27. This validates the fact that major portion of the vibrational energy is confined in the sapphire substrate.
Fig. 6: fQ dependency on temperature.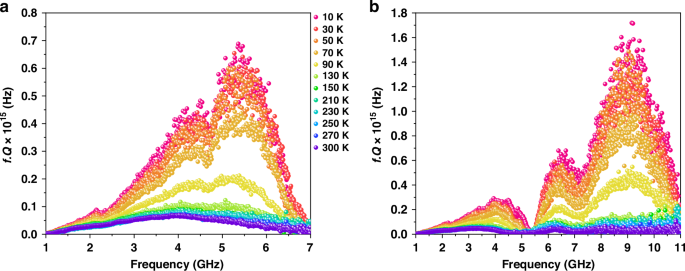
fQ product distributions at a +45 V and b −45 V respectively, at different temperatures
Different DC bias polarity excites different harmonics in the transducer as discussed earlier which makes the distribution of fQ to be different for +45 V and −45 V DC. To further the argument of the functionality provided by the ferroelectric film, Fig. 7(a, b) shows the dependence of fQ on the bias magnitude applied for all the modes in the wide spectra. In Fig. 7(b), a change in DC bias from −25 V to −45 V, the fQ of 1.52 × 10¹⁵ Hz increases to 1.72 × 10¹⁵ Hz yielding a considerable 13% increase in the fQ when the mode with highest Q is considered for each biasing case. Figure 7(c, d) shows how the fQ of HBAR and hence its phonon relaxation time (in supplementary materials Section S4) is tuneable by an externally applied DC bias. The increase in the Q can be partially attributed to the enhancement in\(\,{k}_{{eff}}^{2}\) by increasing in DC bias which means that more transduction of acoustic energy to electrical energy and vice-versa is achieved through increasing magnitude of DC bias.
Fig. 7: fQ dependency on bias.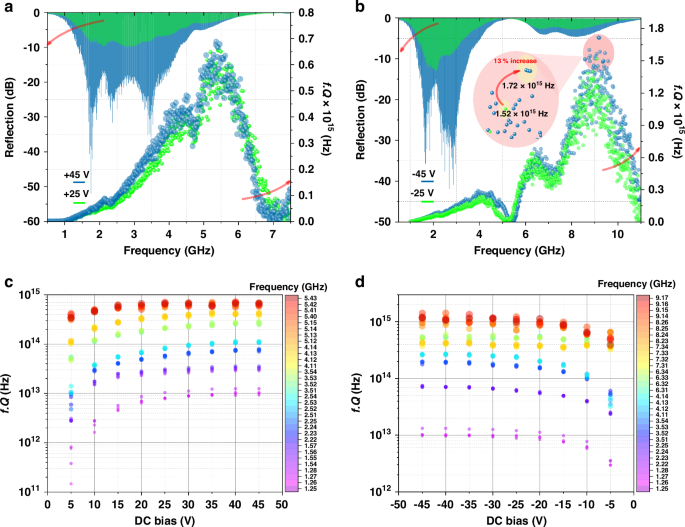
fQ product distributions at (a) and (c) varying positive polarity bias and (b) and (d) varying negative polarity bias, at 10 K temperature
The Q is a measure for the total losses in the resonator. Losses in the resonators are attributed to intrinsic material losses, anchor losses, electrical losses etc. Intrinsic material losses in the device are due to three dissipation mechanisms i.e., thermoelastic dissipation, phonon-electron dissipation, and phonon-phonon dissipation. Out of these three dissipation mechanisms, since the HBAR is operated at the GHz frequency range and the resonator is mainly dominated by the insulating single crystal sapphire substrate, the phonon-phonon dissipation is the dominating loss mechanism. The study on the dependence of the Q on frequency and temperature yields information on what dissipation or damping mechanism is at play for the resonator being studied46,47,48,49,50. In the sapphire-based HBAR discussed here, the fQ distributions of the acoustic modes are affected by both temperature and frequency (shown in Fig. 8), which is explained by dissipation happening due to phonon-phonon interactions. From Figs. 6 and 8, the modes at higher frequencies (f > 4 GHz) have higher dependence on temperature compared to modes at lower frequencies (f ~ 1 GHz). At T ≤ 70 K, modes above 8 GHz show fQ above 1015 Hz meaning the phonon lifetime for the modes are a few microseconds.
Fig. 8: fQ dependency on Temperature and mode.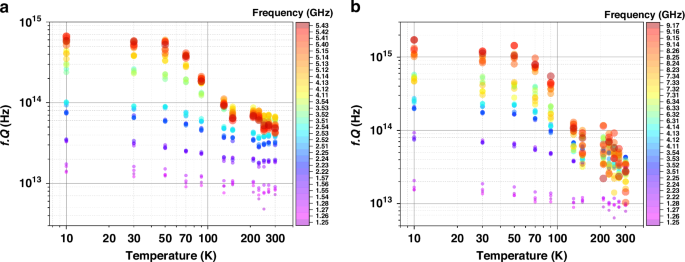
fQ product distributions vs Temperature at (a) +45 V and (b) −45 V; The frequency of the modes is shown as heat map
Due to multiple modes falling within a wide frequency spectrum, HBAR platform facilitates the observations of gradual evolution of temperature dependence of the fQ trend in a single resonator platform51. To identify this, the phonon attenuation, α (calculated from, Q = ω/2αv where v is the phase velocity) for six different modes at frequencies 2.23 GHz, 3.82 GHz, 5.33 GHz, 6.56 GHz, 8.65 GHz, and 9.05 GHz are extracted and the temperature dependence of each mode is identified. Figure 9 shows the temperature dependence relationship of α changing from T1.48 to T4.75 as the frequency increases. The temperature and the Q-1 relationship along with the temperature dependence of frequency of the selected modes are provided in supplementary materials (Section 4). Based on these observations, the higher frequency modes are close to Landau-Rumer’s regime when operated at low temperature while the lower frequency modes are operating in-between Akhiezer’s regime and Landau-Rumer’s regime37,46,47,48,49,50,51.
Fig. 9: Phonon attenuation for modes of different frequencies.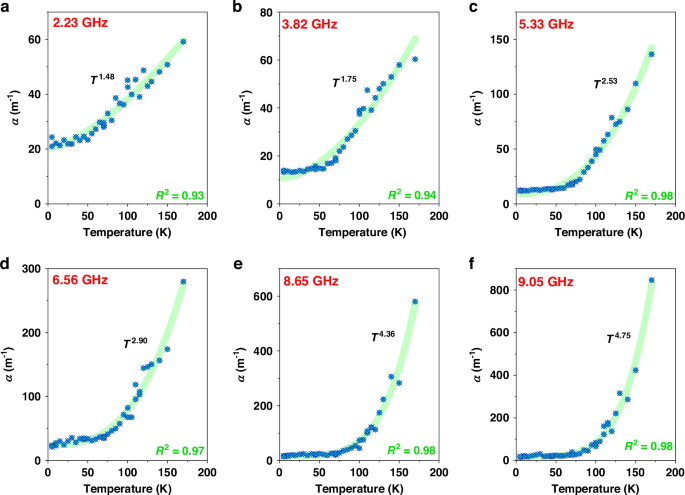
a–f The measured phonon attenuation, α, with the fit specifying the evolution of its dependence on temperature for six modes at different frequencies
From the experimental results discussed so far, it is important to draw upon the implication a ferroelectric or a paraelectric based HBAR will have upon its application into a circuit QAD system. In a hybrid quantum system, the operating frequency are decided by the type of qubit which are to be utilized, and the frequency falls in the microwave frequency range. On chip QAD systems utilizes mostly flux, phase, transmon and spin qubits3,7,52 which have operating frequencies easily achievable with mechanical resonators like SAW 4or BAW3,7. The BST HBAR presented here has a wide span of frequency range which covers frequencies which are suitable for QAD application52. The utilization of such GHz resonator is highly desirable as the quantum ground state cooling can be achieved at relatively higher temperatures while comparing it with mechanical resonators operating below 1 GHz. The reported fQ in this work are in the same order or higher when compared to other HBAR utilized for QAD while being operated at a much higher temperature relatively7,11,26. The fQ is bound to improve further if the BST HBAR is operated at millikelvin temperature where most QAD systems are implemented. The high fQ can be interpreted as having high coherent oscillations, \({N}^{({osc})}={fQh}/\,(2\pi {k}_{B}T)\), where kB is the Boltzmann constant, T is temperature and h is Planck constant. Achieving a large value of \({N}^{({osc})}\) is crucial for applications into study of quantum phenomenon. For the BST HBAR mode at 9.16 GHz (with fQ = 1.72 × 10¹⁵ Hz) measured at 10 K, the \({N}^{({osc})}\) ~ 1.3 × 10³ which proves that the HBAR can be incorporated into hybrid systems like optomechanics or QAD9.
BST HBAR has the potential to further improve the performance through modification in the excitation scheme and optimization of the device stack. The ferroelectric based HBAR has an added advantage of providing reconfigurability as it is heavily influenced by both the magnitude and the polarity of the bias being applied externally. The DC bias can tune the permittivity of the BST and the HBAR as a whole show bias dependence in terms of its Q and \({k}_{{eff}}^{2}\). If the BST HBAR were to be implemented into a QAD system3,7, we can expect the use of the ferroelectric film would vastly improve the coupling as DC bias can increase the \({k}_{{eff}}^{2}\) (Shown in Section S2 of Supplementary Material). From a plausible system point of view, this is better understood by representing a qubit coupled to the BST HBAR in an equivalent circuit shown in figure S4. The coupling strength qubit-resonator coupling strength, Ω is given by53
$$\Omega =\frac{{C}_{c}}{{C}_{0}+{C}_{c}}\sqrt{\frac{1}{{L}_{m}{C}_{q,{eff}}}}$$
(5)
where, Cq,eff = Cq + C0 Cc (C0 + Cc)−1; Cq is the capacitor in parallel to the Josephson junction, C0 is the capacitance associated with the resonator’s static arm and Cc is capacitor which couples the resonator with a qubit. Based on the above equation and several other definitions relating coupling between qubit and mechanical resonator, we can see how the resonator’s parameters can affect the coupling strength. Since the motional arm elements are dependent on \({k}_{{eff}}^{2}\) of the resonator, having a controllable \({k}_{{eff}}^{2}\) provide flexibility in tuning the coupling strength dynamically. This is crucial, as there is a trade-off between Q and \({k}_{{eff}}^{2}\), and the only way to adjust this for a piezoelectric HBAR is by thinning down the substrate which increases \({k}_{{eff}}^{2}\) while degrading the Q, or vice versa. For the on-chip application, the voltage dependent capacitor (BST varactor) could provide vital tuning parameter for getting an optimal coupling strength. Such controllability could also provide an option to switch between a strong or weak coupling regimes depending on the application targeted. With the BST HBAR’s ability to provide coherent and long phonon lifetime, it is worthwhile to explore its potential in the field of hybrid quantum systems.