
Kangaroos and other macropods are unique in both their morphology and their locomotor style. At slow speeds, they use a pentapedal gait, where the forelimbs, the hindlimbs, and the tail all contact the ground, while at faster movement speeds, they use their distinctive hopping gait (Dawson and Taylor, 1973; O’Connor et al., 2014). Their uniqueness extends into their energetics of locomotion. As far back as the 19th century, researchers noticed that the metabolic cost of running in quadrupeds and bipeds, like dogs, horses and humans, increased linearly with speed (Zuntz, 1897; Taylor et al., 1970; Heglund et al., 1982; Taylor et al., 1982). To explain why metabolic rate increased at faster running speeds among quadrupeds and bipeds, Kram and Taylor, 1990 refined the ‘cost of generating force’ hypothesis (Taylor et al., 1980). They reasoned that the decrease in contact time with increased speed, reflects an increase in the rate of generating muscle force, and the rate of cross-bridge cycling (Kram and Taylor, 1990). This was supported for a diverse range of running and hopping animals, suggesting that metabolic rate was inversely proportional to contact time (Kram and Taylor, 1990). Yet hopping macropods appear to defy this trend. On treadmills, both red kangaroos (~20 kg) and tammar wallabies (~5 kg) showed little to no increase in the rate of oxygen consumption with increased hopping speed (Dawson and Taylor, 1973; Baudinette et al., 1992; Kram and Dawson, 1998). The underlying mechanisms explaining how macropods are able to uncouple hopping speed and energy cost is not completely understood (Thornton et al., 2022).
The ability to uncouple speed and energy expenditure in macropods is likely related to the behaviour of their ankle extensor muscle-tendon units, which store and return elastic strain energy (Morgan et al., 1978; Biewener et al., 2004b; McGowan et al., 2005). In tammar wallabies, ankle tendon stress increases with hopping speed, leading to a greater rise in elastic strain energy return than muscle work, which increases the proportion of work done by tendon recoil while muscle work remains near constant (Baudinette and Biewener, 1998; Biewener et al., 1998). Size-related differences in ankle extensor tendon morphology (Bennett and Taylor, 1995; McGowan et al., 2008), and the resultant low strain energy return, may explain why small (<3 kg) hopping macropods and rodents appear not to be afforded the energetic benefits observed in larger macropods (Thompson et al., 1980; Biewener et al., 1981; Biewener et al., 1998) (but see Christensen et al., 2022). However, tendon morphology alone is insufficient to explain why large macropods can increase speed without cost, while large quadrupeds with similar tendon morphology cannot (Dawson and Webster, 2010). The most obvious difference between macropods and other mammals is their hopping gait, but previously proposed mechanisms to explain how hopping could reduce the metabolic cost of generating muscle force, such as near-constant stride frequency (Heglund and Taylor, 1988; Dawson and Webster, 2010) or respiratory-stride coupling (Baudinette et al., 1987), do not distinguish between small and large macropods, nor galloping quadrupeds (McGowan and Collins, 2018).
Postural changes are another mechanism which could contribute to reduced energetic costs by altering the leverage of limb muscles. The EMA is the ratio of the internal muscle-tendon moment arm (the perpendicular distance between the muscle’s force-generating line-of-action and the joint centre) and the ground reaction force (GRF) moment arm (the perpendicular distance between the vector of the GRF to the joint centre). Smaller EMA requires greater muscle force to produce a given force on the ground, thereby demanding a greater volume of active muscle, and presumably greater metabolic rates, than larger EMA for the same physiology. In humans, an increase in limb flexion and decrease in limb EMA requires a greater volume of active muscle and increases the metabolic cost of running compared to walking (Biewener et al., 2004a; Kipp et al., 2018; Allen et al., 2022). Changes in EMA with speed are not common in quadrupedal mammals (Biewener, 1989) but these are not without precedent. Elephants—one of the largest and noticeably most upright animals—do not have discrete gait transitions, but rather continuously and substantially decrease EMA in limb joints when moving faster, which has also been linked to the increase in metabolic cost of locomotion with speed (Ren et al., 2010; Langman et al., 2012). EMA is more commonly observed to change with size in terrestrial mammals. Smaller animals tend to move in crouched postures with limbs becoming progressively more extended as body mass increases (Biewener, 1989). Yet, rather than metabolic cost, this postural transition appeared to be driven by the need to reduce the size-related increases in tissue stress (Dick and Clemente, 2017; Clemente and Dick, 2023). As a consequence of transitioning to more upright limb postures, musculoskeletal stresses in terrestrial mammals are independent of body mass (Biewener, 1989; Biewener, 2005).
Macropods, in contrast, maintain a crouched posture during hopping. Kram and Dawson, 1998 explored whether kangaroos transitioned to a more extended limb posture with increasing speed as a potential mechanism for their constant metabolic rate, but did not detect a change in EMA at the ankle across speeds from 4.3 to 9.7 ms–1. Furthermore, ankle posture and EMA appears to vary weakly (McGowan et al., 2008) or not at all with body mass in macropods (Bennett and Taylor, 1995; Snelling et al., 2017). As a consequence, stress would be expected to increase with both hopping speed and body mass. Large tendon stresses are required for rapid strain energy return (strain energy ∝ stress2) (Biewener and Baudinette, 1995). Given that tendon recoil plays a pivotal role in hopping gaits, it is perhaps unsurprising that tendon stress approaches the safe limit in larger kangaroos. The ankle extensor tendons in a moderately sized male red kangaroo (46.1 kg) operate with safety factors near two even at slow hopping speeds (3.9 ms–1) (Kram and Dawson, 1998), far lower than the typical safety factor of four to eight for mammalian tendons (Ker et al., 1988). Tendon stresses are also unusually large in smaller kangaroos. Juvenile and adult western grey kangaroos, ranging in mass from 5.8 to 70.5 kg, all hop with gastrocnemius and plantaris tendon safety factors less than two (Snelling et al., 2017). Large tendon stresses may not only be a natural consequence of their crouched posture and tendon morphology, but also be adaptively selected. Considering this, kangaroos may adjust their posture to increase tendon stress and its associated elastic energy return. If so, there would likely be systematic variation in kangaroo posture with speed and mass which is yet to be fully explored.
In this study, we investigated the hindlimb kinematics and kinetics in kangaroos hopping at various speeds. Specifically, we explored the relationship between changes in posture, EMA, joint work, and tendon stress across a range of hopping speeds and body masses. To do this, we built a musculoskeletal model of a kangaroo based on empirical imaging and dissection data (Figure 1a). We used the musculoskeletal model to calculate ankle EMA throughout the stride by capturing changes in both muscle moment arm and the GRF moment arm, allowing us to explore their individual contributions. We hypothesised that (i) the hindlimb would be more crouched at faster speeds, primarily due to the distal hindlimb joints (ankle and metatarsophalangeal), independent of changes with body mass, and (ii) changes in moment arms resulting from the change in posture would contribute to the increase in tendon stress with speed, and may thereby contribute to energetic savings by increasing the amount of positive and negative work done by the ankle without requiring additional muscle work.
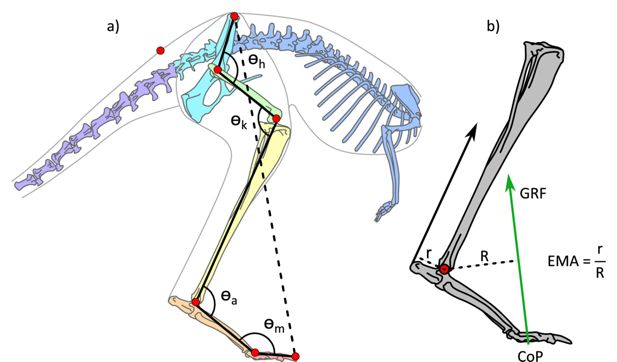
Illustration of the kangaroo model and moment arms for the ankle.
(a) Illustration of the kangaroo model. Total leg length was calculated as the sum of the segment lengths (solid black lines) in the hindlimb and compared to the pelvis-to-toe distance (dashed line) to calculate the crouch factor. Joint angles were determined for the hip, h, knee, k, ankle, a, and metatarsophalangeal, m, joints. The model markers (red circles) indicate the position of the reflective markers placed on the kangaroos in the experimental trials and were used to characterise the movement of segments in the musculoskeletal model. (b) Illustration of ankle effective mechanical advantage, EMA, muscle moment arm, r, and external moment arm, R, as the perpendicular distance to the Achilles tendon line of action and ground reaction force (GRF) vector, respectively. The centre of pressure (CoP) was tracked in the fore-aft direction.