
*Astronomers chart the growth of the Spirograph Nebula over more than a century. *
The Universe is a slow-changing place. While it’s mostly true that the heavens and the deep-sky objects in it will look largely the same across an average human lifetime, there are dramatic examples that defy this trend.
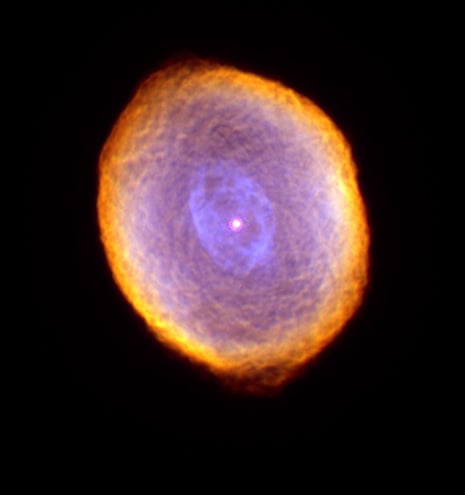
One such case is the planetary nebula IC418. Located in the constellation Lepus the Hare, this is also sometimes referred to as the ‘Spirograph Nebula,’ due to its interlocked looping structure.
A study published in a recent edition of Astrophysical Journal Letters by researchers at the University of Manchester and Hong Kong University has charted the growth and evolution of IC418, spanning observations going all the way back to years after its discovery in the late 19th century.
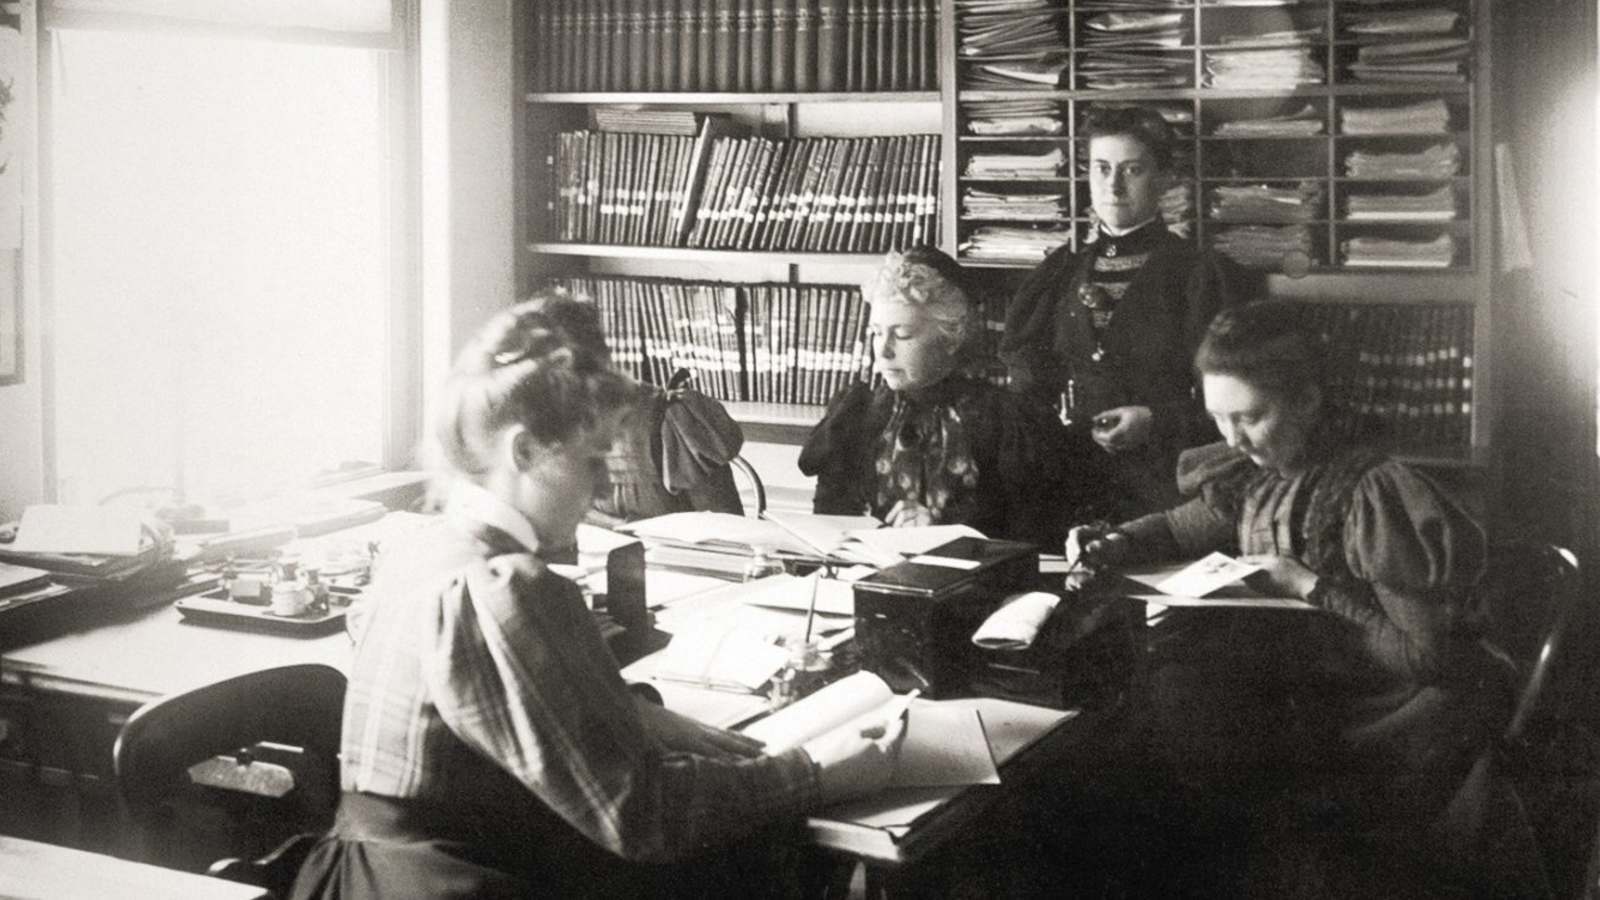 Williamina Fleming (standing) circa 1890. Harvard University/Public Domain.
IC 418 was discovered by Scottish-American astronomer Williamina Fleming on March 26th, 1891. Fleming was working at Harvard Observatory (HCO) at the time, as part of the Draper Catalogue survey. Fleming was the prolific discoverer of 59 nebulae while meticulously examining glass plates for the survey. IC 418 was later misattributed to John L.E. Dreyer’s Index Catalogue of deep sky objects.
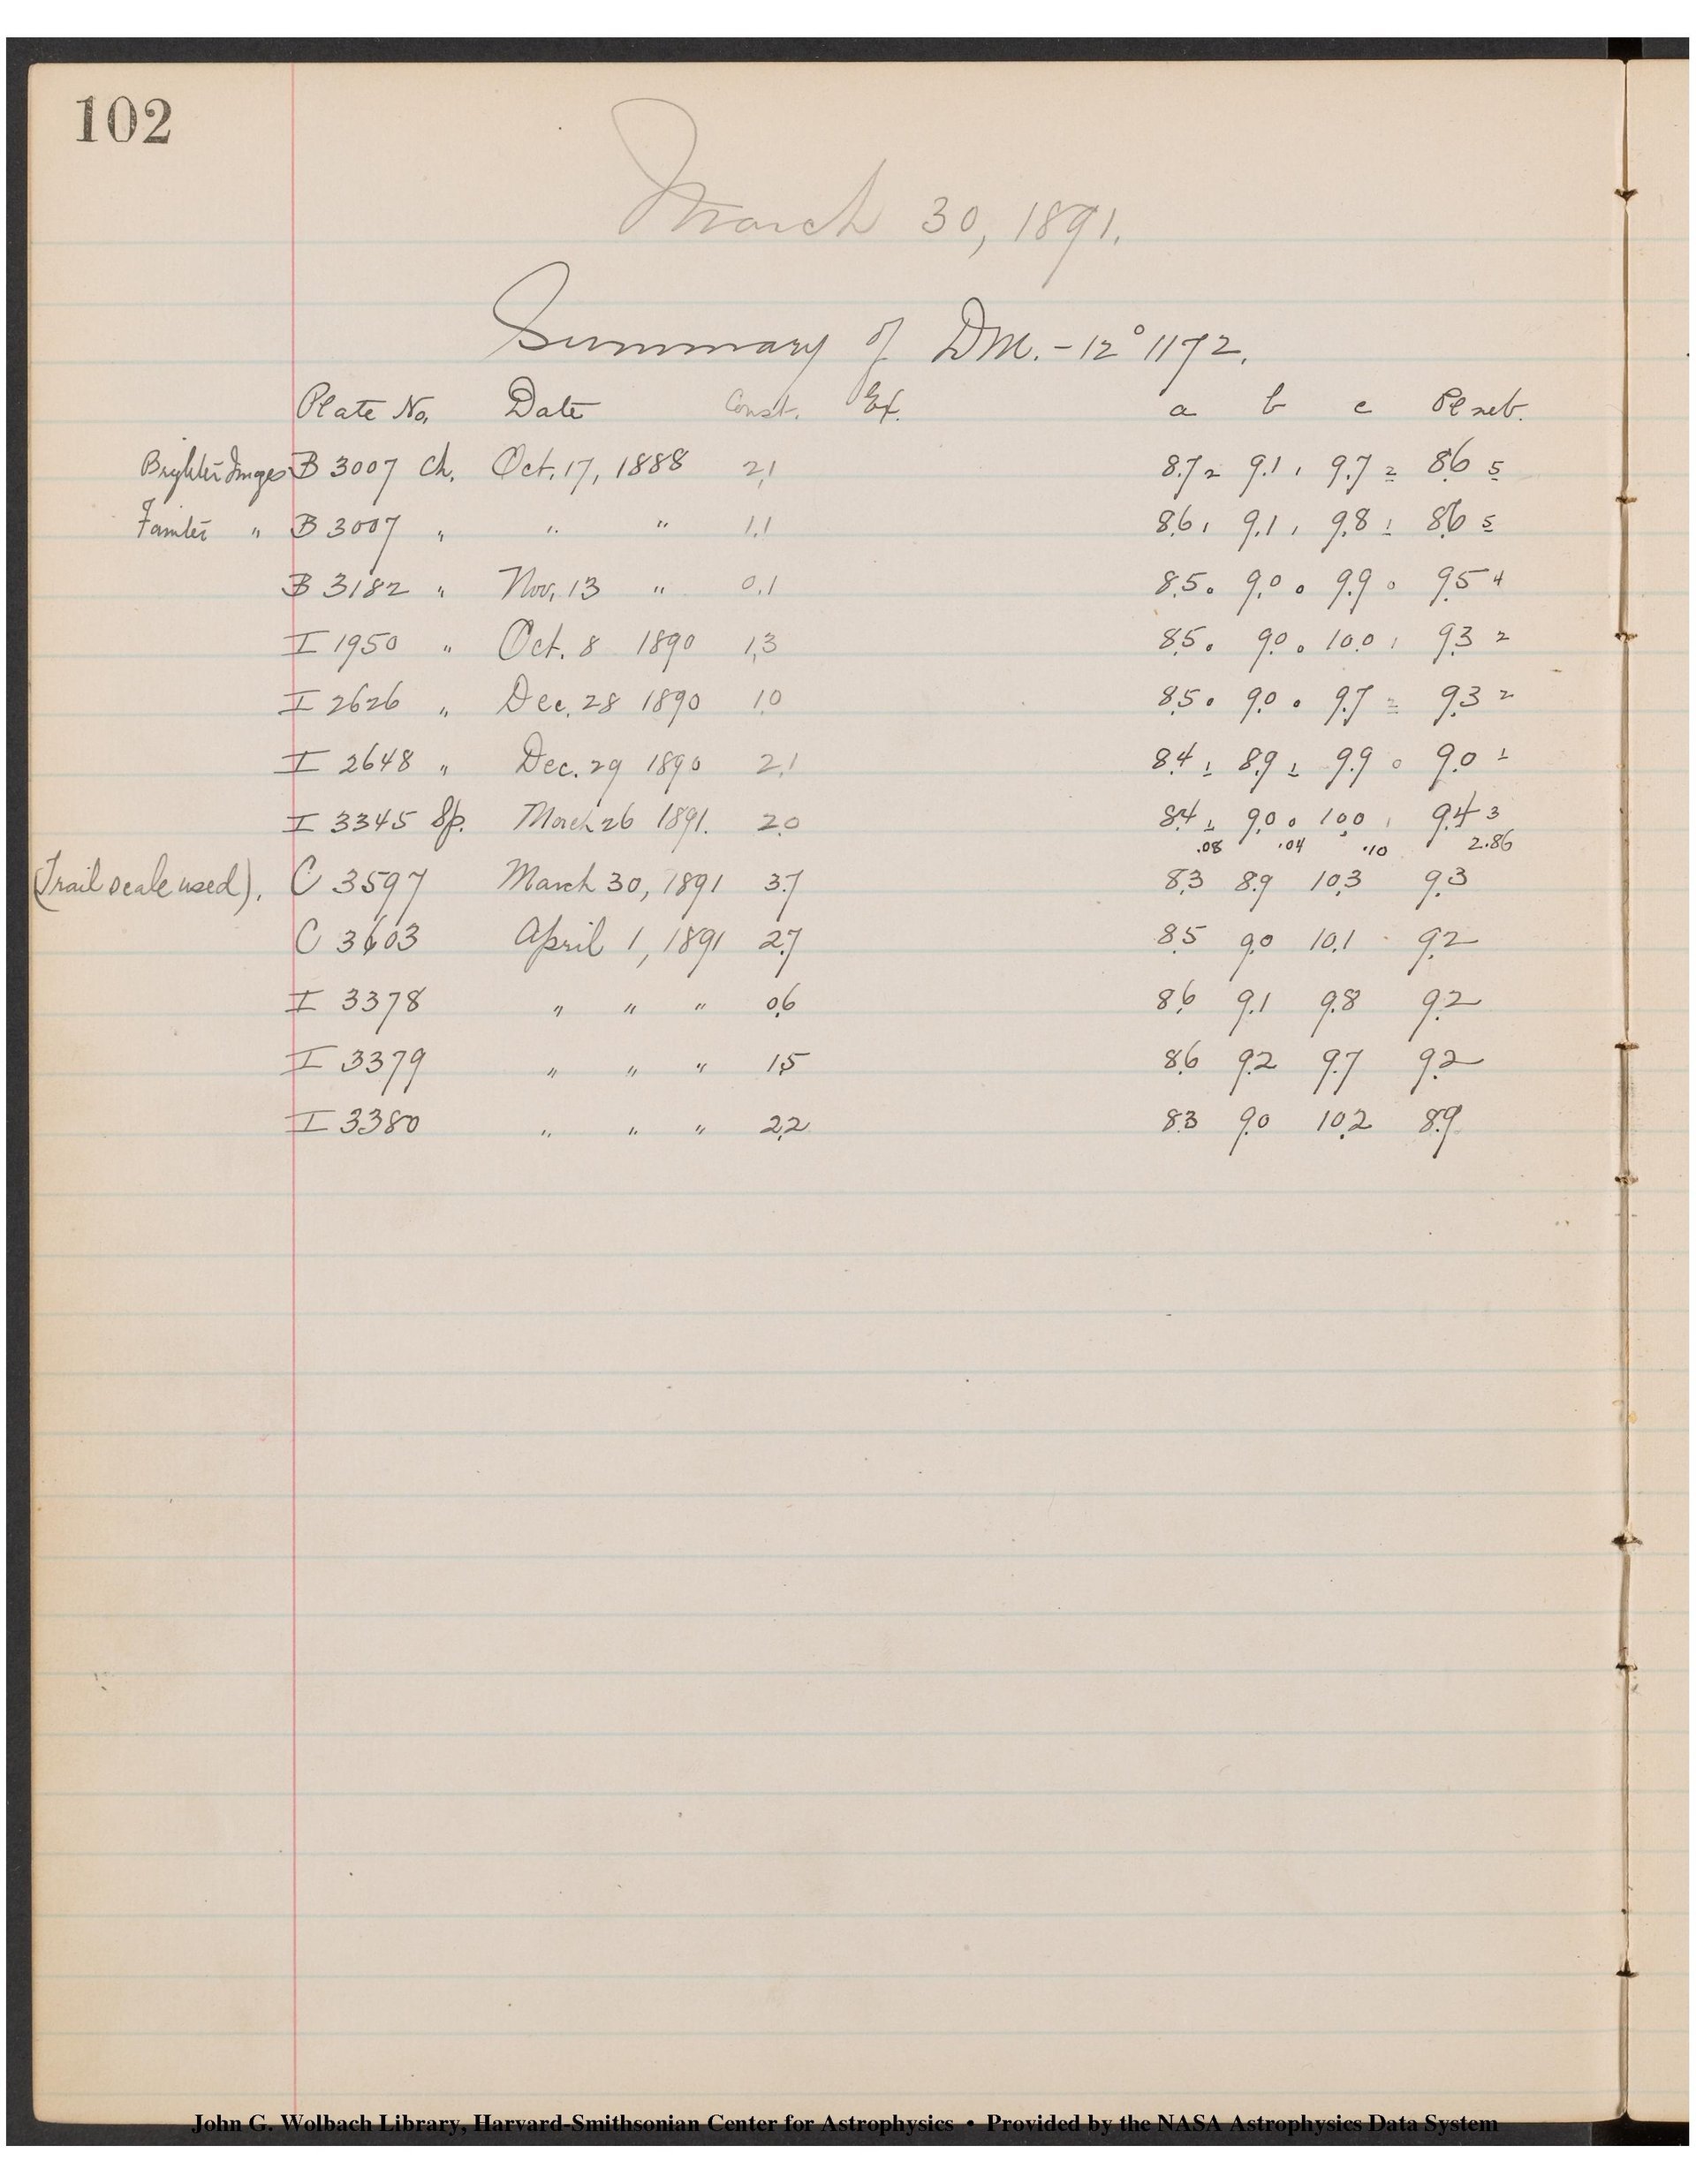 The log book of Williamina Fleming, including the March 26th, 1891 entry. Ironically, this particular plate has yet to make its way online. Credit: Harvard Observatory/Public Domain.
Shining at +9th magnitude, IC 418 is an apparent 18 arcseconds in diameter. Planetary nebulae get their name from their appearance at the eyepiece as ghostly planetary disks. IC 418 is about 2,000 light-years distant, and about 0.2 light-years across.
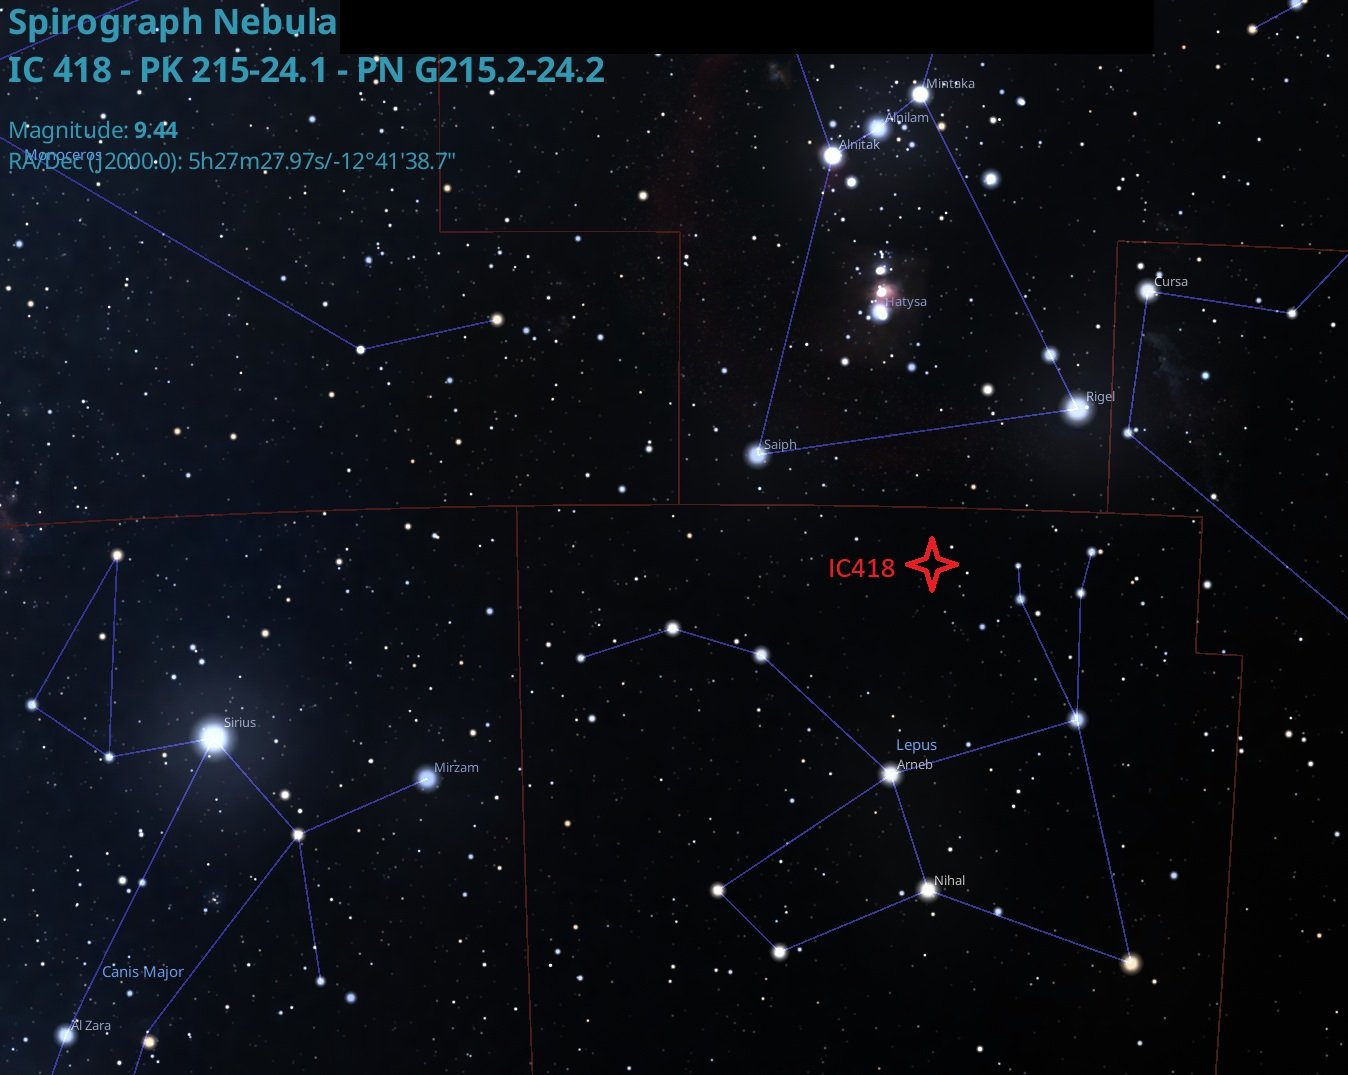 The location of IC 418 in the sky. Credit: Stellarium.
IC 418 has the advantage of having an almost unbroken lineage of spectroscopic measurements, going all the way back to the birth of the technique in the 1890s. This study analyzed these, noting changes in the nebula’s spectrum and appearance over time. This posed a challenge, as the span covered visual observations, plus photographic measurements starting with glass plates into the film era of astrophotography, leading into digital and CCD cameras in use today. The Hubble Space Telescope has frequently imaged IC 418 over the years.
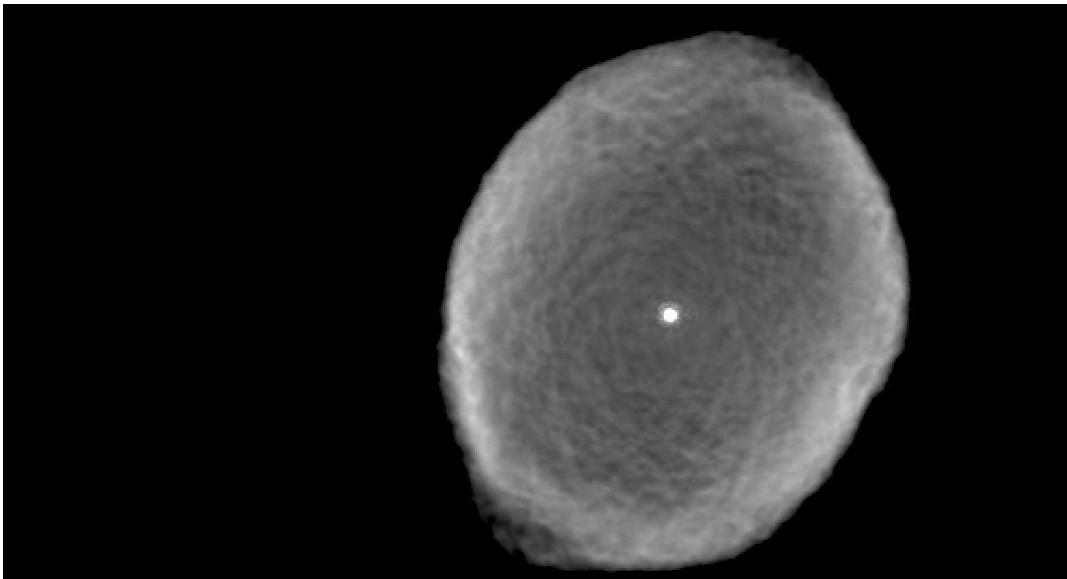 The Spirograph Nebula imaged by Hubble in 1999. Credit: The Hubble Legacy Archive.
“The oldest data we used is from 1893, when the first spectrum was observed by (William W.) Campbell,” Albert Zijlstra (University of Manchester) told Universe Today. “It was done by naked eye but described well enough that we could use it for our study.”
Key to the study were emission lines in the blue range, covering hydrogen to the region of the spectrum known as doubly ionized oxygen (OIII). This was the spurious element ‘nebulium’ thought to exist in the early turn of the 20th century.
“We re-determined the line ratios (in the spectrum) from the photographs, in some cases re-determining line ratios from what we know about sensitivities of the photographic emulsions,” says Zijlstra.
A planetary nebula such as IC 418 evolves when a star near the end of its life enters a red giant phase, and begins to shed material into space in its final death throes. The final collapse sees the star end its days as a dense degenerate white dwarf, about 0.6 times the mass of our Sun. This dense object is compressed into a volume about the size of Earth. This glowing ember of a star is enshrouded in a cocoon of gas and dust. The star at the heart of IC 418 is undergoing this transition from a red giant to a white dwarf, right now. Our Sun and solar system may share a similar fate, about five billion years from now.
The study marked the first look at the evolution of a dying star over a century-long span. It not only revealed hints at the progenitor star’s initial versus final mass, but revealed how the star is heating up faster than any other typical star observed previously. Ironically, this increase is still slower than models of stellar evolution predict.
Specifically, the study found that the central star has increased by 3000 degrees Celsius since discovery, or by about 1000 degrees Celsius every 40 years. In contrast, Our Sun saw such an increase during formation over a 10-million-year span.
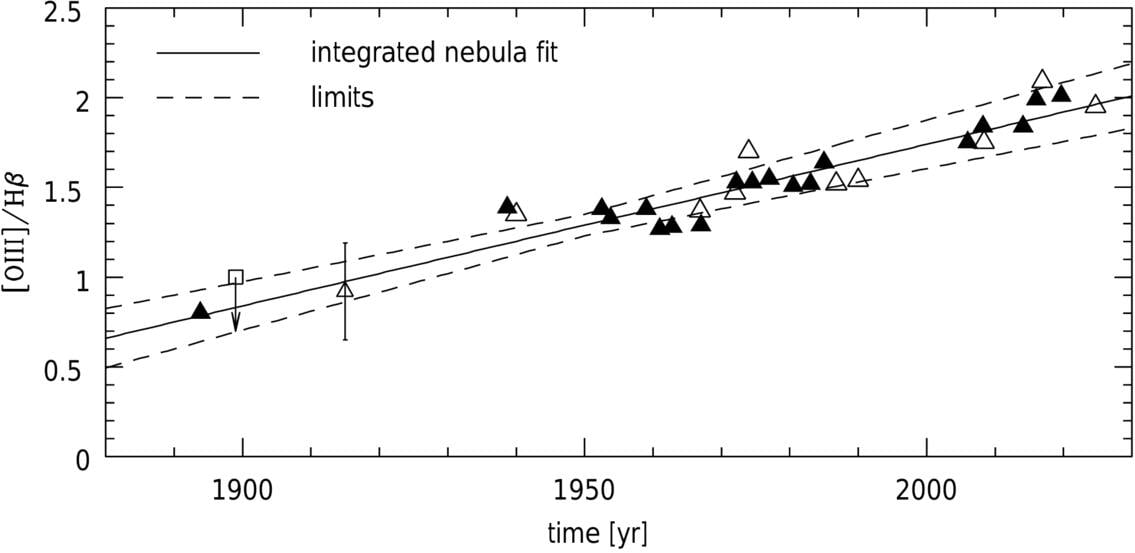 The change seen in IC418 over time in the study. Credit: University of Manchester/University of Hong Kong.
This finding is important in understanding how stars in their final stages are crucial to seeding carbon back into space. This surprising discovery may mean our understanding of carbon star evolution may be due for revision.
“IC418 is carbon-rich, meaning that the star became enriched in carbon prior to the ejection of the nebula,” says Zijlstra. Much of the carbon in the Universe comes from these types of stars. We were able to determine the original mass of the star (around 40% more than the mass of the Sun). This is lower than what models predict where carbon has come from. This, of course, is the source of the carbon that organic life is based on, so it is part of our own origin.”
This also demonstrates the value of using older observations. Another similar example was the 2016 discovery of possible signs of a planetary system around Van Maanen’s Star, seen on a glass plate from 1917.
It’s great to see old observations producing new science. What else is lurking in those old glass plate collections and notebooks, awaiting discovery?