
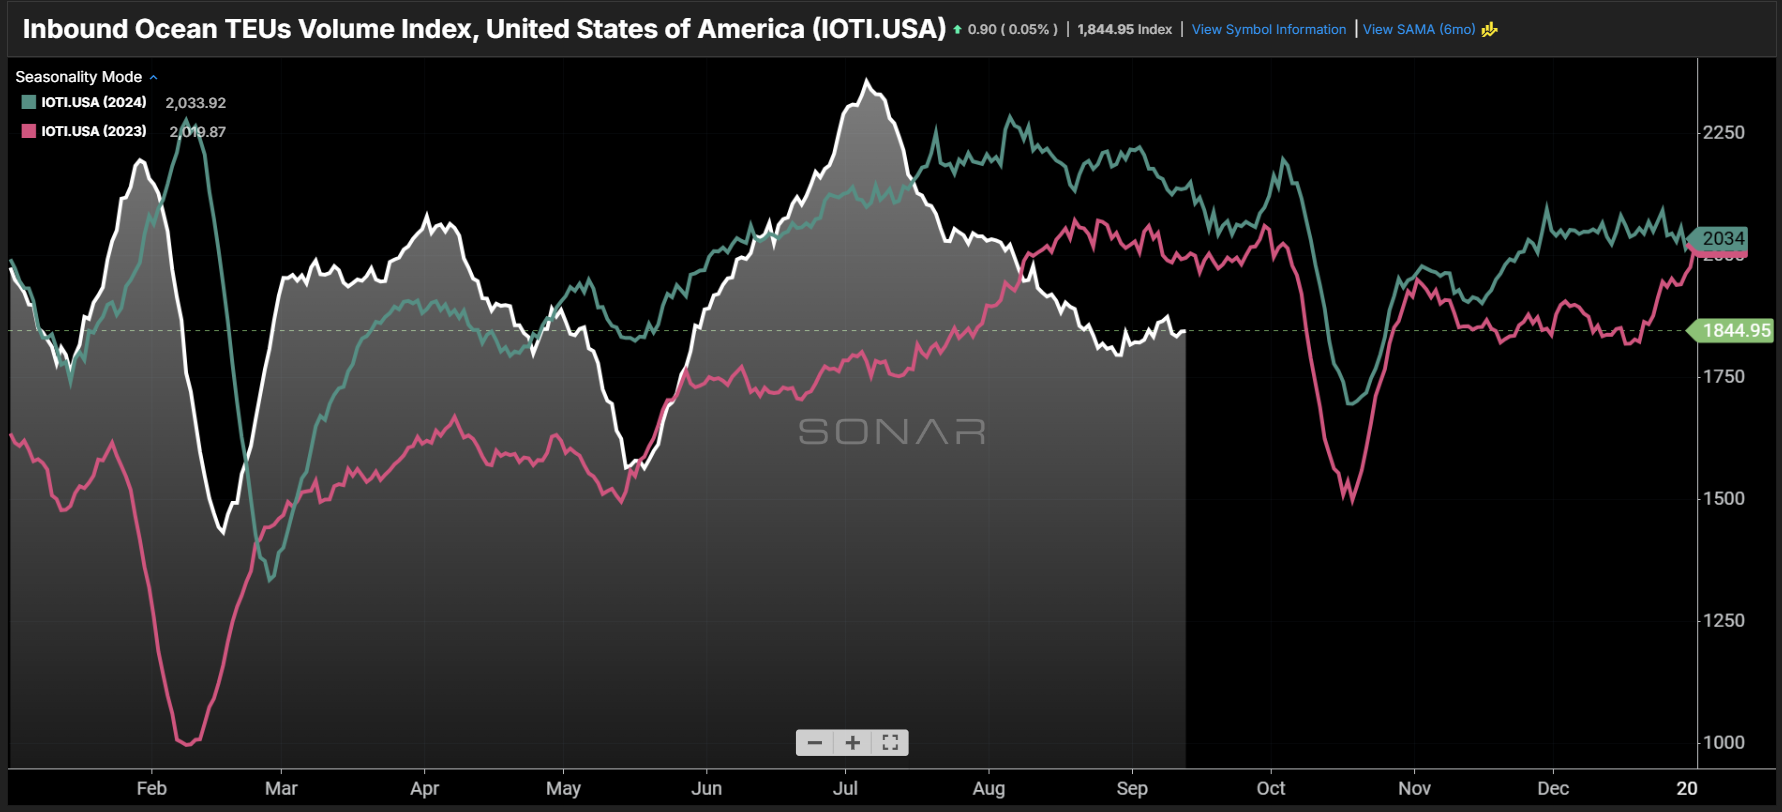
Chart of the Week: Inbound Ocean TEUs Volume Index – USA SONAR: IOTI.USA
The Inbound Ocean TEUs Volume Index (IOTI)—which measures bookings by departure date for containers originating from global ports bound for the U.S. — is currently running about 8% below 2023 levels for this time of year and nearly 14% below 2024. Have the waves of imports driven by geopolitical concerns and trade policy uncertainty finally stabilized?
The answer depends largely on whether shippers feel confident in their demand forecasts and inventory levels for the remainder of the year.
There has been no new clarity on U.S. trade policy. Courts have ruled portions of existing tariffs illegal, pending Supreme Court review, but shippers appear to have adjusted to a more subdued ordering cadence compared to the previous two years.
Seasonally, September is typically a month when import demand tapers off after the peak season — this year’s peak was partially driven by shippers responding to the temporary suspension of cost-prohibitive tariffs on China and occurred about a month and a half ahead of schedule.
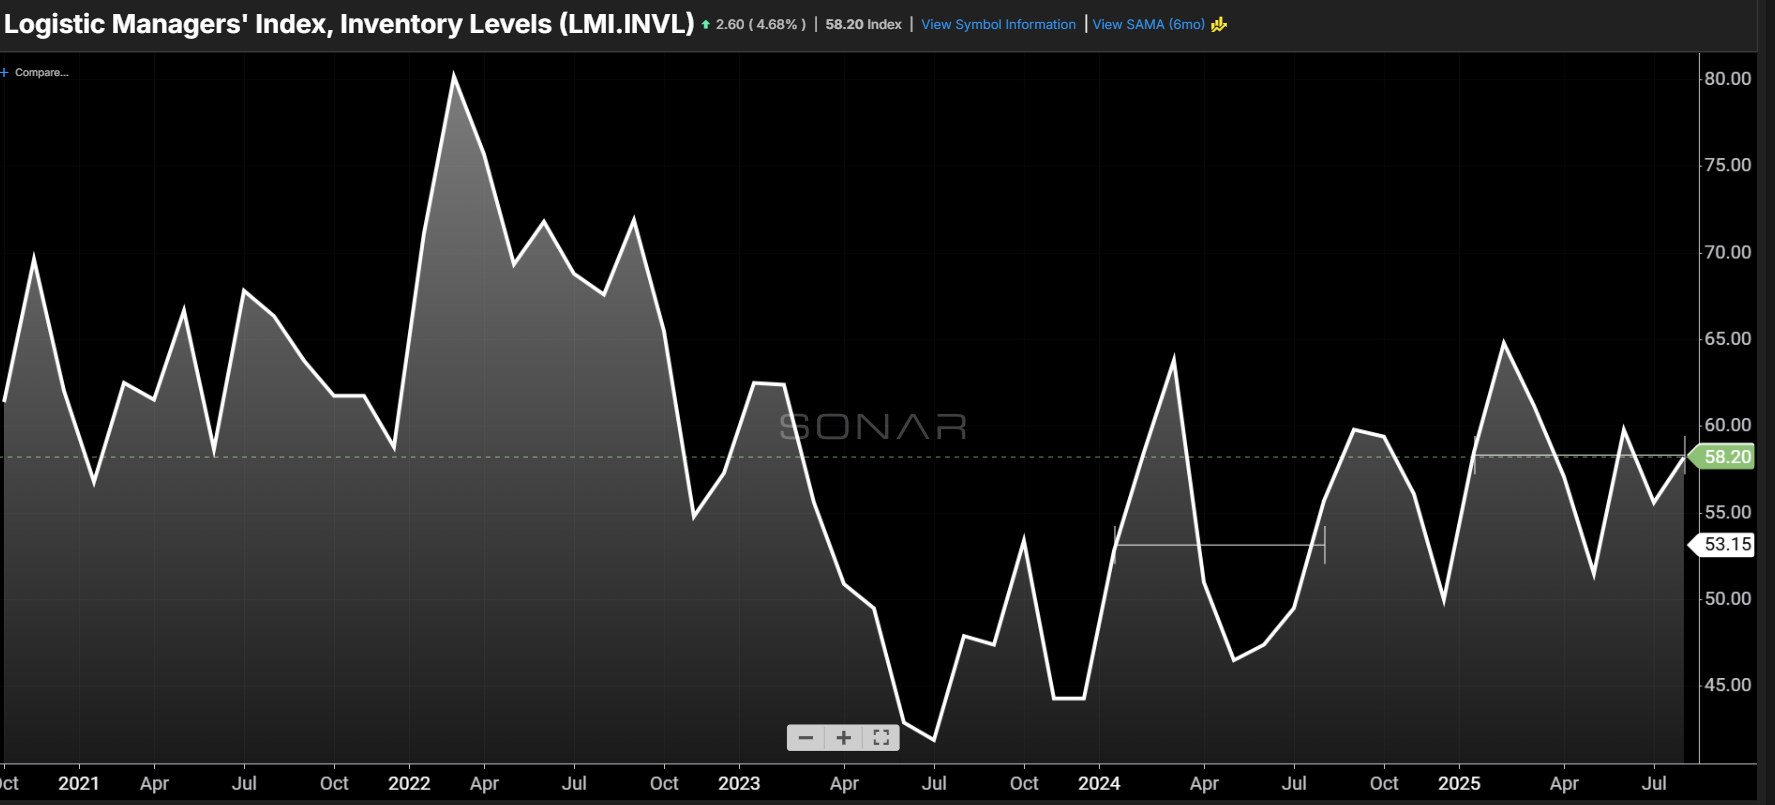
According to last month’s Logistics Managers’ Index (LMI), inventory levels grew modestly but at a slightly stronger pace than last year. In the LMI, values above 50 indicate expansion, while values below 50 indicate contraction. August’s inventory reading was 58.2, compared to 55.7 last year.
Inventory levels have been growing faster than in the previous two years since April, despite a sharp drop in May. This suggests demand has not been especially strong—a conclusion supported by domestic transportation data.
Intermodal container volumes moved by rail averaged about 1–2% higher year-over-year in August compared to 2024, while truckload tender volumes were down roughly 10–15%. Last week’s readings came in at -2% and -15% respectively for the two modes. These figures all point to weakening goods demand, even as retail sales remain “okay” — though it is worth noting that those sales figures are not adjusted for inflation.
A slow early fall does not necessarily guarantee a weak holiday season, especially if inventory was built up in advance, but it does hint at softening overall goods demand.
It’s worth noting that the IOTI remains well above the post-pandemic lows of late 2022 and early 2023. However, year-over-year comparisons are complicated by unusual seasonal patterns.
Overall, import demand is signaling a muted economic outlook for the remainder of the year and possibly into early 2026. Unless the American consumer once again surprises during the holidays, a moderate slowing trend seems likely.
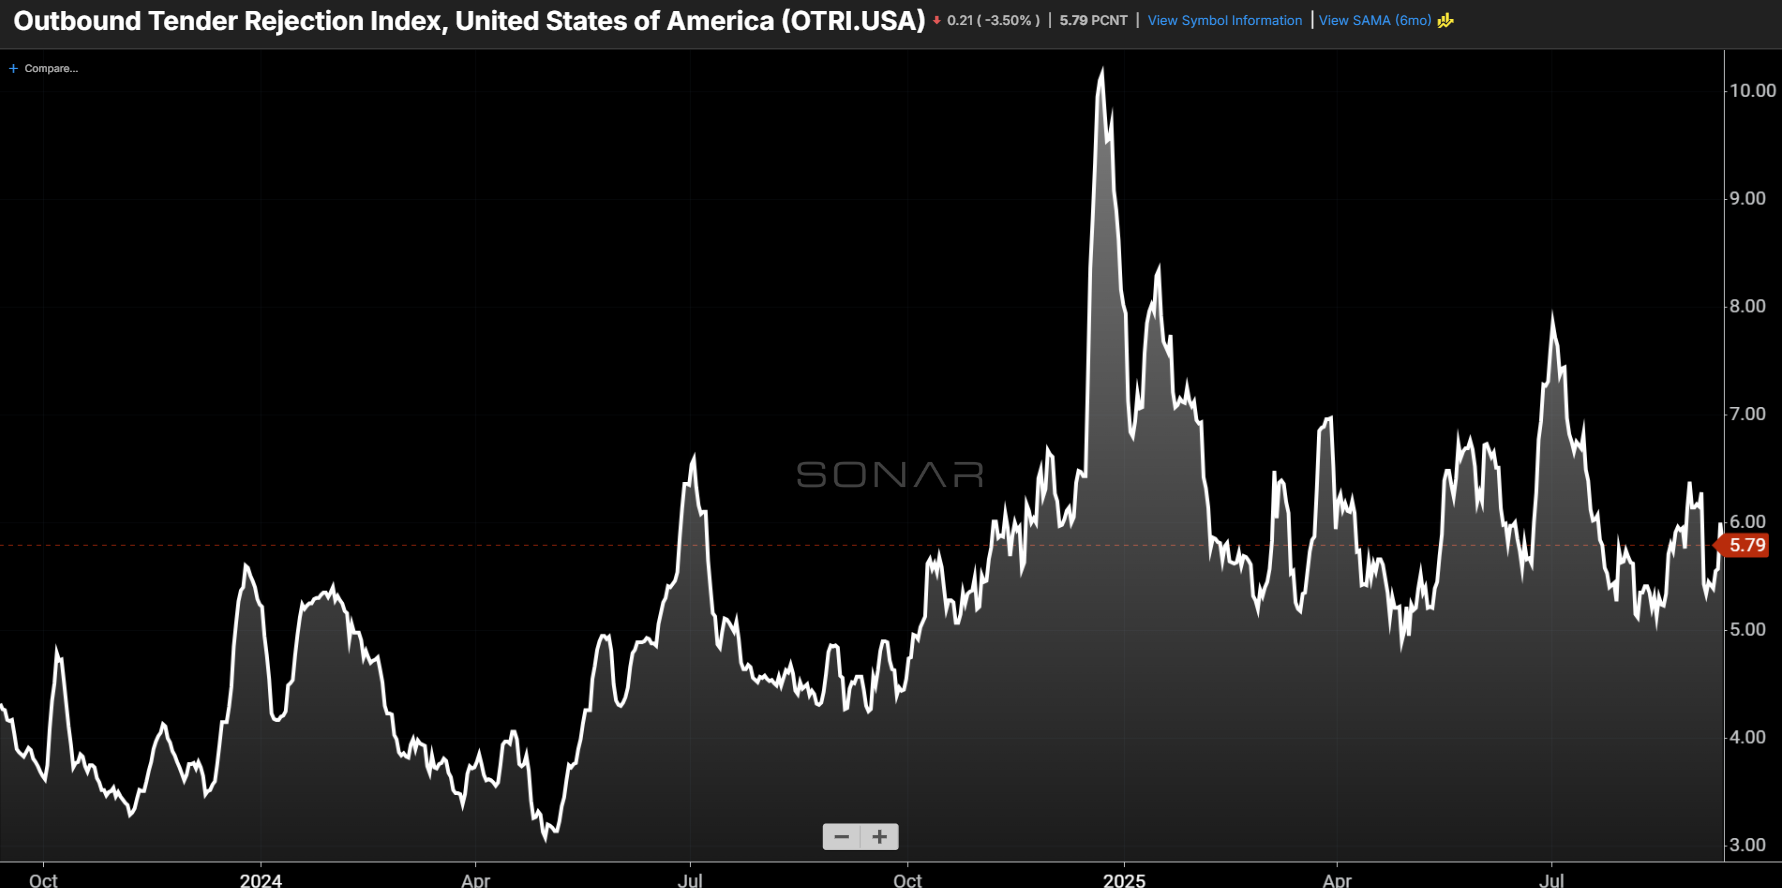
Waning demand does not necessarily mean that domestic transportation markets will soften. The truckload market has been in a contractionary cycle for nearly three years, with capacity steadily exiting. Despite tender volumes being about 15% lower, carriers are rejecting loads at a higher rate as their networks become increasingly unbalanced and less buffered.
This dynamic has already shown up in the spot market, which is now more reactive—rates spike and fall rapidly, a pattern that tends to become even more pronounced in November and December.
Ironically, a slowing goods economy may make conditions more difficult for shippers. As freight demand cools, the already strained transportation market could become even more challenging to navigate.
About the Chart of the Week
The FreightWaves Chart of the Week is a chart selection from SONAR that provides an interesting data point to describe the state of the freight markets. A chart is chosen from thousands of potential charts on SONAR to help participants visualize the freight market in real time. Each week a Market Expert will post a chart, along with commentary, live on the front page. After that, the Chart of the Week will be archived on FreightWaves.com for future reference.
SONAR aggregates data from hundreds of sources, presenting the data in charts and maps and providing commentary on what freight market experts want to know about the industry in real time.
The FreightWaves data science and product teams are releasing new datasets each week and enhancing the client experience.
To request a SONAR demo, click here.