
Data sources
We collected national-, state- and county-level animal inventories from the US Department of Agriculture-National Agricultural Statistics Service (USDA-NASS) for the year 2017 (https://quickstats.nass.usda.gov/)40 for dairy cows, beef cattle on feed, hogs, broilers, layers, pullets, turkeys and ducks. Aggregated county-level animal headcounts are lower than state-level totals as a result of redactions made by NASS to protect producer identities, which led to an underestimation of recoverable manure N at local level. To identify where discrepancies are most pronounced, we compared total excreted manure per animal type and M2N using aggregated county-level populations and obtained state population as aggregated state population is comparable to that of national data (Supplementary Figs. 7–9). The manure excretion factor, number of life cycles, animals per animal unit per confined animal type, proportion of manure that is recoverable and N and P retained in recoverable manure after losses during collection, transfer, storage and treatment were obtained from ref. 23. Manure currently applied on cropland, including corn, soybeans, wheat, cotton, barley, oats and peanuts and hay receiving manure and relative application rate were obtained from refs. 22,41 following protocols in the ManureMap Toolbox (https://acpf4watersheds.org/use-the-manuremap-toolbox/)42. Synthetic fertilizer (both N and P) consumption in 2017 at both national and county levels were obtained from the US Geological Survey report43. Crop production and acreages on national and county scales were obtained from USDA-NASS40, including 21 common US crops: alfalfa hay, apples, barley, dry beans, canola, corn for grain, corn for silage, cotton, other hay, oranges, peanuts, potatoes, rice, sorghum, soybeans, sugar beets, sugarcane, sunflower, sweet corn, tobacco and wheat. We used N content data for those 21 common US crops provided by NUGIS team4. P-content data were obtained from ref. 44. For the national-level analysis, current crop-specific NUE for the USA was derived from ref. 20 using the average estimates from 2010 to 2015 (Supplementary Table 12). For the county-level analysis, we applied state-specific average NUE values for corn and wheat (Supplementary Table 8) over the same period from ref. 45, while NUE values for the remaining crops were held constant using the national-level estimates as a result of a lack of spatially explicit data. The harvested area of crops and N deposition rate on cropland were derived from USDA-NASS40 and the National Atmospheric Deposition Program (NADP)46, respectively. Total volume of irrigation water used in agricultural production and its N content were obtained from AQUASTAT (https://data.apps.fao.org/aquastat/?lang=en) and literature47,48.
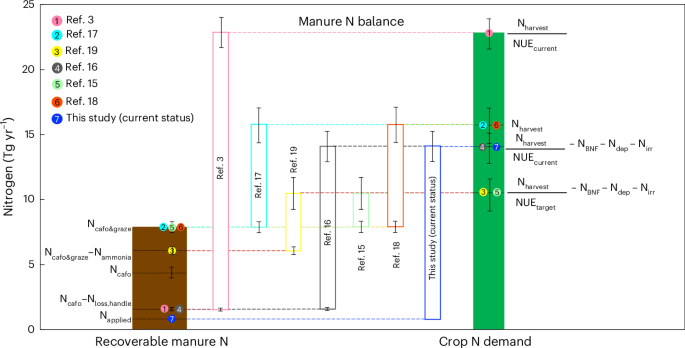
Divergent estimates of manure N balance among published studies
To compare manure N balance assessments and their implications across studies, we calculated recoverable manure N and crop N demand metrics using the contiguous USA as an example using their methods. Data inputs included national inventories of animal populations and crop production and acreages from USDA-NASS for 201740. While replicating each approach, we updated certain coefficients, such as animal excretion factors, manure recoverability rates and crop NUE as detailed in ‘Data Sources’, to better reflect the US context, while maintaining the original interpretive intent of each approach (Supplementary Information Section 3).
System boundary
The system boundary in this study defines how the proposed framework is applied to the US case (Supplementary Fig. 5). The system in this study includes manure N excreted by eight types of confined livestock and N demand from 21 US common crops that are harvested and removed from the field. Manure produced under confinement conditions is routinely collected and removed from built areas, making it suitable for evaluating recovery potential and substitution for synthetic fertilizers. Manure excreted by grazing livestock and demand from pasture or rangeland were excluded. Manure from grazing livestock deposits directly onto pasture, where it contributes to an internal nutrient cycle: animals consume forage, excrete manure onto the land and the nutrients are largely absorbed by the regrowing pasture biomass. Intervening in this internal nutrient cycle would not only be technologically challenging under current practices but could also undermine pasture productivity, potentially increasing demand for synthetic fertilizers. Although localized nutrient surpluses may occur in overgrazed areas, such imbalances are context-specific and are best addressed through targeted, site-level management strategies. Including grazing systems in this analysis would introduce considerable uncertainty due to limited data on grazing intensity, forage productivity and manure nutrient dynamics.
Methods for estimating recoverable manure N metrics
In the framework, we included three recoverable manure N metrics, including the current state and two future potentials considering minimizing unrecovered manure with current technology and achieving 100% manure recovery through technological and economic improvements (Supplementary Table 13). First, we estimated total manure N excreted by all confined livestock using livestock inventory and sales data considering life cycle, animals per animal unit (AU) and excretion factors provided in ref. 23, as shown in equation (1),
$$\begin{array}{l}\mathrm{Total}\,\mathrm{excreted}\,\mathrm{manure}\,{\rm{N}}\\ =\mathop{\sum }\limits_{{{i}}=1}^{8}{\mathrm{average}\,\mathrm{annual}\,\mathrm{animal}\,\mathrm{unit}\,(\mathrm{AU})}_{{{i}}}\times {{\rm{N}}\,\mathrm{excretion}\,\mathrm{factor}}_{{\rm{i}}}\end{array}$$
(1)
$$\begin{array}{l}{{\rm{Average}}\,{\rm{annual}}\,{\rm{AU}}}_{i}=\left\{\left(\displaystyle\frac{{{\rm{inventory}}}_{i}}{{{\rm{cycles}}}_{i}}\right)\right.\\\left.+\left[\displaystyle\frac{{{\rm{sales}}}_{i}}{{{\rm{cycles}}}_{i}}\times \displaystyle\frac{{({\rm{cycles}}}_{i}-1)}{{{\rm{cycles}}}_{i}}\right]\right\}\times \displaystyle\frac{1}{{{\rm{animals}}\,{\rm{per}}\,{\rm{AU}}}_{i}}\end{array}$$
(2)
Where total excreted manure N is the amount of N in manure produced from all confined livestock, average annual AUi is a measure for standardizing livestock population based on live animal weight per livestock type i. One AU represents 1,000 lb of live animal weight23. The number of average annual AU is calculated on the basis of number of livestock sold (salesi) or on hand at the end of the year (inventoryi), as shown in equation (2). N excretion factori is N content in manure produced per AU by livestock type i (Supplementary Table 7).
With current manure handling and management technologies, portions of total excreted manure N produced by all confined livestock are lost without being effectively recycled. Considering these losses, we estimated potentially recoverable manure N as another metric by multiplying total excreted manure N with recoverability factors and proportion of retained N provided in ref. 23, as shown in equation (3) and the difference between total excreted manure N and potentially recoverable manure N is M2N, as shown in equation (4).
$$\begin{array}{l}\mathrm{Potentially}\,\mathrm{recoverable}\,\mathrm{manure}\,{\rm{N}}\\ =\mathop{\sum }\limits_{{{i}}=1}^{8}{\mathrm{total}\,\mathrm{excreted}\,\mathrm{manure}\,{\rm{N}}}_{{{i}}}\\ \times {\mathrm{recoverability}\,\mathrm{factors}}_{{{i}}}\times {\mathrm{proportion}\,\mathrm{of}\,\mathrm{retained}\,{\rm{N}}}_{{{i}}}\end{array}$$
(3)
$${{\rm{M}}2}_{{\rm{N}}}={\rm{total}}\,{\rm{excreted}}\,{\rm{manure}}\,{\rm{N}}-{\rm{potentially}}\,{\rm{recoverable}}\,{\rm{manure}}\,{\rm{N}}$$
(4)
Where potentially recoverable manure N is recoverable manure N after considering losses during collection, transfer, storage and treatment given an assumed level of adoption of current N-efficient technologies; total excreted manure Ni is N in manure as excreted per confined livestock; recoverability factorsi is portion of total excreted manure by livestock type i that is regularly gathered and removed from facilities where livestock are housed, making it available for land application or other purposes; and proportion of retained Ni is proportion of N retained in the recoverable manure depending on livestock type adjusted for losses through volatilization, denitrification and spillage. Recoverability factors range from 68% to 96%. The proportion of retained N varies between 25% and 69%, depending on livestock type23 (Supplementary Table 14). National- and county-level quantifications were performed using the same set of equations (equations(1)–4)), based on animal inventory data separately obtained from USDA-NASS40 at the national and county scales.
As the potentially recoverable manure is estimated using generalized recoverability factors based on assumptions about livestock type, region and operations size23, there may exist discrepancies between expected potential and actual manure recovery with existing technologies. Therefore, using survey data from ref. 22, we estimated currently applied manure N using manure application rate data and the proportion of major field crop acres receiving manure, calculated for each crop type using equation (5) and the difference between potentially recoverable manure and currently applied manure is M1N, as shown in equation (6).
$$\begin{array}{l}\mathrm{Currently}\,\mathrm{applied}\,\mathrm{manure}\,{\rm{N}}\\ =\mathop{\sum }\limits_{{{j}}=1}^{8}{\mathrm{manured}\,\mathrm{crop}\,\mathrm{area}}_{{{j}}}{\times \mathrm{manure}\,{\rm{N}}\,\mathrm{application}\,\mathrm{rate}}_{{{j}}}\end{array}$$
(5)
$${{\rm{M}}1}_{{\rm{N}}}={\rm{potentially}}\,{\rm{recoverable}}\,{\rm{manure}}\,{\rm{N}}-{\rm{currently}}\,{\rm{applied}}\,{\rm{manure}}\,{\rm{N}}$$
(6)
Where currently applied manure N is N in manure applied to cropland nationwide; manure crop areaj is the crop area (acre) that receive manure application per crop type j; and manure N application ratej (lbN acre−1) is land-applied manure N per crop type j. The field crops include corn, soybeans, wheat, cotton, barley, oats, peanuts and hay22,41,42. Detailed values can be found in the Supplementary Table 15. Methods for downscaling currently applied manure to the county level are described in Supplementary Information Section 6.
Methods for estimating constrained recoverable manure N considering P overapplication
Owing to the relatively low N:P ratio in manure, applying manure N to meet crop N needs may result in P overapplication. To account for this, we defined \({{\rm{M}}1}_{{\rm{N}}}^{\ast }\) and \({{\rm{M}}2}_{{\rm{N}}}^{\ast }\) as the constrained levels of recoverable manure N under current (M1N) and future (M2N) technologies that avoid excessive manure P application to cropland. The key criterion for considering P overapplication risks is that the P content in the recoverable manure cannot exceed the current P input from the synthetic fertilizers when used as a replacement. We calculated recoverable manure P using the same methodology as for N, according to refs. 22,23 (national level: total excreted manure P = 0.9 Tg yr−1; potentially recoverable manure P = 0.7 Tg yr−1; currently applied manure P = 0.2 Tg yr−1).
We first compare the additional recoverable manure phosphorus (P) under current technology in county MIP,ct with currently applied fertilizer P to cropland (fertilizer Pct) in each county (ct). The recoverable manure N under current technology (MIN,ct) remains unchanged when MIP,ct is less than fertilizer Pct; otherwise, it is revised down to match fertilizer Pct and then converted back to N as \({{\rm{M}}1}_{{\rm{N}},{\rm{ct}}}^{\ast }\), using the N:P ratio in the recoverable manure under current technology \(\left(\frac{{{\rm{M}}1}_{{\rm{N}},{\rm{ct}}}}{{{\rm{M}}1}_{{\rm{P}},{\rm{ct}}}}\right)\).
$$\begin{array}{l}\begin{array}{l}{{\rm{M}}1}_{{\rm{N}},\mathrm{ct}}^{\ast }=\left\{\begin{array}{l}{{\rm{M}}1}_{{\rm{N}},\mathrm{ct}}\,\mathrm{when}\,{{{\rm{M}}1}_{{\rm{P}},\mathrm{ct}}\le \mathrm{fertilizer}\,{\rm{P}}}_{\mathrm{ct}}\\ {\mathrm{fertilizer}\,{\rm{P}}}_{\mathrm{ct}}\times \frac{{{\rm{M}}1}_{{\rm{N}},\mathrm{ct}}}{{{\rm{M}}1}_{{\rm{P}},\mathrm{ct}}}\mathrm{when}\,{{{\rm{M}}1}_{{\rm{P}},\mathrm{ct}} > \mathrm{fertilizer}\,{\rm{P}}}_{\mathrm{ct}}\end{array}\right.\end{array}\end{array}$$
(7)
\({{\rm{M}}2}_{{\rm{N}},{\rm{ct}}}^{\ast }\) is calculated using a similar approach:
$$\begin{array}{l}\begin{array}{l}{{\rm{M}}2}_{{\rm{N}},\mathrm{ct}}^{\ast }=\left\{\begin{array}{l}{{\rm{M}}2}_{{\rm{N}},\mathrm{ct}}\,\mathrm{when}\,{{{\rm{M}}2}_{{\rm{P}},\mathrm{ct}}\le \mathrm{fertilizer}\,{\rm{P}}}_{\mathrm{ct}}-{{\rm{M}}1}_{{\rm{P}},\mathrm{ct}}\\ {(\mathrm{fertilizer}\,{\rm{P}}}_{\mathrm{ct}}-{{\rm{M}}1}_{{\rm{P}},\mathrm{ct}})\times \frac{{{\rm{M}}2}_{{\rm{N}},\mathrm{ct}}}{{{\rm{M}}2}_{{\rm{P}},\mathrm{ct}}}\mathrm{when}\,{{{\rm{M}}2}_{{\rm{P}},\mathrm{ct}} > \mathrm{fertilizer}\,{\rm{P}}}_{\mathrm{ct}}-{{\rm{M}}1}_{{\rm{P}},\mathrm{ct}}\end{array}\right.\end{array}\end{array}$$
(8)
We then aggregated county-level values (\({{\rm{M}}1}_{{\rm{N}},{\rm{ct}}}^{\ast }\) and \({{\rm{M}}2}_{{\rm{N}},{\rm{ct}}}^{\ast }\)) to the national level to obtain \({{\rm{M}}2}_{{\rm{N}}}^{\ast }\) and \({{\rm{M}}1}_{{\rm{N}}}^{\ast }\), from which we derived the proportions of recoverable manure N that can be applied without overapplying P. Conceptual diagrams illustrating how adjusted levels of recoverable manure N are determined on the basis of current synthetic fertilizer P application are provided in Supplementary Fig. 6.
As this framework is applied to the USA, we adopted a consistent approach to address potential P overapplication by constraining recoverable manure P so that it does not exceed current synthetic fertilizer P inputs. However, this approach may require adjustment in regions with P use efficiency (PUE) >1 (defined as the ratio of harvested crop P products to current P inputs including synthetic fertilizer and manure) and where P-deficient soils are being ‘mined’ of native soil P due to little or no P input. Such conditions are more common in low-income countries with limited access to P input, where the P demand by cropland should at least match the P in harvested crop products and could be increased further to help close estimated yield gaps. As more data on soil P availability become available, estimates of crop P demand and manure recovery potential can be further refined when applying this framework to such regions.
Methods for estimating crop N demand metrics
In the framework, we quantified two crop N demand metrics, including the current state and one future potential with target crop NUE. To quantify the manure-replaceable crop N demand with current NUE, at the national level, we multiplied the crop products by the N contents provided from NUGIS4 (Supplementary Table 16) and divided by current crop-specific NUE estimates from ref. 20 (Supplementary Table 12). At the county level, we applied state-specific NUE values for corn and wheat from ref. 45, while NUE values for the remaining crops were held as the national-level estimates. For both national- and county-level calculation, we subtracted BNF, atmospheric deposition and irrigation water to account for demands that are unlikely to be replaced by manure, as shown in equation (9):
$$\begin{array}{l}{\rm{manure}}-{\rm{replaceable}}\,{\rm{crop}}\,{\rm{N}}\,{\rm{demand}}\,{\rm{with}}\,{\rm{current}}\,{\rm{crop}}\,{\rm{NUE}}\\=\mathop{\sum }\limits_{j=1}^{21}\displaystyle\frac{{{\rm{crop}}\,{\rm{products}}}_{j}\times {{\rm{N}}\,{\rm{content}}}_{j}}{{{\rm{NUE}}}_{j}}-{\rm{BNF}}-{\rm{deposition}}-{\rm{irrigation}}\end{array}$$
(9)
$$\begin{array}{l}\begin{array}{l}{\mathrm{NUE}}_{j}^{\mathrm{ct}}=\left\{\begin{array}{l}{\mathrm{NUE}}_{j}^{s(\mathrm{ct})}\mathrm{if}\,\mathrm{crop}\,j\in \{\mathrm{corn},\mathrm{wheat}\}\\ {\mathrm{NUE}}_{j}^{\mathrm{nt}}\mathrm{otherwise}\end{array}\right.\end{array}\end{array}$$
Where, manure − replaceable crop N demand with current crop NUE, is the estimated current crop N demand, after subtracting BNF, deposition and irrigation water; crop productsj is the harvested amount of crop j; N contentj is the N content in crop j; NUEj refers to the average NUE for crop j; \({{\rm{NUE}}}_{j}^{s({\rm{ct}})}\) is the state-average NUE for corn or wheat from ref. 45 in the state that county ct belongs to; \({{\rm{NUE}}}_{j}^{{\rm{nt}}}\) is the national average NUE for crop \(j\) from ref. 20.
Considering improvements in crop NUE can potentially reduce N required by crops, we estimated another metric assuming target crop NUE of 80%, as shown in equation (10) and iNUE refers to the difference between manure − replaceable crop N demand with current crop NUE and manure − replaceable crop N demand considering target crop NUE, as shown in equation (11).
$$\begin{array}{l}{\rm{manure}}-{\rm{replaceable}}\,{\rm{crop}}\,{\rm{N}}\,{\rm{demand}}\,{\rm{with}}\,{\rm{target}}\,{\rm{crop}}\,{\rm{NUE}}\\=\mathop{\sum }\limits_{j=1}^{18}\displaystyle\frac{{{\rm{crop}}{\rm{products}}}_{j}\times {{\rm{N}}{\rm{content}}}_{j}}{80{\rm{ \% }}}\\+\sum \displaystyle \frac{{{\rm{crop}}{\rm{products}}}_{{\rm{soybean}},{\rm{cotton}},{\rm{potato}}}\times {{\rm{N}}{\rm{content}}}_{{\rm{soybean}},{\rm{cotton}},{\rm{potato}}}}{{{\rm{NUE}}}_{{\rm{soybean}},{\rm{cotton}},{\rm{potato}}}}\\-{\rm{BNF}}-{\rm{deposition}}-{\rm{irrigation}}\end{array}$$
(10)
$$\begin{array}{l}\mathrm{iNUE}=\mathrm{manure}-\mathrm{replaceable}\,\mathrm{crop}\,{\rm{N}}\,\mathrm{demand}\,\mathrm{with}\,\mathrm{current}\,\mathrm{crop}\,\mathrm{NUE}\\ \,\,\,\,\,\,\,\,-\mathrm{manure}-\mathrm{replaceable}\,\mathrm{crop}\,{\rm{N}}\,\mathrm{demand}\,\mathrm{with}\,\mathrm{target}\,\mathrm{crop}\,\mathrm{NUE}\end{array}$$
(11)
Where, manure − replaceable crop N demand with target crop NUE, is the estimated crop N demand assuming target NUE of 80%. NUEsoybean,cotton,potato is the current NUE for soybean, cotton and potato as their current NUE levels are already greater than 80%. Detailed values can be found in Supplementary Table 12. We performed national- and county-level quantifications using the same set of equations (equations(9)–11)), based on crop production and acreage data separately obtained from USDA-NASS40 at the national and county scales. We also conducted sensitivity analyses to assess how variations in target crop NUE may influence the potential for manure recycling (Supplementary Information Section 9).
Downscaling currently applied manure N
While the farmer survey conducted by Lim et al.22 provides information on currently applied manure, it is not spatially explicit22. Therefore, it is necessary to develop a method to estimate the currently applied manure N metric using the survey data in combination with other available spatial datasets. To address this, we used crop-level information on the share of manure received from each animal source (Fig. 6 in ref. 22) to estimate the contribution of each livestock type to overall manure N application. By aggregating the manure shares across all crops, we estimated the proportion of total applied manure originating from each animal category (for example, dairy, beef, hogs and poultry). We then calculated the percentage of excreted manure N that is applied to cropland by livestock type, ranging from 11% to 31% (Supplementary Table 17). CAFO manure applied to hay was excluded in county-level estimates because of the absence of data on source-specific application rates and total manure applied to hay was estimated at only 0.08 TgN nationally41,42, representing a relatively small portion of overall manure application.
$$\begin{array}{l}{{\rm{CurrentlyappliedmanureN}}}_{{\rm{ct}}}=\displaystyle \mathop{\sum }\limits_{i}^{8}\left[{{\rm{totalexcretedmanureN}}}_{i,{\rm{ct}}}\right.\\\left.\times \left(\displaystyle \frac{\sum {{\rm{share}}\,{\rm{of}}\,{\rm{manure}}\,{\rm{source}}}_{j}^{i}\times {{\rm{currentlyappliedmanureN}}}_{j}}{{{\rm{total}},{\rm{excreted}},{\rm{manure}},{\rm{N}}}_{i}}\right)\right]\end{array}$$
(12)
Where, currently applied manure Nct, is the estimated amount of manure N applied to cropland in county ct; total excreted manure Ni,ct is the total manure N excreted by livestock type i in county ct; share of manure sourceij is the share of manure applied to crop j that originates from livestock type i, derived from Fig. 6 in ref. 22; currently applied manure Nj is the national-level applied manure N applied to crop j; total excreted manure Ni is the total manure N excreted nationally by livestock type i.
Evaluating priorities of counties in improving manure recycling
We applied the framework to the county level and calculated the county-level current manure N balance (the difference between currently applied manure N and current crop N demand). Next, we assessed the improved manure N balance by progressively adding M1N, M2N and iNUE to evaluate how counties could meet crop N needs using local manure N sources but with future potentials of recoverable manure N and crop N demand metrics. This stepwise approach helps to identify varying priorities of counties in improving manure recycling. These include counties with excess manure, where currently applied manure N already exceeds manure-replaceable crop N demand with current NUE; counties with the potential to reach balance, where the manure N balance can transition from negative to equal or greater than 0 with improved practices (M1N; M1N + M2N; M1N + M2N + iNUE); and counties with excess crop demand where the manure N balance remains negative after adopting M1N, M2N and iNUE.
Uncertainty analysis
We used a Monte Carlo approach to estimate uncertainty in recoverable manure N and crop N demand metrics. Uncertainty propagation was performed using 500 Monte Carlo iterations, in which key input parameters were randomly sampled from distributions defined by their means and standard deviations. Parameters include manure excretion factors, manure recoverability factors across animal types, harvested crop N products and crop-specific NUE. We calculated means and derived the standard deviations. For manure excretion factors and harvested crop N products, coefficients of variation were derived from several widely cited US-based studies23,49,50,51,52,53,54 and applied to values reported in ref. 23 and to harvested crop N estimated from USDA-NASS data40, respectively, to obtain standard deviations (Supplementary Tables 19 and 20). Manure recoverability factors were characterized using mean values and standard deviations from Table 9 in ref. 23, accounting for regional variation across animal types (Supplementary Table 20). Crop-specific NUE means and standard deviations were derived from data spanning 2010–2015 (Supplementary Table 12). The results we presented are shown as mean ± 1 s.d.
Reporting summary
Further information on research design is available in the Nature Portfolio Reporting Summary linked to this article.