
Auckland Transport tested their planned City Rail Link timetable in January, and it wasn’t a success. We know they plan to make some changes before their next test run in April. In the meantime, a close look at the tested timetable reveals some useful insights into their approach – and some concerning details when it comes to how the timetable will actually work for the people who’ll be relying on it.
As AT reported back to Auckland Council’s Transport and Infrastructure Delivery Committee:
The key actions that have come out of the January test are that we do need to look at the maximum peak frequencies going through some of the highly congested points on the existing network — in particular at the junction between Wiri, Ōtāhuhu, and Westfield. That’s where the highest congestion on the network occurs. [emphasis added]
It seems their response to this challenge will be to cut some services, to reduce pressure.
But before we learnt about the outcomes of the test, we – and others – were interested in understanding just what AT’s plans for the CRL timetables were. Such as, how would frequencies change over the course of the day? Would headways be consistent? Would we see any benefit to travel times, after all of the wider rail network disruption we’ve endured for nearly six years?
We recently requested and received the timetable that AT tested, which represents a Monday to Thursday timetable. While we know it won’t be the final version of what is rolled out later this year, it gives a good indication of the answers to the questions above.
Below are some comments they included in their reply to us:
This test of the new timetable, known internally as Test Case 72 (TC-72), involved the execution of a timetable that differed materially from the current operational timetable. TC-72 tested increased train frequency, with more services operating to more stations across the region, using different operational patterns – alongside passenger information systems.
It included conducting the first dry run of the new train service pattern, including:
Morning and evening peak simulations;Transitions between peak and off peak service levels;High-frequency peak service levels;Disruption recovery scenarios;Concurrent operation of passenger, freight, and interregional services (e.g., Northern Explorer, Te Huia).
The morning peak, for example, testing included up to 16 trains per hour, per direction (tphd) through the CRL tunnels and 20 tphd through the Westfield Junction. A service pattern visualisation is provided below.
And, on the outcomes of the test:
The timetable tested included high-frequency peak services to stress test the existing network at the highest points of congestion on the network. It was identified that this created pressure points, in particular around the section between Wiri and Westfield, due to the combination of:
Frequent AT trains (South City Line trains and East West Line trains converge in this area),Movements of Te Huia and freight trains,Movements in and out of depots in this area.
The operation of high frequency services with short headways at the highest congestion points and junctions on the existing network provides little headroom for service recovery. Managing an unplanned incident in this context helped us to understand the flow on effects across the network.
On day 1 (27 Jan), start-up was slower than planned due to train positioning challenges. Revised plans for Day 2 delivered a smoother morning start and demonstrated the value of iterative improvement.
So, let’s dig into some of the details buried within the data.
Frequency
Frequency is perhaps the most important factor when it comes to public transport – how often the trains show up, and also, how long you’d need to wait on average.
Trains per hour
Trains per hour (TPH) is a useful metric for understanding the frequency of service on a given line. AT’s plans around train frequency have been signalled for a long time: essentially, the three main lines would see a frequency of four trains per hour during the day and an additional four trains per hour during peak times.
With one exception: the Western Line, which would only see the additional trains in the peak direction. This is due to AT’s concerns about the impact of more services on the many level crossings on the Western Line.
There is still more we can learn by looking at these timetables, and I’ve made some charts to show what I’m seeing.
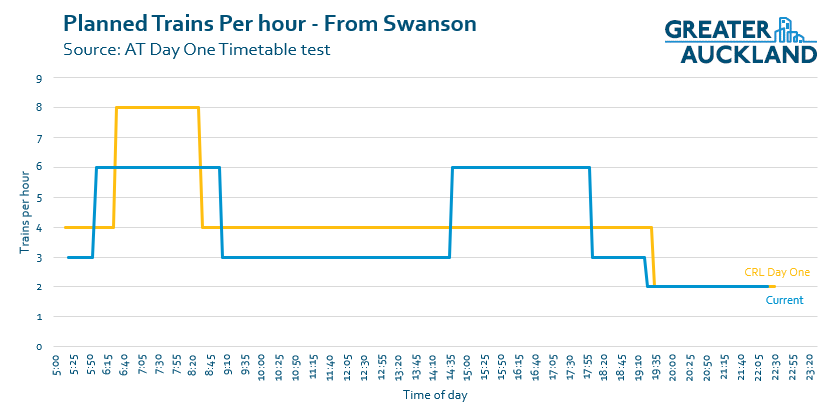
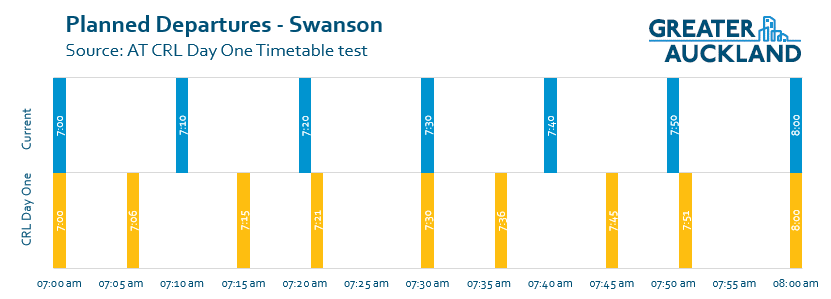
These first charts below show the number of services per hour over the course of the day, departing from Swanson, Manukau or Papakura, for the tested timetable – compared to the existing timetables.
Starting with Swanson: the thing that stands out is that while post-CRL there would be more trains per hour in the middle of the peak period, the time-span of the peak periods is shorter.
You’ll also notice that in the evening, we’re still seeing services drop back to just two trains an hour. While that might fall within AT’s technical definitions of what Rapid Transit should be (at least every 15 minutes from 7am to 7pm), to me this really isn’t an acceptable standard for what should be the core of our public transport network.
By comparison, the NX1 (North Shore express bus) has services to the city at least every 10 minutes all the way through to 11pm – and the NX2 and WX1 also run at least every 15 minutes till after 11pm.
Looking at trains from Manukau: there’s a dip in frequency in the middle of the morning peak. This is because two services are set to start from Puhinui instead of Manukau before heading up the Eastern Line and then out along the Western Line to Swanson.
These are trains coming straight out of the depot, so presumably this is about reducing movements though the Wiri junction in the middle of the peak.
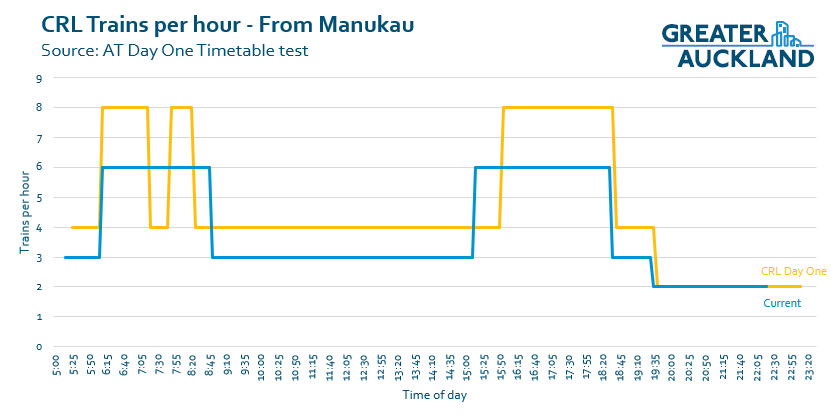
The Eastern Line actually gets a bit more interesting north of Otāhuhu. During the peak, there are an additional two services an hour that start from Sylvia Park, meaning the inner-Eastern Line gets up to 10TPH in the morning. (There’s something else interesting about those Sylvia Park services which I’ll cover later in the post.)
Finally, looking at trains from Papakura: while Papakura itself would see 8TPH at peak, the same can’t be said for the stations just up the track. That’s because some of those additional trains from Papakura are “limited stop” services – meaning they’ll sail past stations like Manurewa, which will still only get 6TPH just like today. And, depending on your destination, there might only be four per hour.
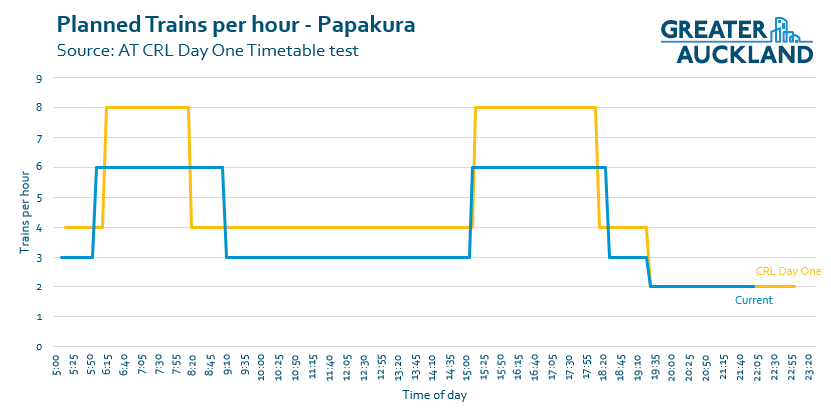
You may also notice that the span of services hasn’t increased much, between today’s timetable and the tested post-CRL timetable. One area where this will have an impact is for airport connections. The Airport Link bus runs every 10 mins until just before 1am – but the last train north from Puhinui is 10:48pm, and last one south is 11:07pm. So, good luck getting home if you’re arriving on a late flight, or even if your flight is a bit late.
Headways
For the best outcomes, services will ideally be evenly spaced: for example, if the service level is 6TPH then ideally trains arrive every 10 minutes. At 8TPH – an average spacing of 7.5 minutes – alternating 7 and 8 minute gaps between services is the best that can be expected.
Off-peak, when services are at 4TPH, the current timetable is showing exactly 15 minutes between services, like clockwork. But when all of the additional post-CRL peak services are overlaid, we’re not seeing that even spacing. What that means is that in some cases, the quality of the services will be worse than it is today.
Below, I’ve pulled together some comparisons of departure times for the tested post-CRL timetable versus departure times for the existing timetable, from 7am to 8am. Other parts of the peak will reflect this same pattern.
First up, the Western Line: which, with the tested-timetable, has perhaps the best spread of headways, with gaps between services of six and nine minutes. Not great but not terrible.
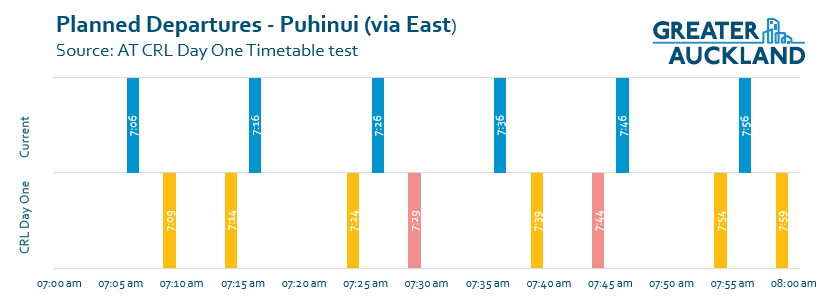
Next we move to the Eastern Line. For this, I’ve used Puhinui instead of Manukau to show those two extra services (in red) I mentioned earlier. The spacing between services here is five and ten minutes – so slightly worse than from Swanson. And if you’re coming from Manukau, you’ll face up to a 15-minute gap in the morning peak.
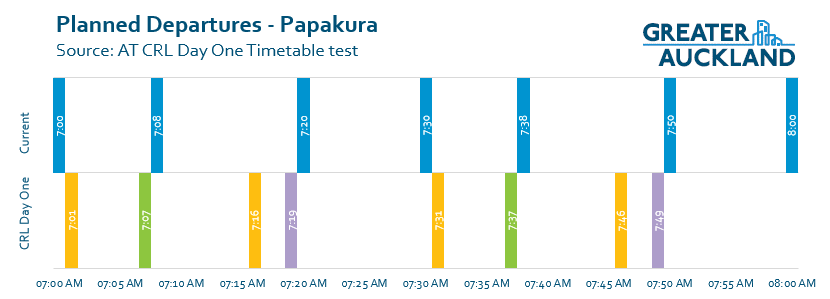
Then we have Papakura – and here’s where things get silly. In the CRL Day One timetable a tested, the gap between services from Papakura varies from 12 minutes to as little as three minutes. But you’ll also need to pay careful attention to what kind of service it is.
The yellow services come from Pukekohe, run every 15 minutes (all day), and stop at all stations.The green services also originate in Pukekohe – but after Papakura, they will only stop at Puhinui before travelling via the Eastern Line to Waitematā and through the CRL.The purple services start from Papakura, running all stops to Otāhuhu, then skipping Penrose, Ellerslie, Greenlane and Remuera. The catch: they leave Papakura just three minutes after the all-stops trains, meaning they’ll be crawling along behind the train in front all through the inner Southern Line, before arriving at Newmarket still three minutes behind the all-stopping service. So this is a limited-stop service that saves nobody any time.All of this also means that if you’re travelling from anywhere south of Otāhuhu and want to go to one of those inner-southern line stations, there are effectively only four trains an hour. At peak.
In practice, with a 15-minute gap between services at the stations between Papakura and Puhinui due to the green express service, those all-stopping trains are going to be absolutely jammed – while the train following three minutes behind will probably be largely empty.
This is a classic sign that the timetable has been designed to achieve some modelled average frequency (e.g. we just need to run X number of trains to meet a set level of capacity), and that no thought has been put into meeting the needs of the actual passengers who will be using it.
Travel times
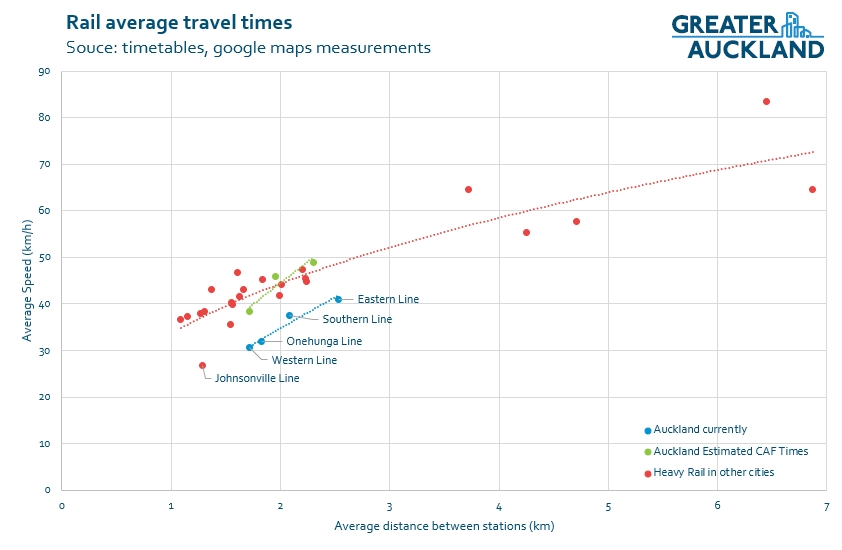
One of the reasons I’ve been looking forward to seeing this timetable was to see if we’ll be getting any notable travel time improvements. As I’ve highlighted many times in the past, Auckland’s trains are much slower than most comparable lines in other cities, and slower than the speeds cited by the train-maker CAF during the procurement process.
 There are a variety of reasons for this slowness, including very poor operational processes around operating the doors. But we’ve also had additional fat built into the timetable, to cope with the multitude of Temporary Speed Restrictions (TSRs) that the six-year long massively disruptive rail works were meant to resolve. As reported in 2024:
KiwiRail has promised to cut delays on Auckland trains, amid growing concerns about the readiness of the city’s failing rail network for the opening of the $5.5 billion City Rail Link in 2026.
KiwiRail says it will cut delays from five-and-a-half minutes to a maximum 45-second delay on the western line, 30 seconds on the southern line, and 1 minute 20 seconds on the eastern line.
So, how do travel times compare to today, in the post-CRL Day One timetable that AT just tested?
(Note: as the CRL will fundamentally change the shape of the network, for the Western and Southern line examples below, I’m comparing travel time to inner-line stations just before the new CRL stations.)
Western Line
We do see a small improvement over today’s timetable, but at 34 minutes from Swanson to Kingsland it’s the same sort of travel time we’ve seen before, so no real change. Remember the original EMU requirement was for this part of the journey to take just over 27 minutes.
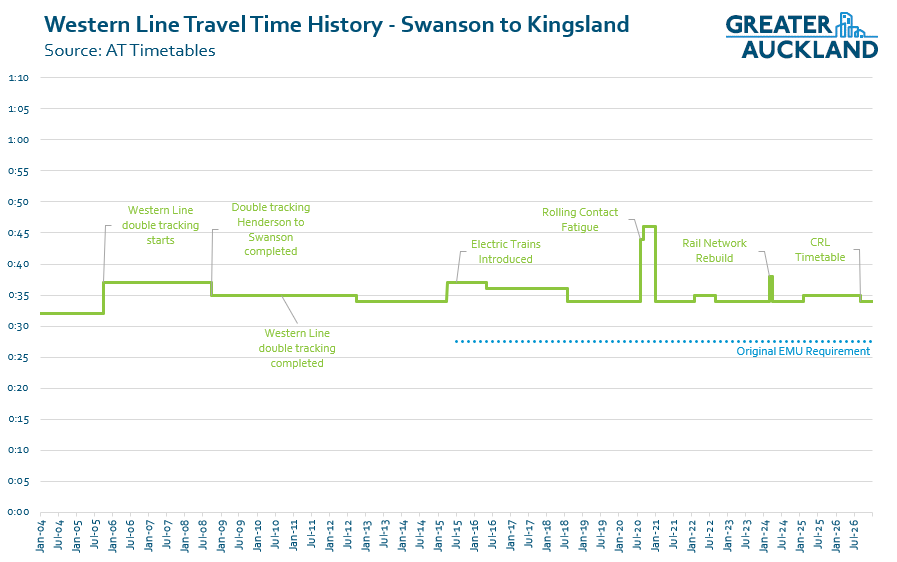
Of course, thanks to the CRL, the Western Line benefits massively from Kingsland on in towards the city. As such, the total travel time from Swanson to Waitematā drops from 56 minutes today to 45 minutes. If we could achieve those original EMU requirements for the outer part of the Western Line, we could get that down to less than 40 minutes. A worthy goal.
Eastern Line
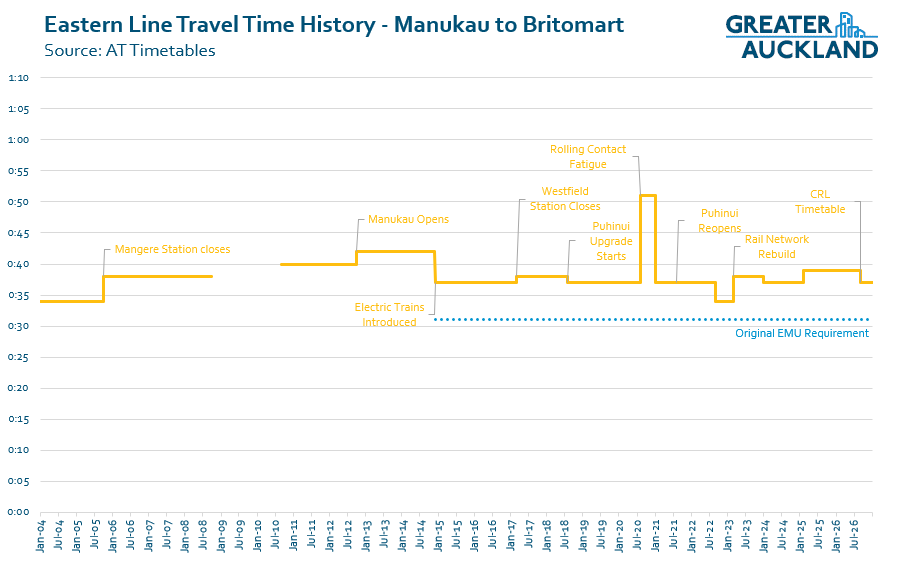
This is the easiest comparison, as the shape of the trip doesn’t change. The journey time does improve slightly, by around 2 minutes, to 37 minutes total. This is similar to what we’ve seen before, but still above the 31 minutes our trains should be capable of for this journey.
Southern Line
A trip from Papakura to Newmarket sees the biggest improvement from the current timetable – but again, as you can clearly see from the chart below, it’s just getting back to earlier travel times at 41 minutes. The original requirement was that this journey could be achieved in around 33 minutes.
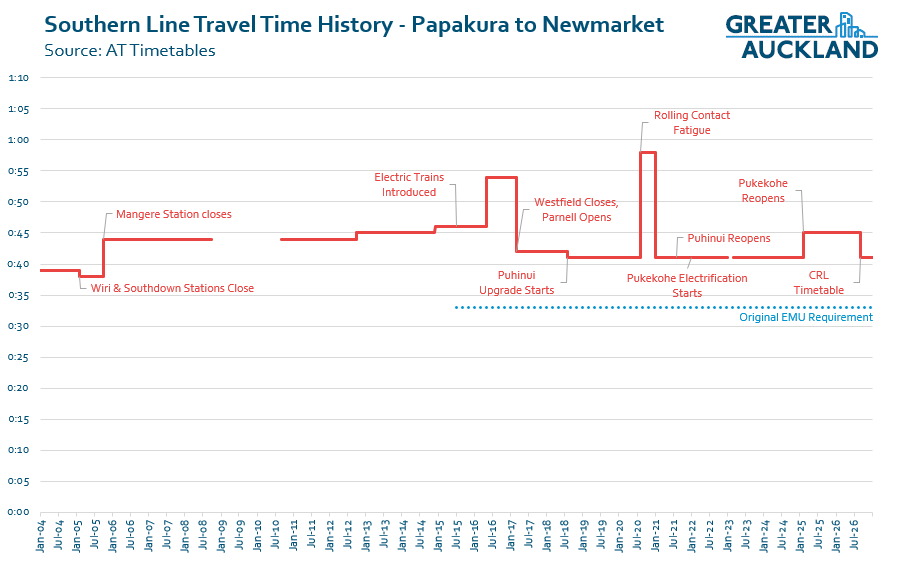
Trains from south of Otāhuhu heading north will travel through Newmarket then up past Grafton before heading down the CRL. Trips from Papakura to Waitematā are expected to take 54 minutes in total – the same as today.
However, as mentioned above, there would be two express services per hour (shown in green earlier). For a trip to Waitematā, these services will be around 9 minutes faster than the all-stopping trains, but a trip to Te Waihorotiu is only about 4 minutes faster.
One final observation
This relates to the Onehunga line. It’s been discussed before that this line will travel to Henderson off-peak, but be cut short during the peak. Nominally these trains are scheduled to terminate at Grafton. There also happen to be 2TPH that start from Sylvia Park and travel through to Grafton where they terminate. While these are being treated as separate services, the same train that departs from Onehunga will eventually run though to Sylvia Park – meaning, at least for the tested timetable, Onehunga Line passengers to the city could stay on the train which will then travel through the CRL.
Conclusion
Overall, this timetable as tested in January looks to be all about being able to claim improvements, while not actually delivering them for many users. Hopefully future iterations will result in something far more useful and passenger-friendly.
Share this