

Westpac is raising most of its fixed home loan rates, effective Wednesday, March 18.
Given the recent rise in wholesale rates, they are likely to be the first of a series of increases from most banks.
Westpac’s increases range from +10 basis points (bps) for its one year rate, to +30 bps for its two, three, and five year fixed rates.
At the same time, it is increasing its term deposit rate offers for terms of one to five years, some also by as much as +30 bps.
Readers who check the swap rate graphs at the foot of this story will find clear evidence of the rising background cost of money. These are costs no bank will be able to ignore.
But while these costs rise, it does open up the opportunity for banks to pay retail depositors more (otherwise they will have to pay the wholesale rates).
Using Westpac’s retail rates as a foil,
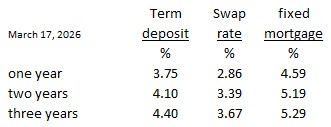
Westpac’s new one year term deposit rate of 3.75% is the highest rate of any main bank for that term, about +20 bps higher than those main rivals. In fact the highest of any bank.
To compare mortgage rate offers in a way that includes the application and account fees costs (or break fee costs if you need to do that), and applying the impact of a cashback/legal fee reimbursement, or other incentive, you can use our home loan comparison calculator. You can find it here. Or, for convenience, we have added it to the bottom of this article.
Negotiate. How flexible banks may be will depend on the strength of your financials.
One other useful way to make sense of the changed home loan rates is to use our full-function mortgage calculator which is here.
And if you already have a fixed term mortgage that is not up for renewal at this time, our break fee calculator may help you assess your options. Break fees will be minimal in a rising market. But they become important in a falling market, like now.
Here is the snapshot of the lowest advertised fixed-term mortgage rates on offer from the key retail banks at the moment.
Select chart tabs
2 years %
6 months %
1 year %
18 months %
3 years %
4 years %
5 years %
Select chart tabs
1 year %
2 years %
3 years %
4 years %
5 years %
7 years %
10 years %