
The short version up front is that Intel’s new 250K Plus CPU finally brings Intel back to parity with its 14th Gen, undoing a lot of the regression we saw with the 200 series launch. In some situations, it even bests the 285K (read our review) by a couple FPS, although enabling 200S Boost can sometimes equalize them again.

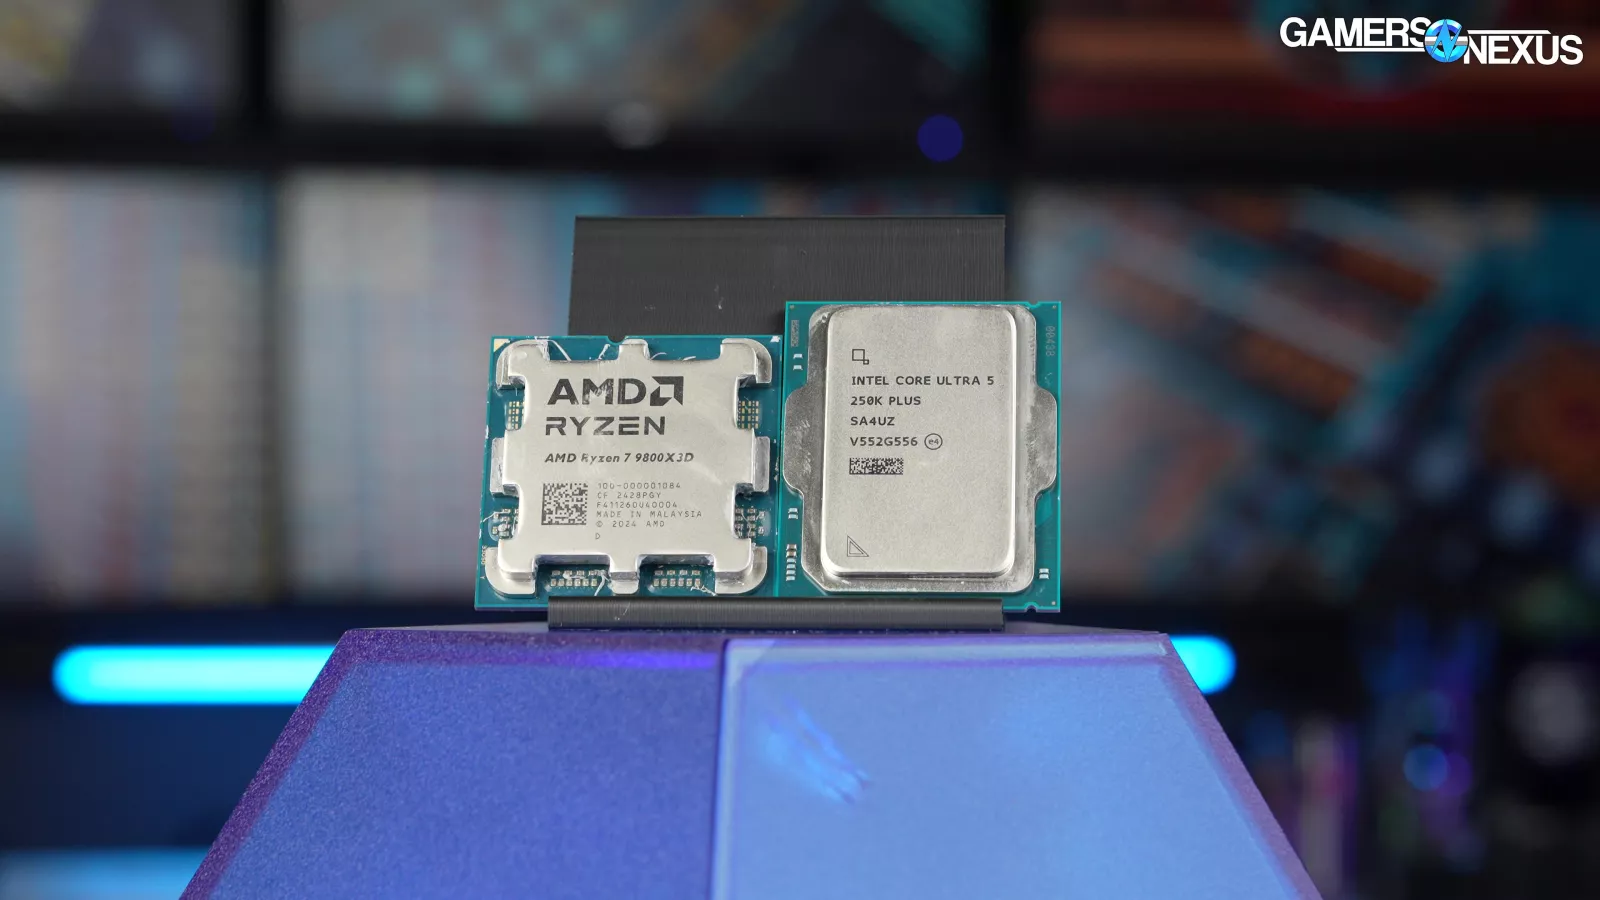
Most of the time, we see the 250K Plus around the level of the 14600K and 285K. It trails the 9800X3D (read our review) predictably and significantly, but it also costs a lot less and so isn’t a direct comparison.

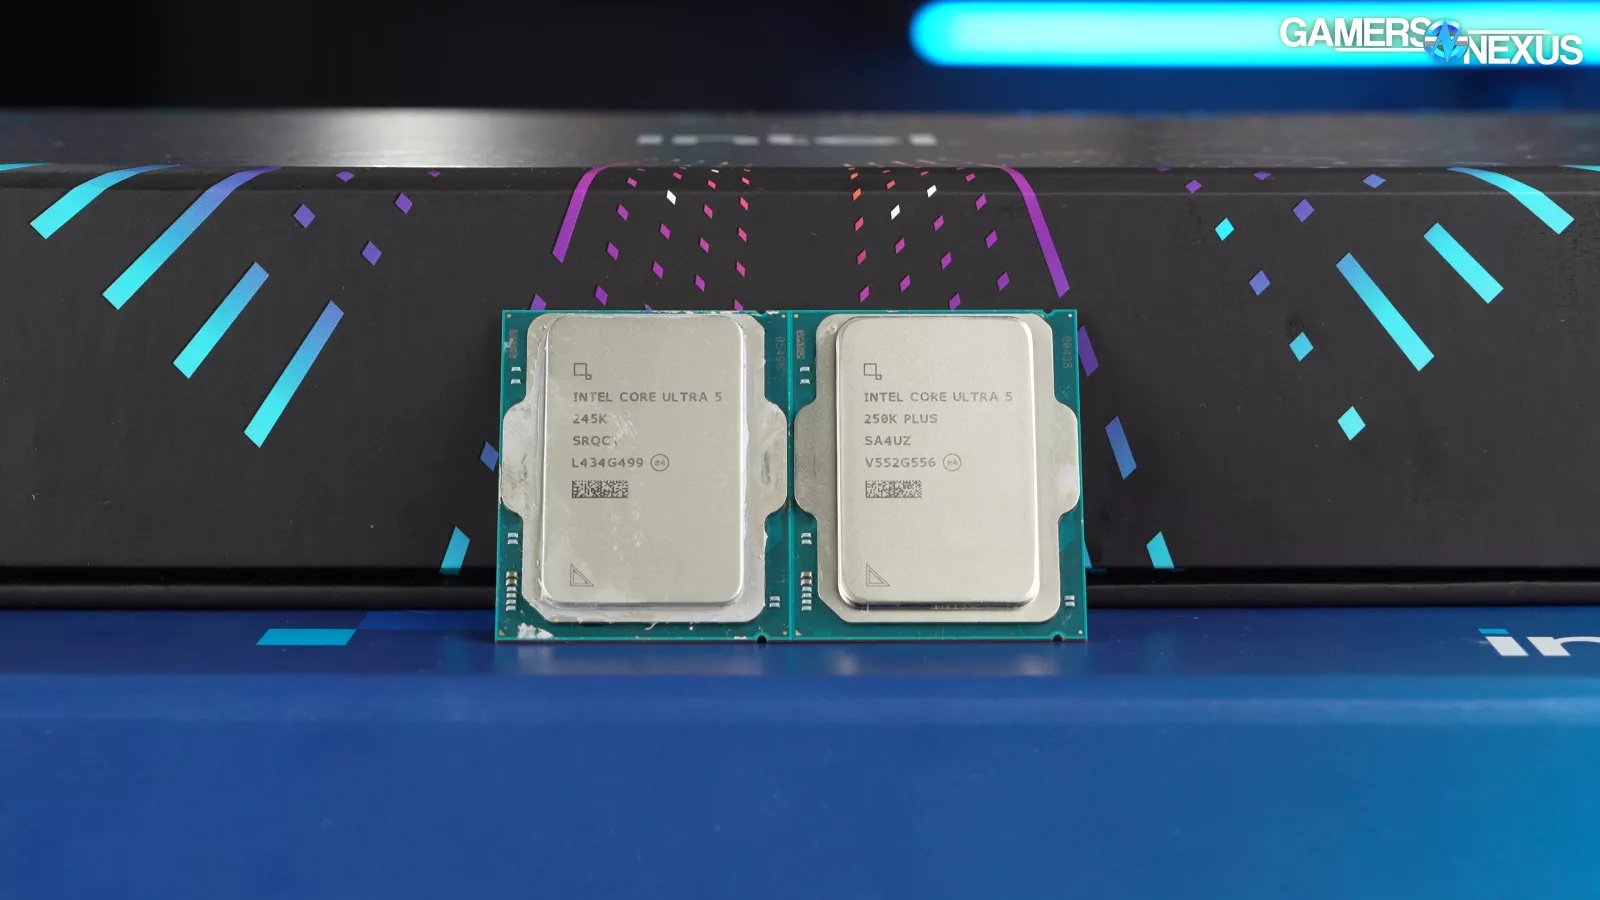
We’re seeing large gains over the 9600X, like 24% when we tested The Outer Worlds 2 at 1080p, and significantly better performance than Intel’s own preceding 245K (read our review) in basically every situation.
That’s largely due to going with more cores and cache for the 250K Plus rather than the 245K as opposed to a pure clock bump.
In non-gaming workloads, Intel maintains an overall good position against AMD’s price equivalent options, like the 9600X, as long as you’re not factoring-in Intel’s poor history of motherboard longevity.
We’re keeping this one really simple today. It’s mostly just the charts, because the past week was exhausting with the push on DLSS5, Crimson Desert, Discord Alternatives, and our in-depth Noctua case review with fan testing benchmarks.
In short, we’d like to go home and get some sleep sometime this week.
Overview
The new CPUs launch in a couple days, with reviews going up early. Behind-the-scenes, Intel was disorganized with its reviews handling and got us information late and software late, but end users don’t experience that, so we’ll leave it out of the conclusions, but it may be an indicator as to the impact of layoffs.
We’ll start with a refresher on the CPU side of the market.
We already know RAM is a wreck, so focusing on the CPUs: The 250KP is a $200 part. Currently, the 245K is also $200. The 14600K is largely gone, other than third-party ripoffs or used listings (which are fine, but variable in price). AMD’s 9600X is currently about $190, making it a head-to-head competitor by price. The 7700X (watch our review) is around $250, with the 7800X3D at around $350-$380 now. The 7800X3D is definitely worth considering at that price. But maybe more as an alternative to the similarly-priced 270KP that we’ll review next. It’s in a different price class from the 250KP.
Just for reference, the 285K is currently $530 after a discount code, with the 9800X3D at $450 after a similar discount code.
Specs
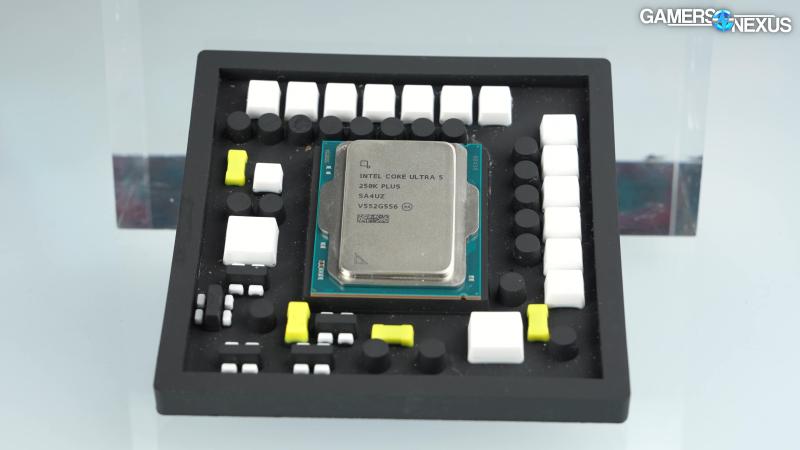
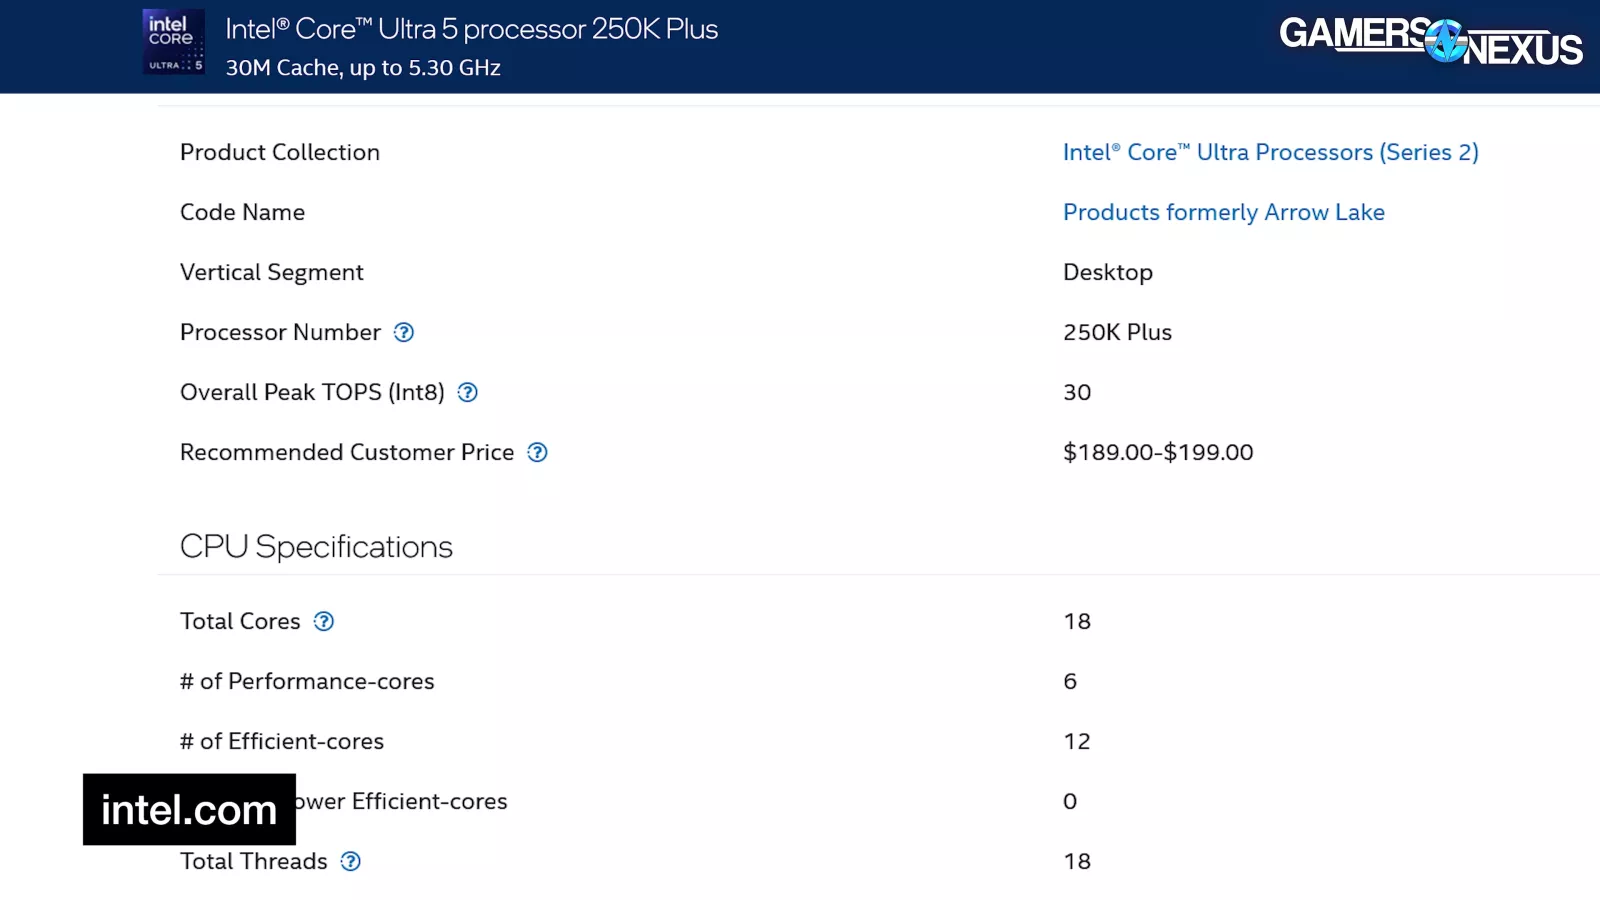
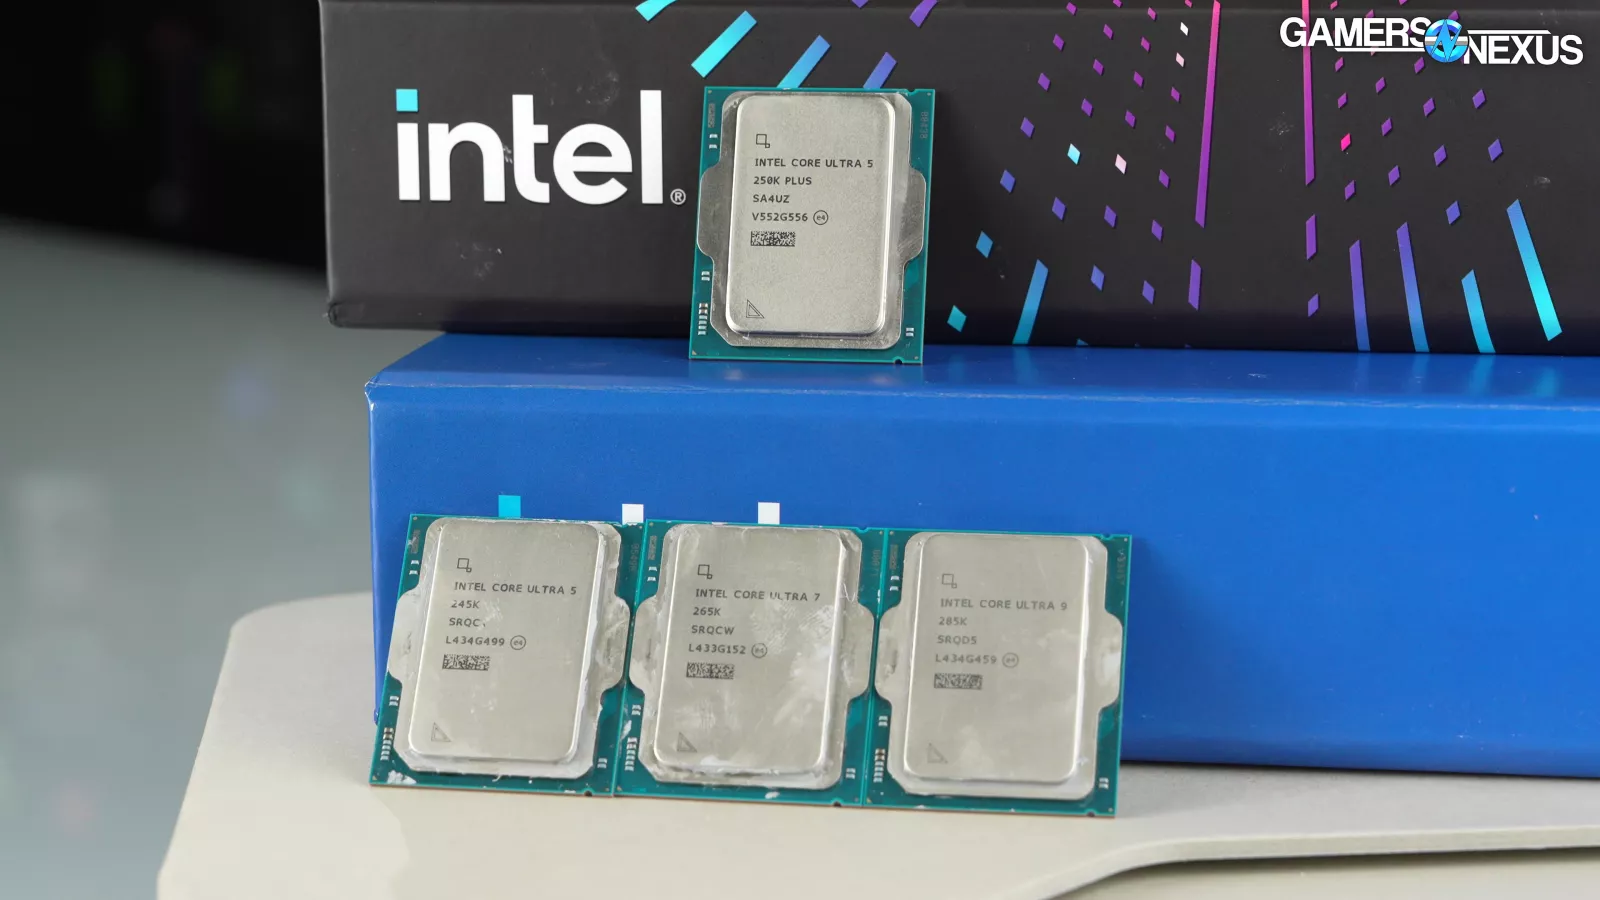
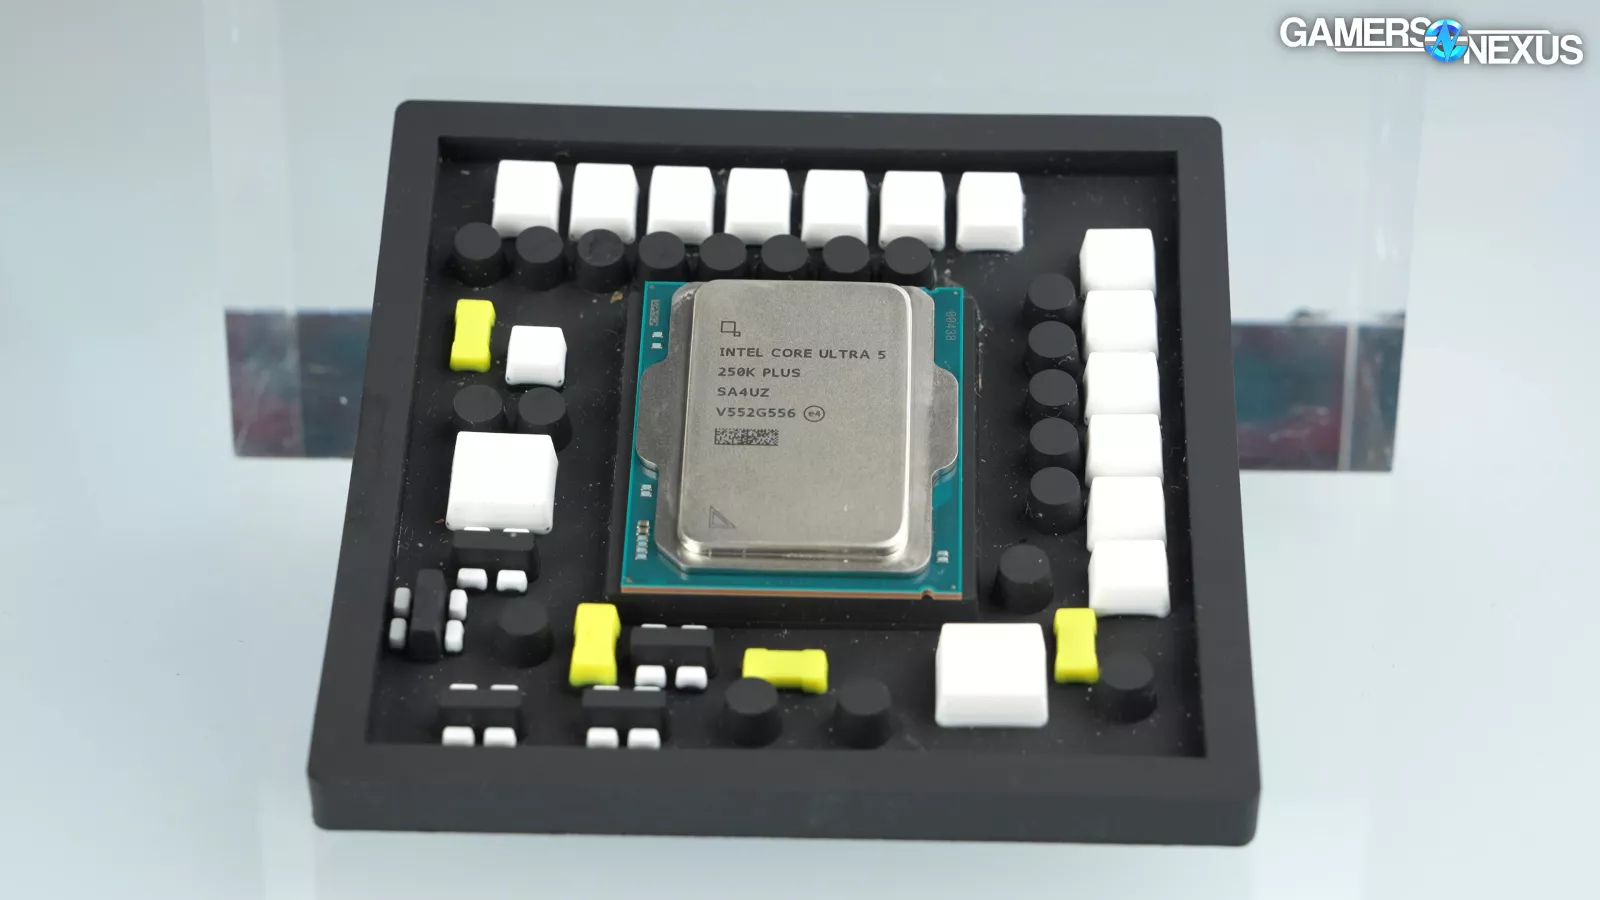
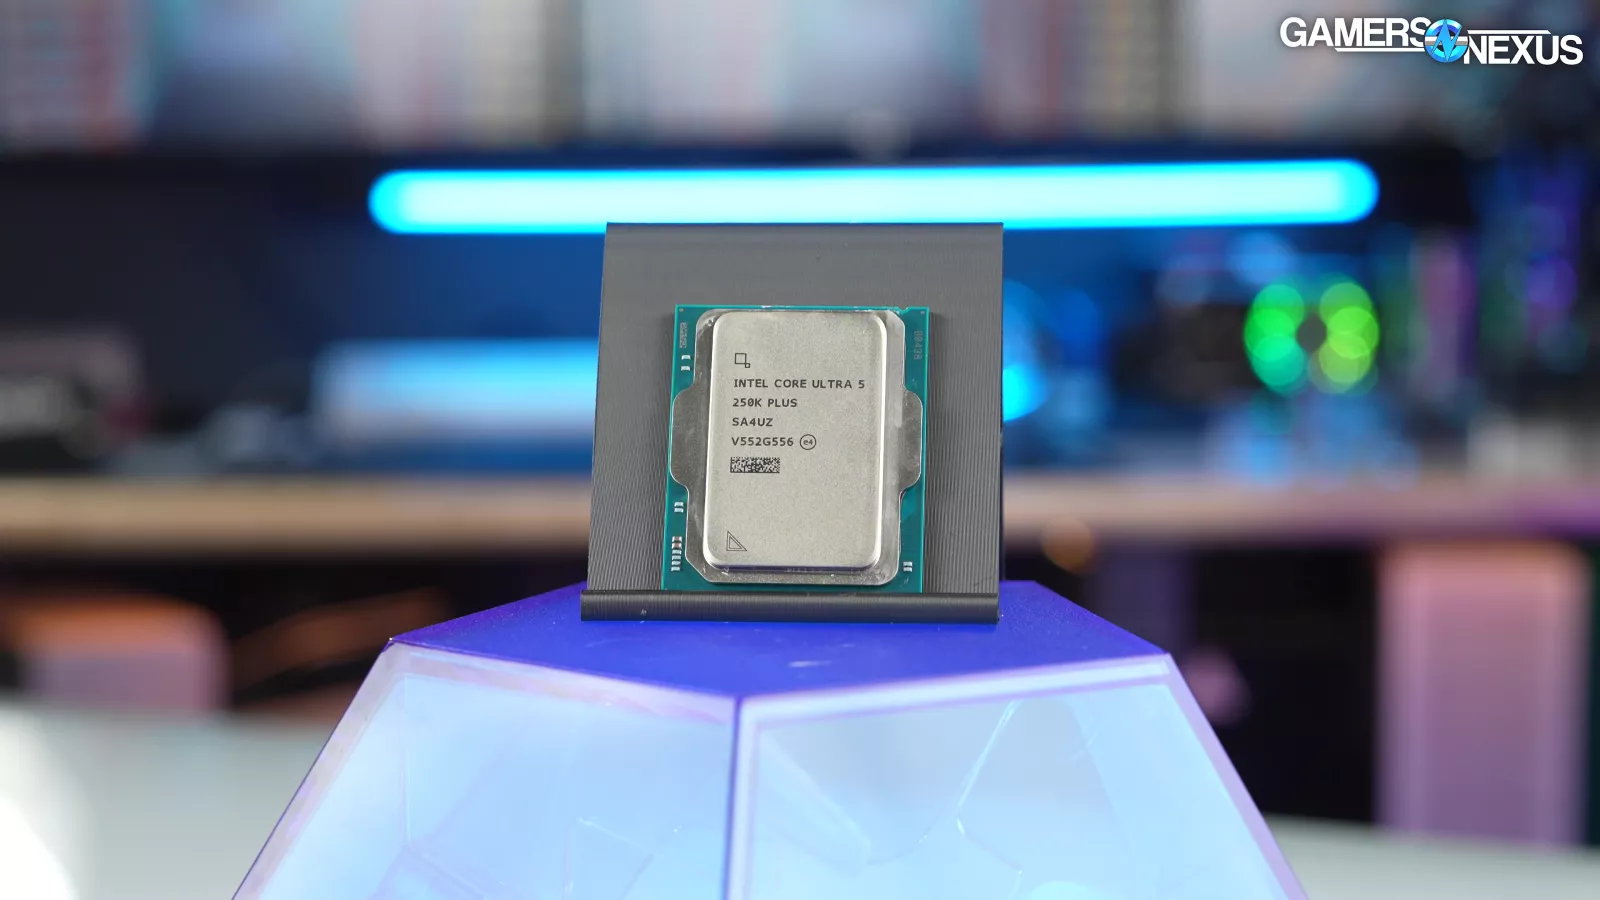
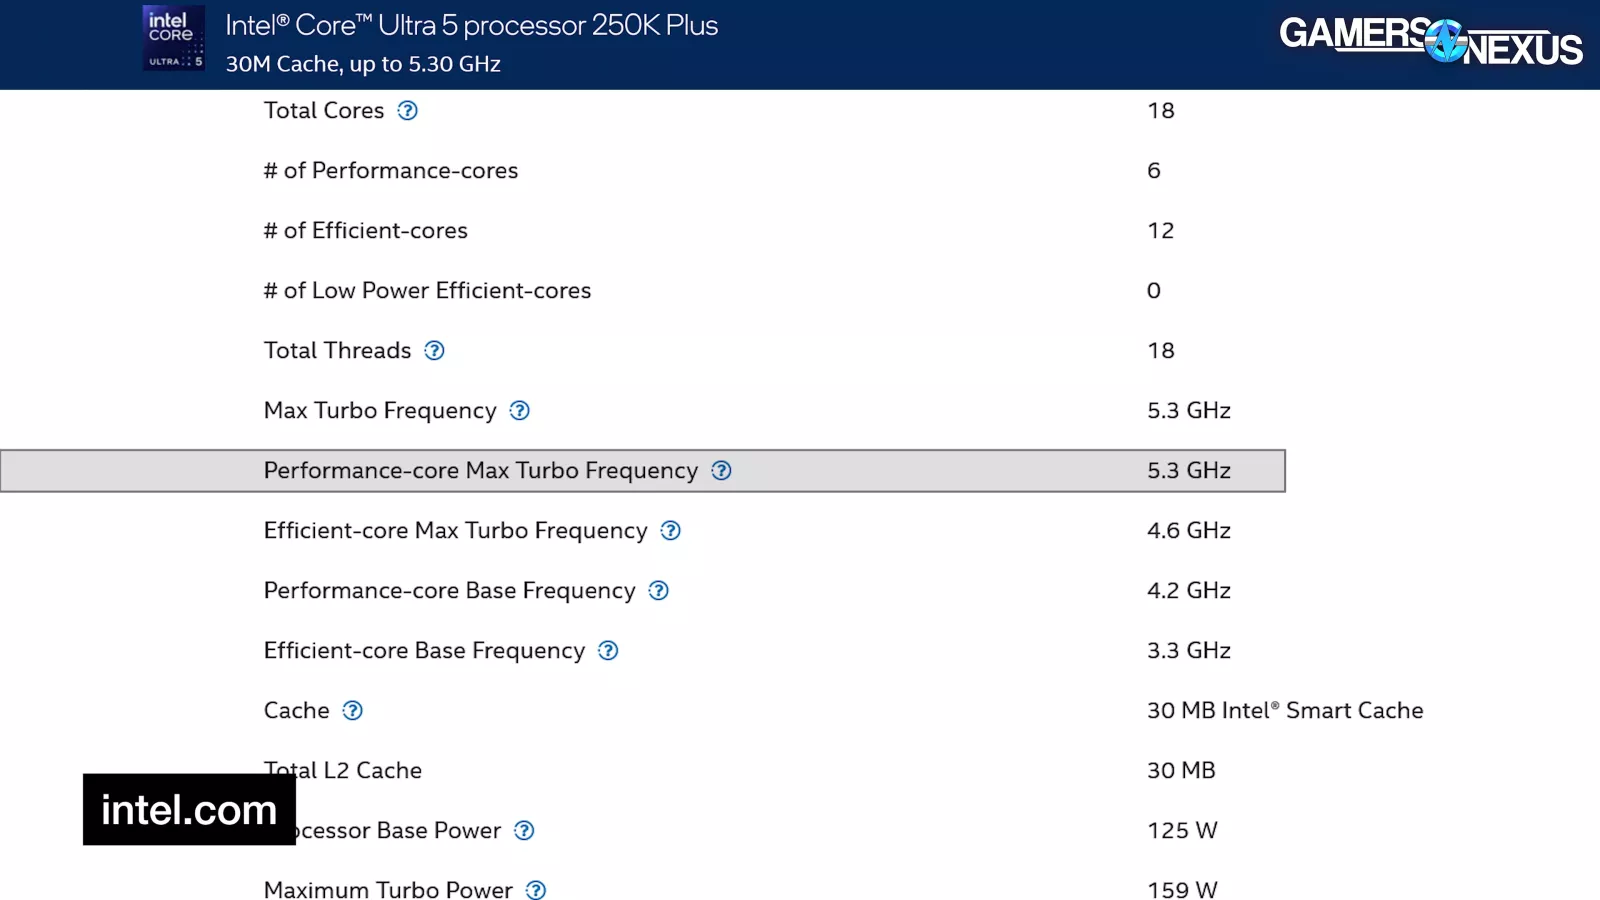
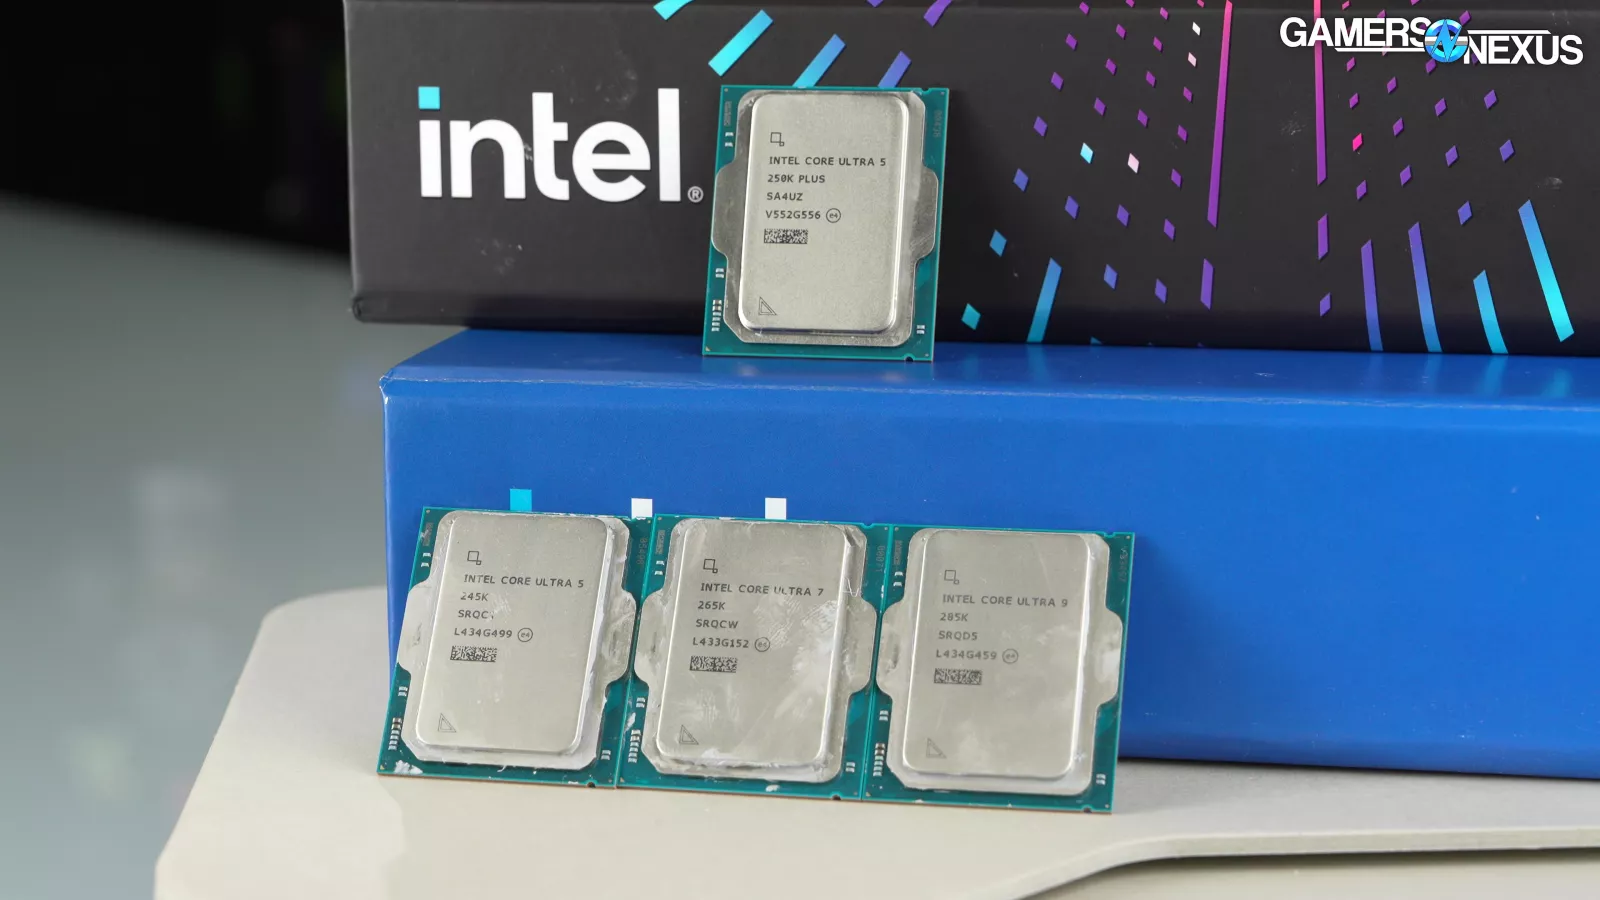
Intel’s new 250K Plus CPU is in the former i5 lineup and should be $190 to $200. The 250K Plus is running a 6 P-Core, 12 E-Core configuration for an 18C/18T spec at a 5.3 GHz max advertised boost. TDP is claimed at 159W for the 250K Plus, although TDP and actual power don’t match exactly. Intel is also now claiming native support for up to DDR5-7200 on the 250KP (up from 6400 previously), so… great, higher-end memory is supported.

Now you can max-out your $200 CPU with your $2,400 RAM in your Intel motherboard that you can only use once.
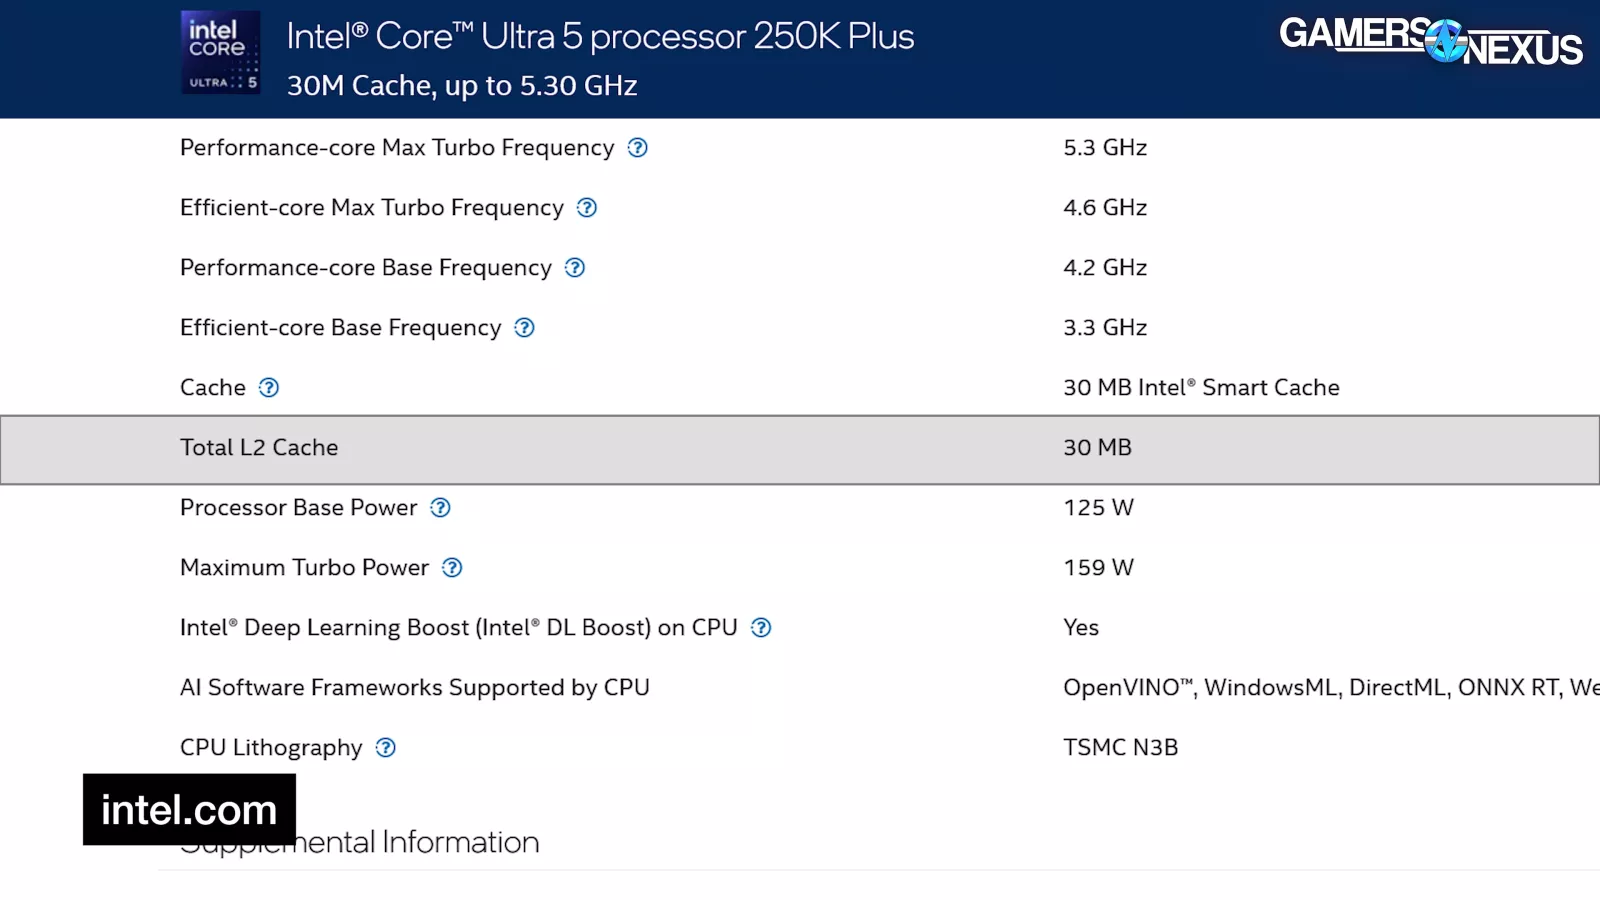
Notably, the extra cores also bring with them an L2 cache increase to 30 MB.
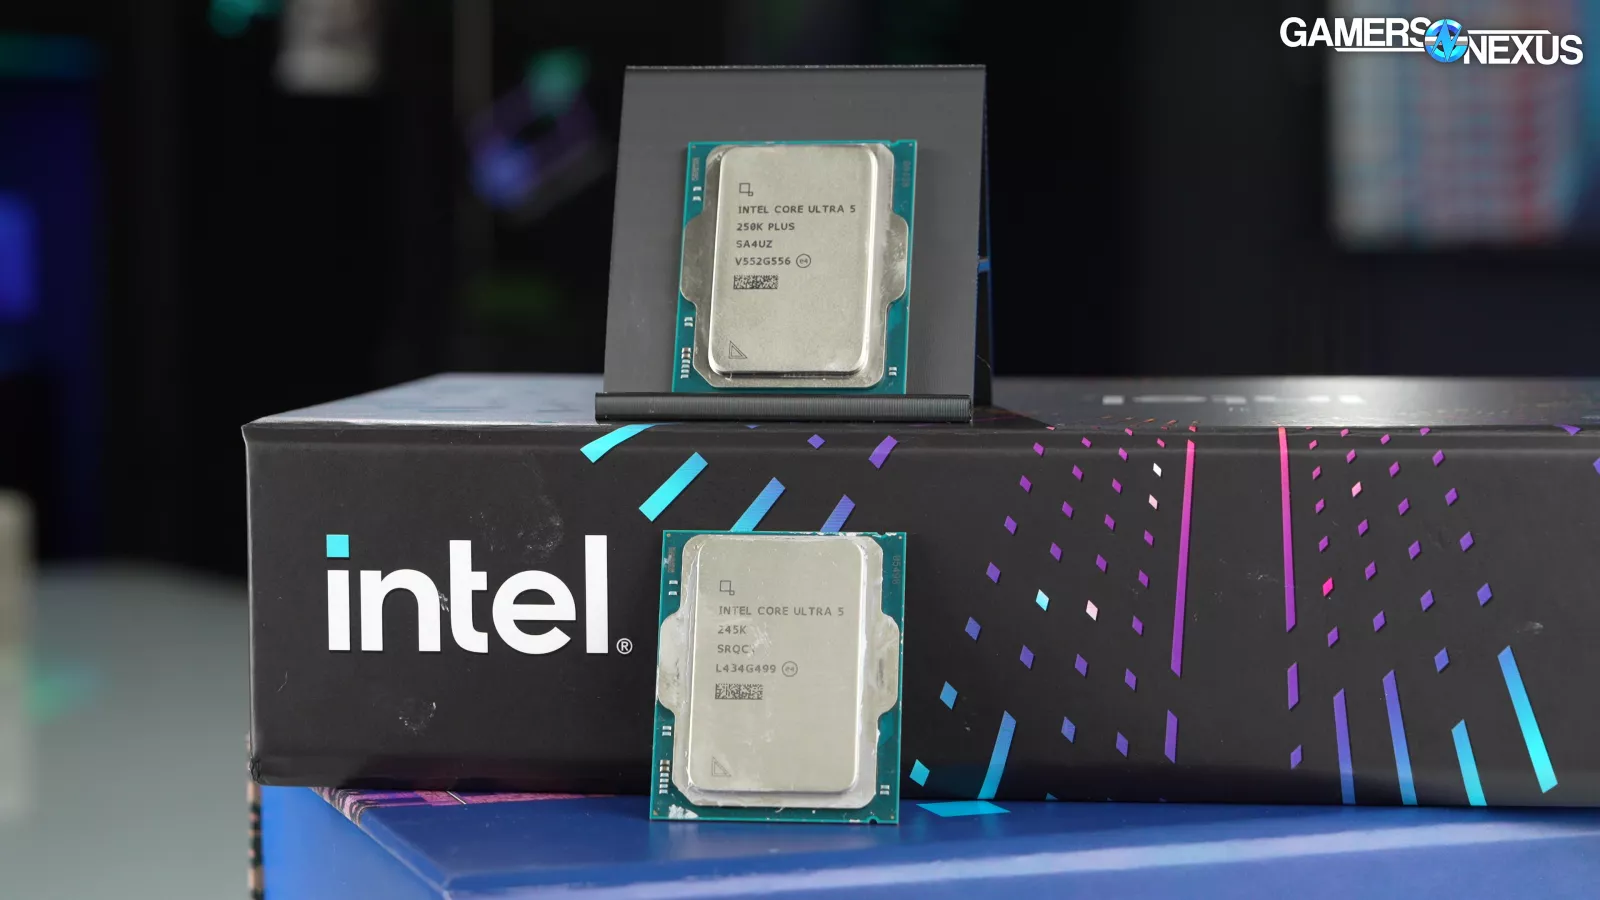
For comparison, Intel’s 245K runs a 6 P-Core, 8 E-Core configuration for a 14C/14T spec at 5.2 GHz. That’s 100 MHz reduced for maximum advertised boost and 4 fewer E-cores than the new CPU.
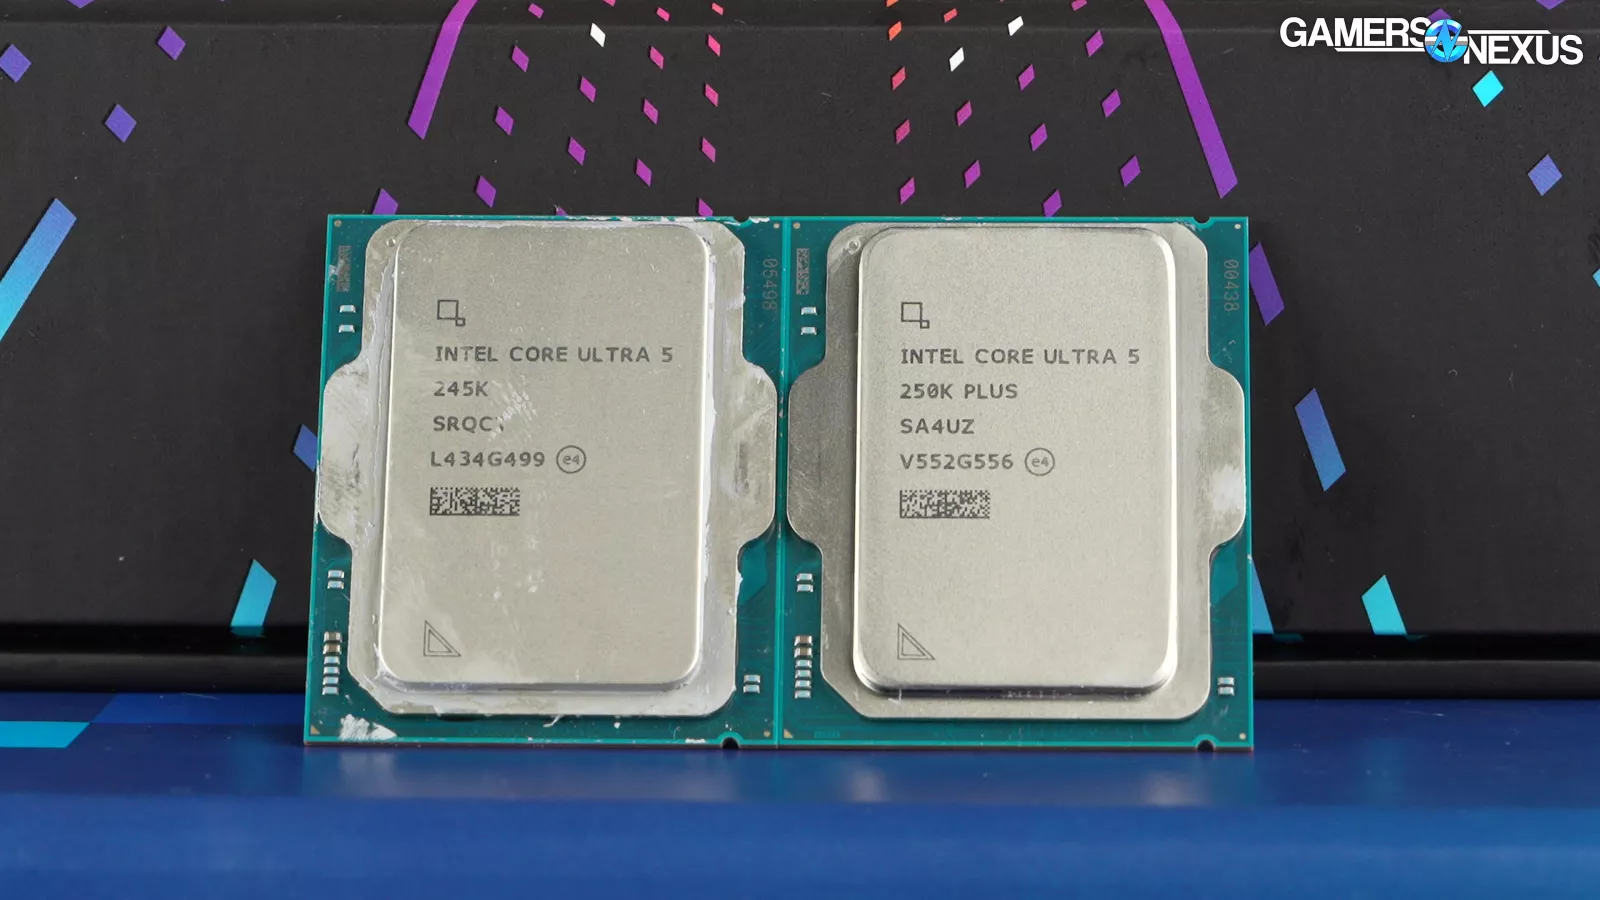
This is a reconfiguration of the spec itself, so the 250K Plus is not an exact replacement for the 245K. The core count change means it’s not only a frequency bump. The 245K is on 26 MB of L2. While the 250KP is no X3D, it should still have an outsized impact on performance against the older 245K with its larger cache.
For reference, the Intel 285K is in the former i9 lineup, now called Ultra 9 200S, because that makes more sense somehow, and remains the highest core count spec of this group. The 285K has 8 P-Cores, 16 E-Cores, and 24 total cores and threads. Max advertised boost is 5.7 GHz, making it the highest of the group, with E-core boost still at 4.6 GHz. Keep in mind that actualized boost will be lower as more threads are engaged with work.
Setup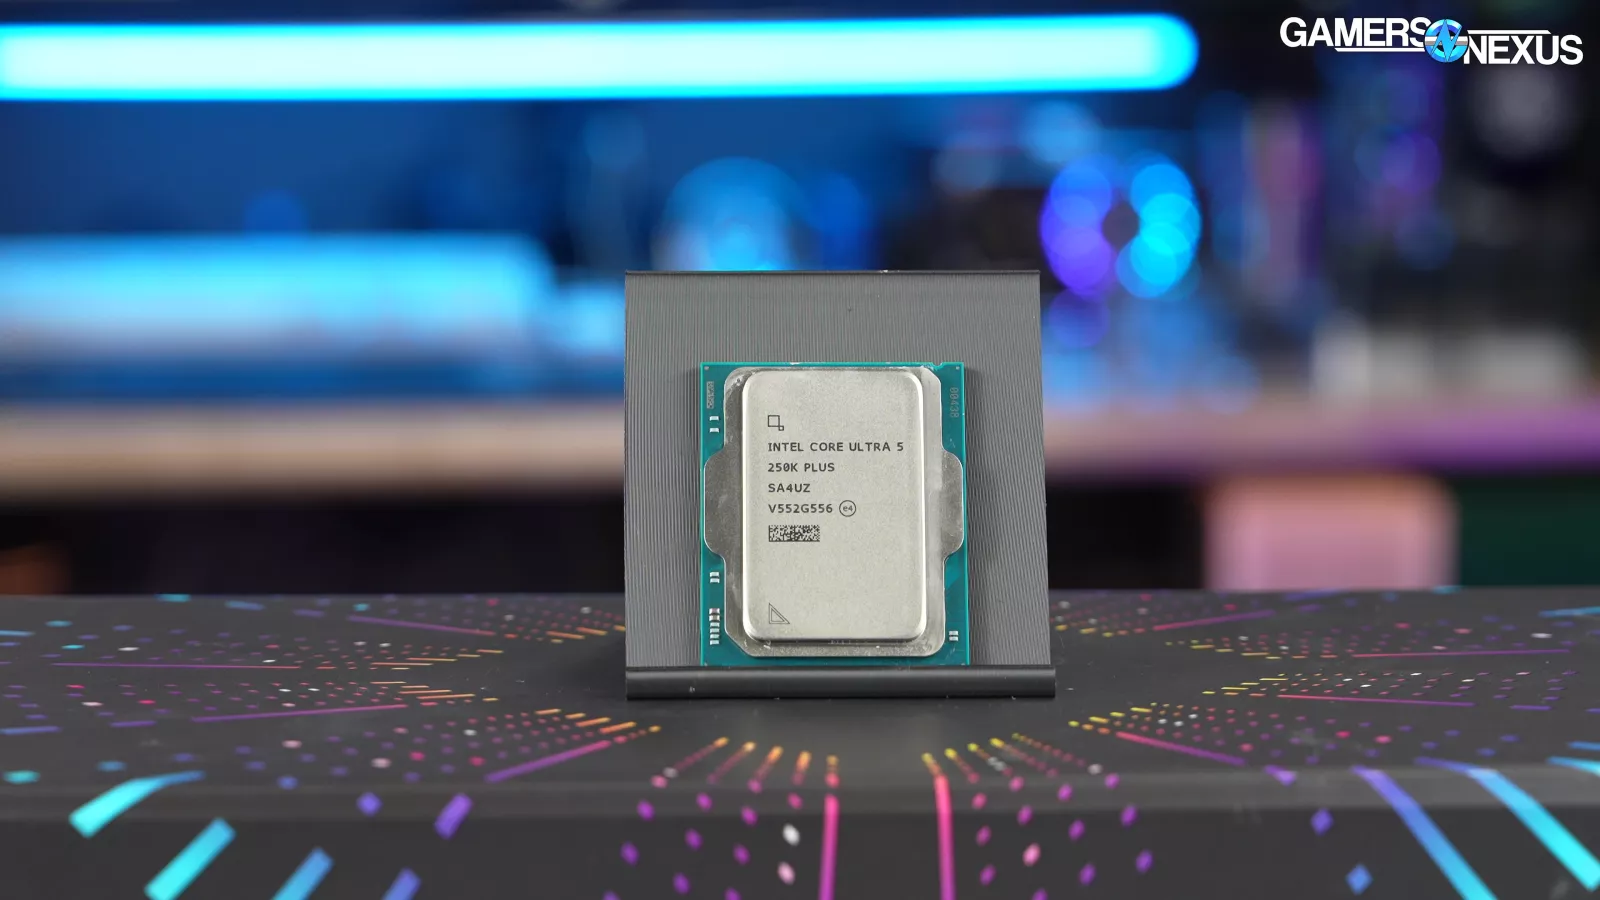
These CPUs will require some additional setup. Intel’s setup documentation reminded us of AMD’s old 30-page core parking setup guide from its first generation of parked CPUs.
Intel’s document reads:
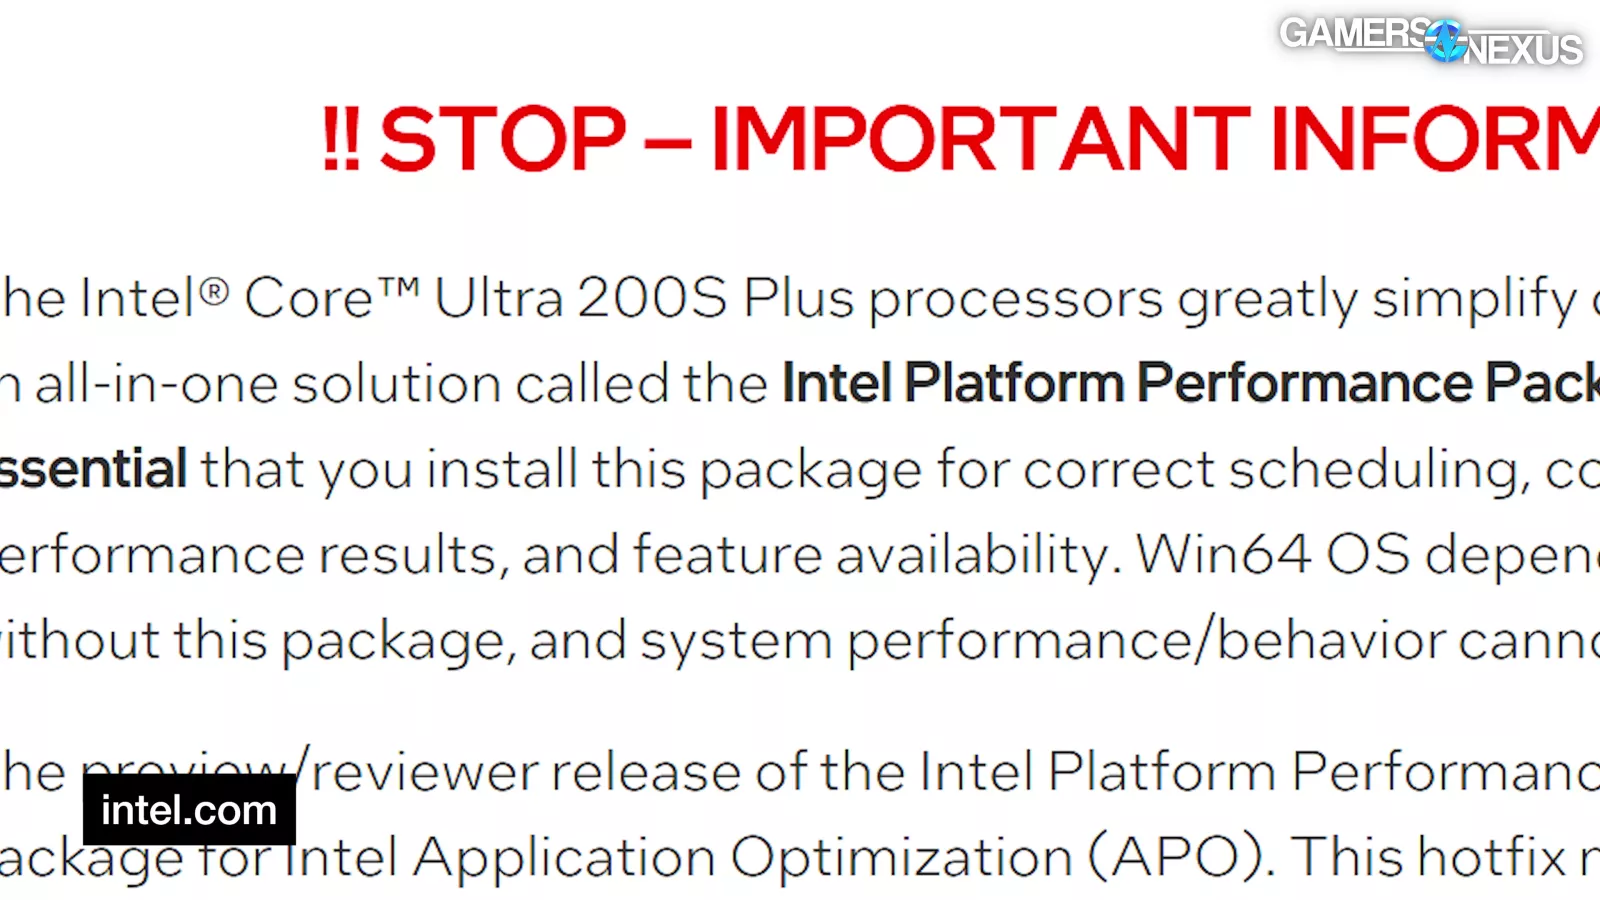
“!! STOP – IMPORTANT INFORMATION!!”
Before then going on to say that the Intel Platform Performance Package, or the PP Package, for short, or the PPP for even shorter, must be installed in order to correctly activate “scheduling, core parking, idle power, performance results, and feature availability.” Intel warns, in both bold and underline, that a Windows system won’t work right without this. Joke’s on them, because Windows never works right.
The setup guide explains that reviewers received an impotent version of Intel’s PP Package, noting that it requires a second EXE. In other words, after installing the CPU, the management engine, and the chipset drivers, we also had to install a separate EXE — and you will too — for the Platform Performance Package software. This is not automatically pulled by Windows; at least, not right now. In our case, we also had to install a second separate EXE for the Driver Tuning patch hotfix. Intel claims that the public version will only require the first EXE, not the patch, but the fact that Intel made an active decision to ship bugs to reviewers is problematic for different reasons.
We installed both the PP Package and the hotfix and followed the setup guide; however, we have to assume that the product they sent us is the one that’ll ship. For that reason, starting with bugs is a bad start, and requiring the user to install broken software and then separately install a hotfix is a level of disorganization previously matched only by the Radeon team.
We don’t review promises. It’s good that Intel says this will be fixed for launch, but we’re reviewing this before launch and it’s not working right, so that’s what we’re reviewing. We don’t review promises.
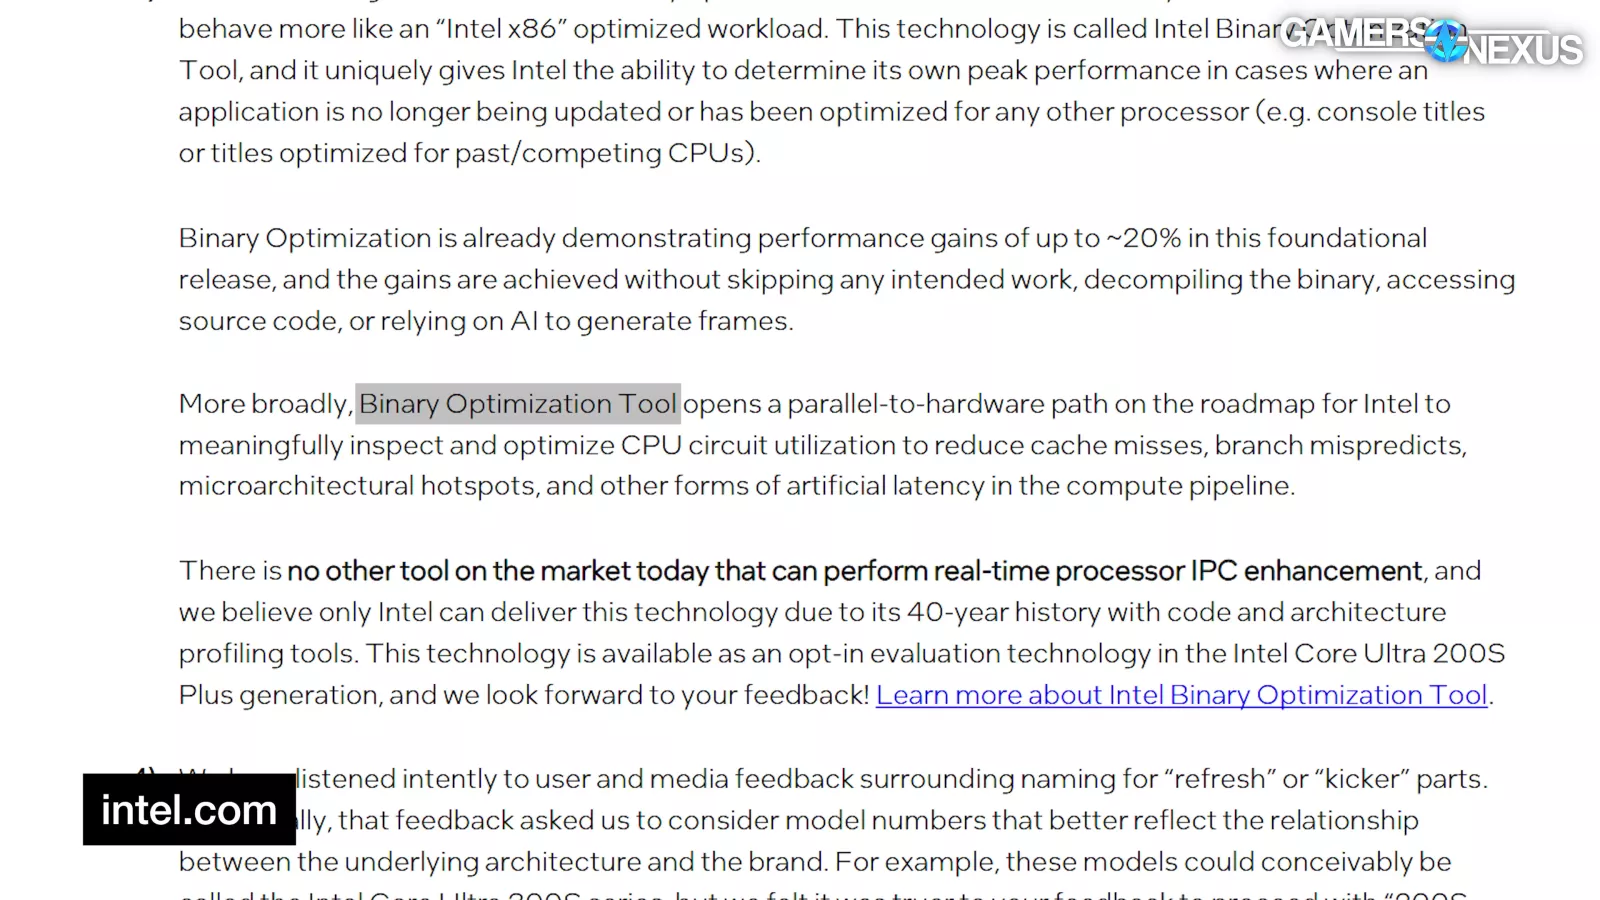
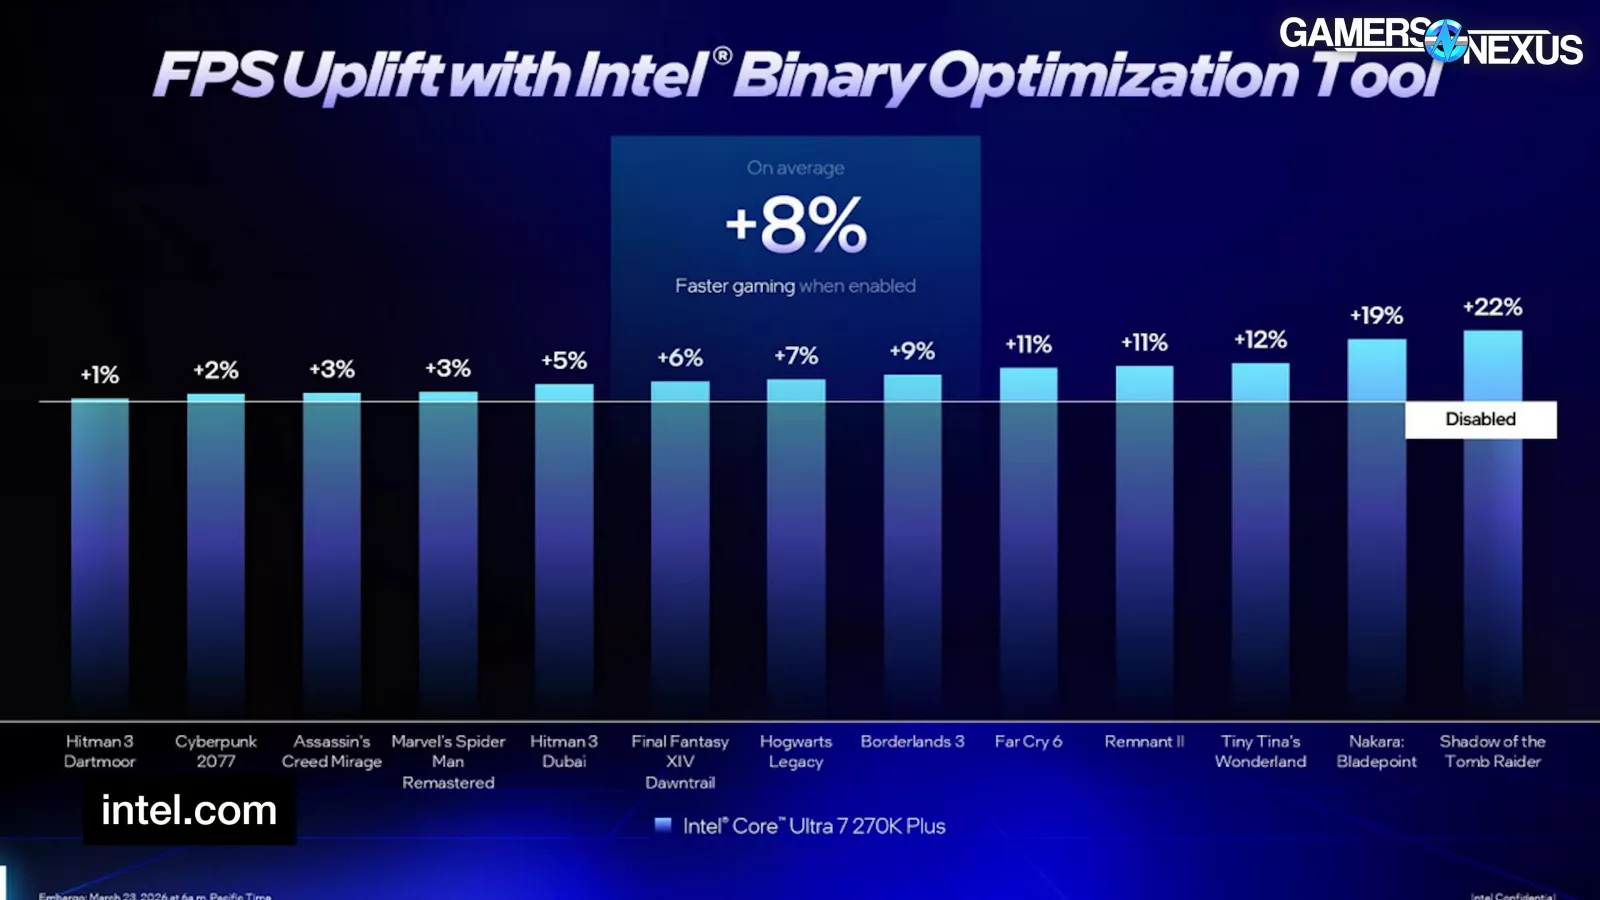
Intel also talked a lot of game about its Binary Optimization Tool, which it says “opens a parallel-to-hardware path […] for Intel to inspect and optimize CPU circuit utilization to reduce cache misses, branch mispredicts, microarchitectural hotspots, and other forms of artificial latency in the compute pipeline.”
Unfortunately, in a throwback to Intel’s busted APO launch, this requires yet more software that users have to know to install, and also similarly, it doesn’t work on much right now.

Intel says that the Binary Optimization Tool currently only works in 12 applications. It’s also opt in, meaning it’s not intended to be something you use by default. So, we’re not testing it by default. The 12 applications it supports include:
Assassin’s Creed MirageBorderlands 3 (2019)Cyberpunk 2077Far Cry 6 (2021)Final Fantasy 14 DawntrailHitman 3 (2021)Hogwarts LegacyMarvel’s Spider-Man RemasteredNaraka: BladepointRemnant IIShadow of the Tomb Raider (2018)Tiny Tina’s WonderlandAnd everyone’s favorite game: Geekbench
Many of these happen to be ancient reviewer testing titles. We’ve cycled most of them out by now, but Cyberpunk and Final Fantasy still overlap.
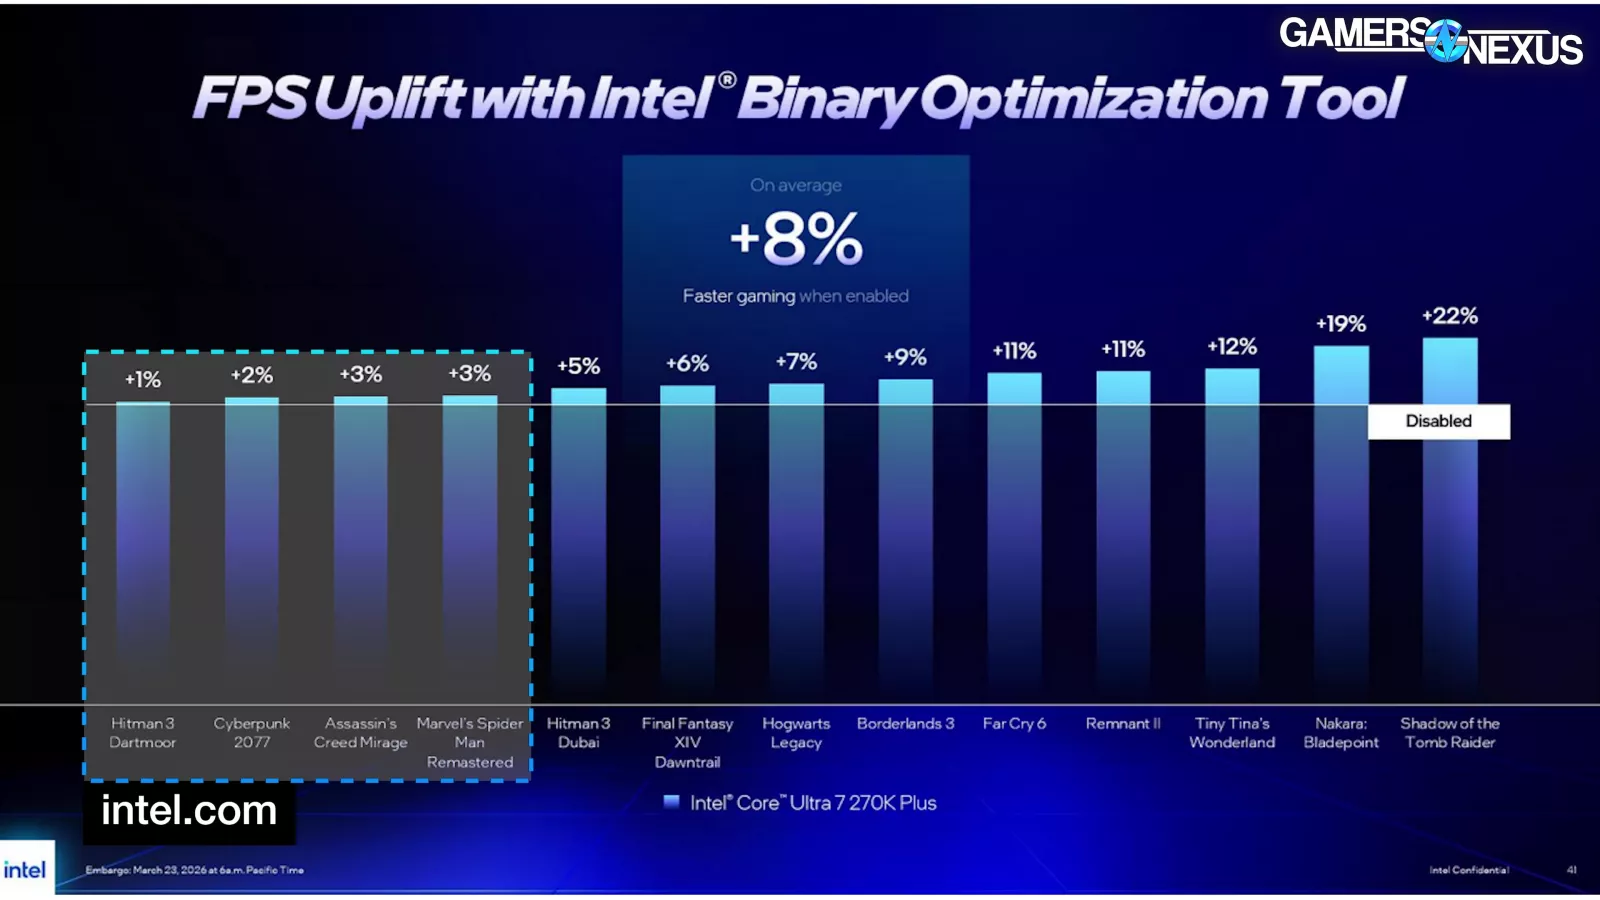
As for the claimed uplift, one-third of these games get under 3% improvement. Half of those are 1-2% different, which would be indistinguishable from test noise. Intel claims 6% in Final Fantasy and 2% in Cyberpunk. It is claiming 22% in Shadow of the Tomb Raider.
Let’s get into some initial data. We’ll start with frequency validation.
 Frequency ValidationFrequency Validation – All-Core
We perform these tests with logging to ensure the CPU is functioning as advertised and as expected from the manufacturer, which helps with validation for testing and with testing the accuracy of marketing claims.
Intel’s website claims a 5.3 GHz maximum P-core turbo boost for the CPU and 4.6 GHz maximum E-core boost.
 _ GamersNexus_all-4x_foolhardy_Remacri.png.w.webp)
This chart shows the frequency response across all cores in an all-core workload, averaging the P-cores and E-cores separately. The P-core average held about 5100 MHz during most of the test, with regular drops to about 5 GHz. This is below the 5.3 GHz maximum advertised; however, the maximum clocks are typically only in workloads on a limited thread count. The response here is normal given the all-core workload.
The E-core frequency hits and sustains 4.6 GHz.
Adding the 245K for reference, the predecessor averaged 5 GHz even for most of this test. The dip down in the center is a logging anomaly from the test process and can be ignored. In general, the new CPU is 100-200 MHz faster.
Finally, for reference, the 285K hit 5400 MHz during most of this test. Its max advertised boost is also higher for single-core workloads.
Frequency Validation – Single-Thread _ GamersNexus_all-4x_foolhardy_Remacri.png.webp.webp)
This chart shows the single-core frequency response. We’re plotting the maximum frequency per interval of all cores during a single-threaded workload with Cinebench.
In this test, the CPU technically does hit the 5300 MHz advertised boost sometimes, but for the bulk of the first part of the workload, it’s spending more time at 5100 MHz than 5300 MHz despite being single-threaded at this point. That’s not great. The back half of the workload flips that around, so it does eventually spend more time at 5300 MHz, but this at this point is uncommon behavior.
Adding the 245K to the chart, its maximum single thread frequency per interval was 5200 MHz, with regular intervals at 5000 MHz. The 250K Plus is faster by 100-300 MHz, but commonly 100 MHz.
The 285K’s max single thread frequency was 5700 MHz in this chart.
Game Benchmarks  Grab a GN15 Large Anti-Static Modmat to celebrate our 15th Anniversary and for a high-quality PC building work surface. The Modmat features useful PC building diagrams and is anti-static conductive. Purchases directly fund our work! (or consider a direct donation or a Patreon contribution!)Baldur’s Gate 3 – 1080p
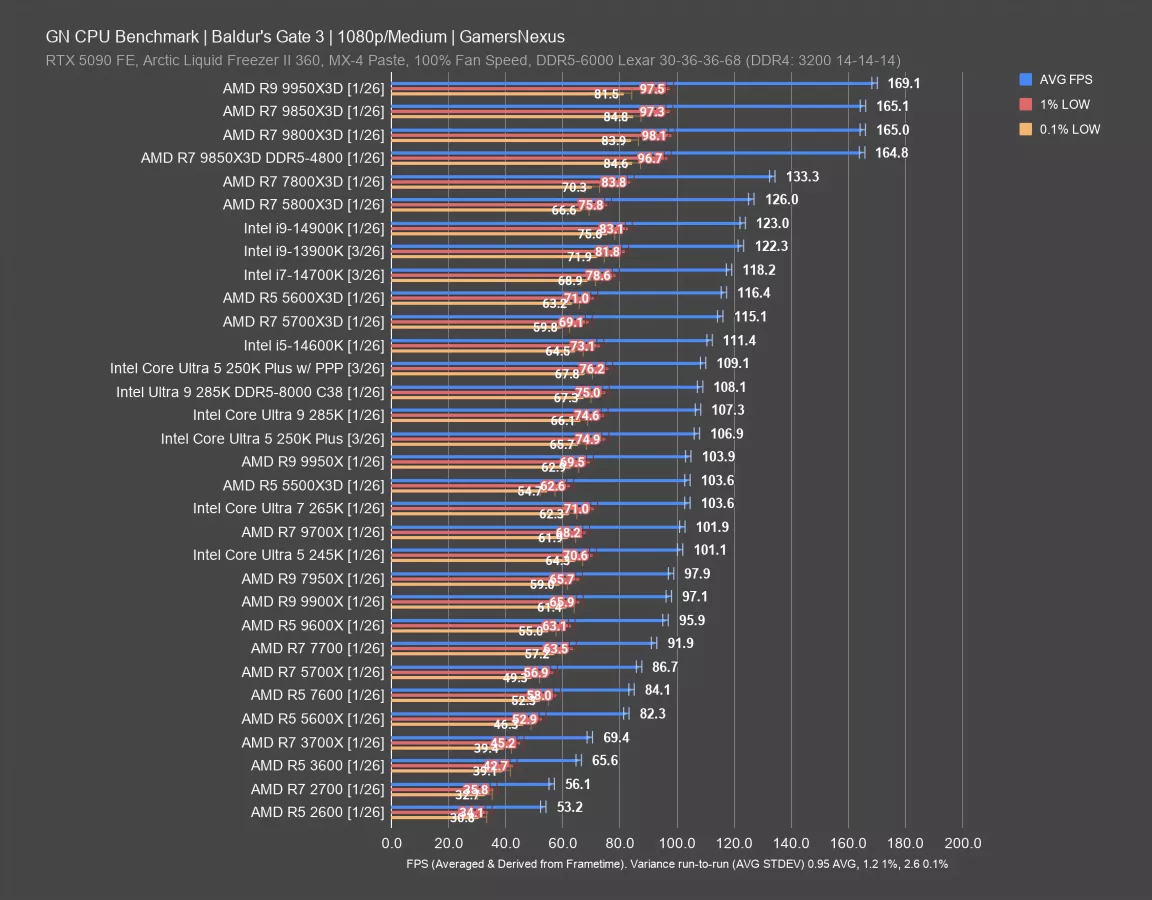
In Baldur’s Gate 3 at 1080p, the Ultra 5 250K Plus ran at 107 FPS AVG, with lows at 75 and 66 FPS. Running with Intel’s PP Package installed yielded a 109 FPS AVG, or a 2% improvement from installing Intel’s PP Package. That’s close enough that it may be variance, although standard deviation in this title is relatively low at 0.95 for AVG FPS. Still, +/- 1 FPS would wash this result, so there’s no real-world impact. Lows are also about the same. We’ll do comparisons against the better of the two.
109 FPS AVG with PPP puts Intel’s 250KP just ahead of the 285K-non-p with DDR5-8000 memory and ahead of the like-for-like 285K’s 107 FPS by 1.7%. Against the Ultra 5 245K’s 101 FPS AVG, we’re seeing an uplift of about 8%.
AMD’s older AM4 X3D CPUs are still outperforming the 250KP, including the 5700X3D and 5600X3D (which is expected to be higher, as its clock is higher) both up at 115-116 FPS AVG. The older i7-14700K (read our review) also leads the 250KP, as does the 14600K (watch our review), although only by 2%. The 250KP is definitely improved on the first revision of Intel’s 200 series. And at $200, sadly, it’s a rare sight these days. It’s also doing worse than the 14600K though, and AMD’s AM4 X3D lineup remains ahead. The 250KP is substantially cheaper than the 7800X3D and 9800X3D, of course, but is the same as the launch price for the 5600X3D and $50 cheaper than the original 5700X3D price — not that either can still be found.
Against other CPUs, Intel’s 250KP with its Power PP outperforms the 9600X’s 96 FPS AVG by about 14%.
Outer Worlds 2 – 1080p
Outer Worlds 2 is another of the new games we added to our test suite for 2026. In this benchmark and at 1080p first, the 250K Plus ran at 120 FPS AVG with PPP and 119 without it, so we’re seeing (at best) a 0.8% improvement. In reality, this is likely just margin of error and test variance, as that falls within those bounds.
At 120 FPS, the 250KP is about 2 FPS below the 13900K (watch our review) from 2022, which itself was about the same as the relatively new 285K. Adding faster memory to the 285K didn’t change much, as we’ve seen in other tests.
To establish the ceiling, the AMD 9850X3D (read our review) ran at 143 FPS AVG for a 19.6% advantage on the much cheaper 250KP. For a closer price comparison, the 9600X (read our review) at 96 FPS AVG was outmatched by the 250KP by 24%.
In this one, Intel’s 250KP equaled the performance of the 14600K from a few years ago. The efficiency may be better, but performance hasn’t changed much in some of these games. As for the 245K, the 250KP ran 8.2% ahead in average framerate.
Outer Worlds 2 – 1440p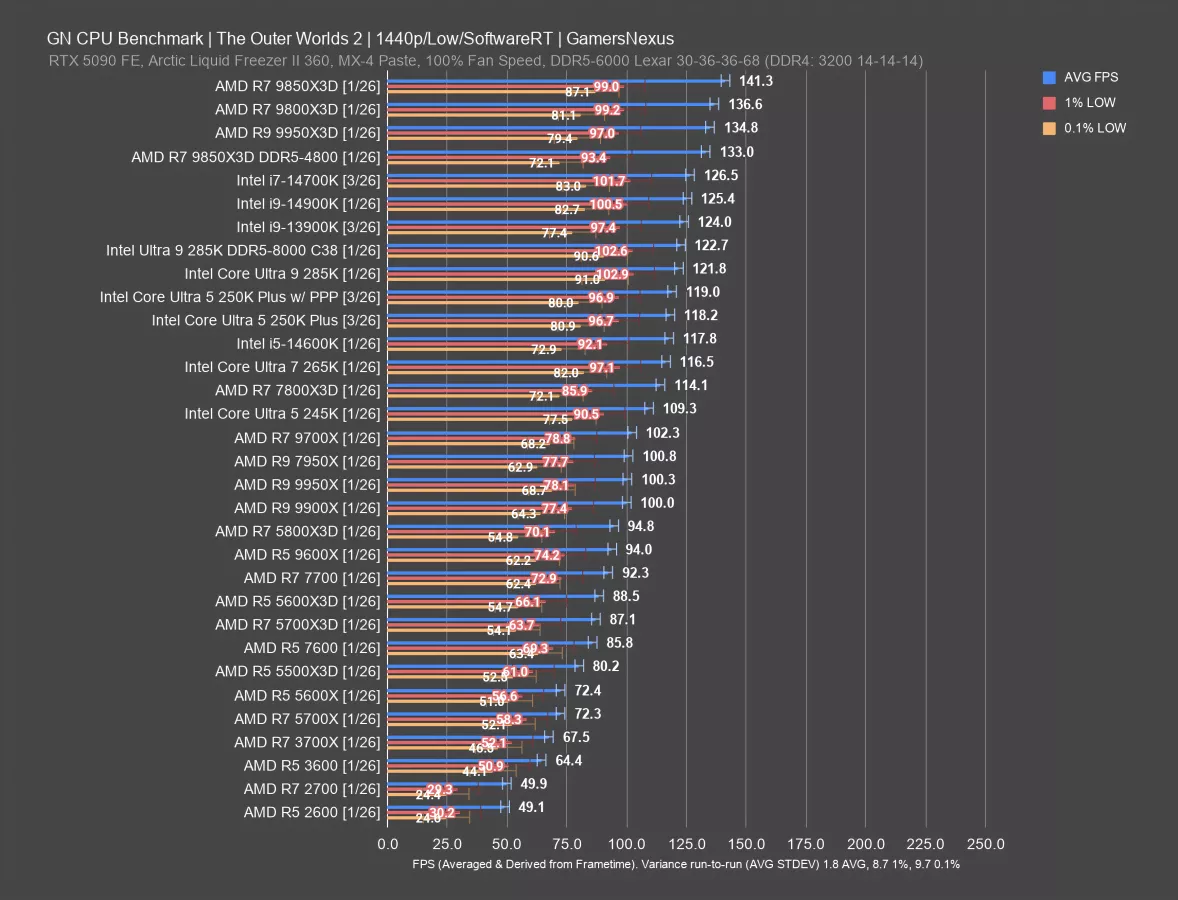
At 1440p, the 250KP ran at the same framerate as 1080p. We’re not GPU-bound even at 1440p with our test settings, as we’ve designed the test conditions to lean on the CPU as much as possible. In this scenario, there’s no meaningful change in this test. Even the 9850X3D isn’t meaningfully lower than before. We’re fully CPU-bound with the same scaling, so let’s move on.
Stellaris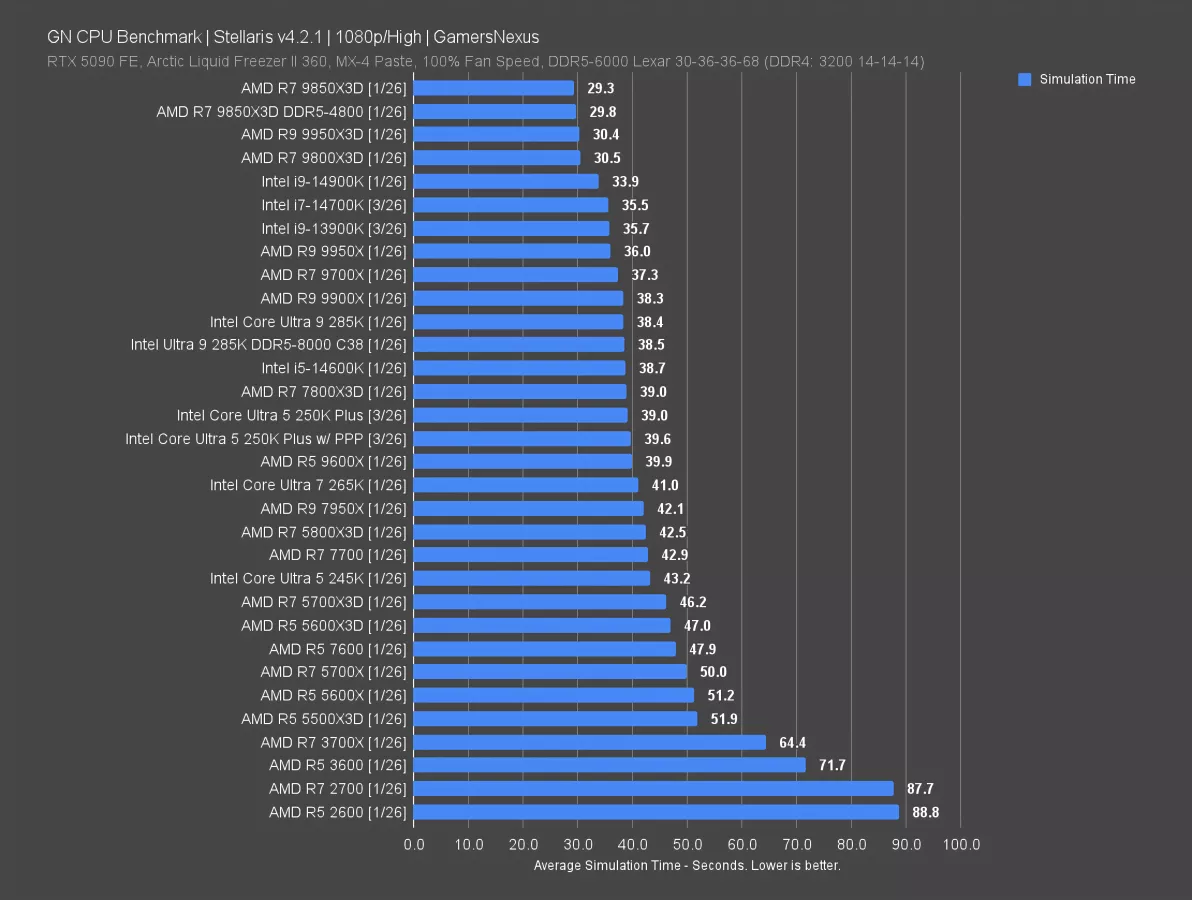
Stellaris is up now. This is tested using simulation time rather than framerate, meaning that there’s a real-world time difference in how long something takes. A faster CPU will allow the game to simulate faster.
The 250KP both with and without PPP took about the same amount of time, both around 39 seconds. There was no difference between them. We’ll take the better of the two results (at 39.0 seconds) for comparisons.
The 250KP doesn’t meet the 285K’s performance level in this one, with the 285K benefitting from a 1.5% simulation time reduction versus the 250KP. That said, the 285K is about $330 to $360 more expensive than the 250KP, depending on where you buy it now. That difference might be worth it in production applications, but isn’t in this situation.
The 250KP outperforms AMD’s closest modern price comparison, the 9600X, by a few fractions of a second in the simulation test. These two are about the same in this test. The 250KP outdoes the 265K by about 1-2 seconds and the 5800X3D (watch our review) by about 2-3 seconds.
Against the 245K, the 250KP benefits from a 9.7% reduction in simulation time. That’s a large improvement for Intel, especially since the 245K has also been about $200 lately.
Just for perspective on the scale of this chart, the 9850X3D’s results have a time reduction of about 25% from the 250KP. These are totally different by price class, but it helps give perspective to the maximum uplift available.
Kingdom Come: Deliverance II – 1080p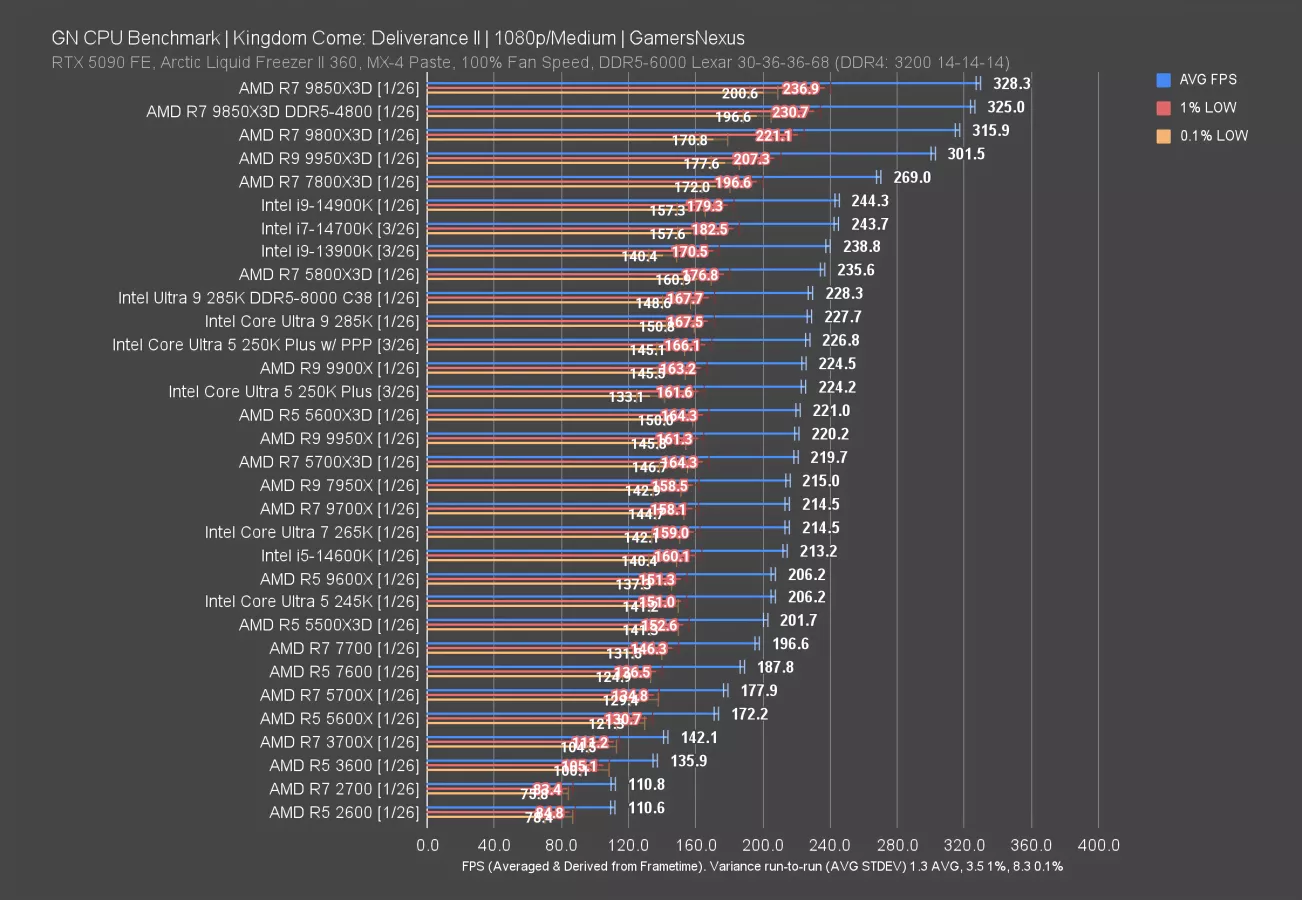
We added Kingdom Come: Deliverance II for our 2026 test suite. At 1080p, the 250KP with PPP ran at 227 FPS AVG, leading the 250KP without its PP Package enabled by about 1.2%.
The 250KP is roughly tied with the 285K and follows the 5800X3D, the latter of which has a lead of 3.9% at 236 FPS AVG. People who bought the 5800X3D for gaming and who don’t need the extra multithreaded non-gaming performance really got out ahead with the 5800X3D. The CPU is GOATed at this point.
Against the 9600X for a modern AMD price comparison, the 250KP runs 10% higher framerate.
As for the 245K’s 206 FPS AVG, the 250KP sees a massive improvement of 10%, while the 245K’s launch MSRP was 55% higher. These are both moves in the right direction. Of course, the 245K wasn’t positioned well at launch for gaming, as Intel’s own 14600K outperformed it.
Previously, we didn’t see much benefit from faster memory in this test with Intel. Our DDR5-8000 C38 kit only boosted the 285K by fractions of a frame per second, which is within error and variance.
Kingdom Come: Deliverance II – 1440p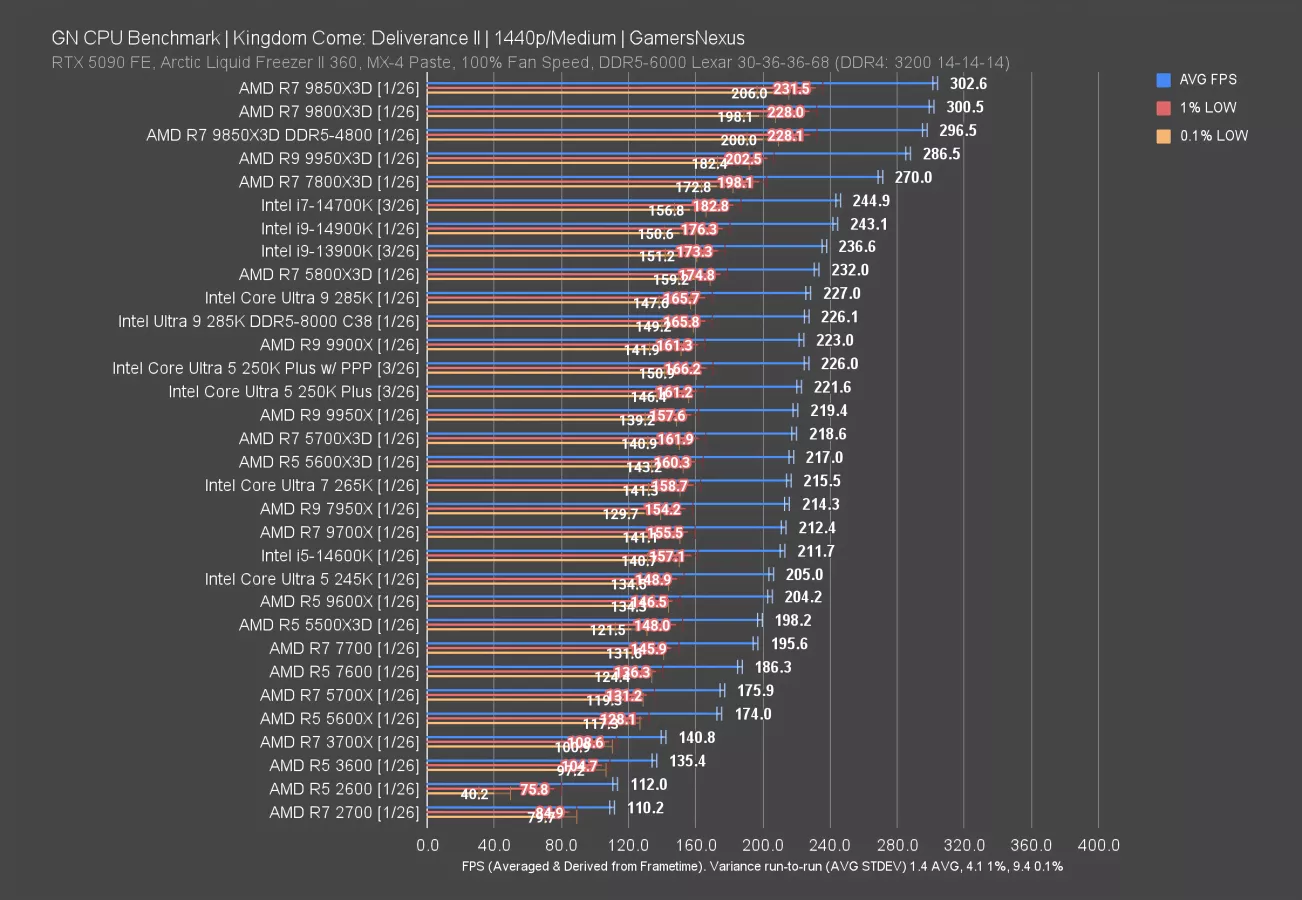
At 1440p, the 250KP ran at 222 FPS AVG without PPP and 226 with it. The stack is overall preserved, mostly, with the exception of the CPUs at the top. We see the 9850X3D get truncated by about 20 FPS as a result of the higher resolution.
There’s not much change here since the 250KP is below the GPU’s capabilities.
Dragon’s Dogma 2
Dragon’s Dogma 2 is up next.
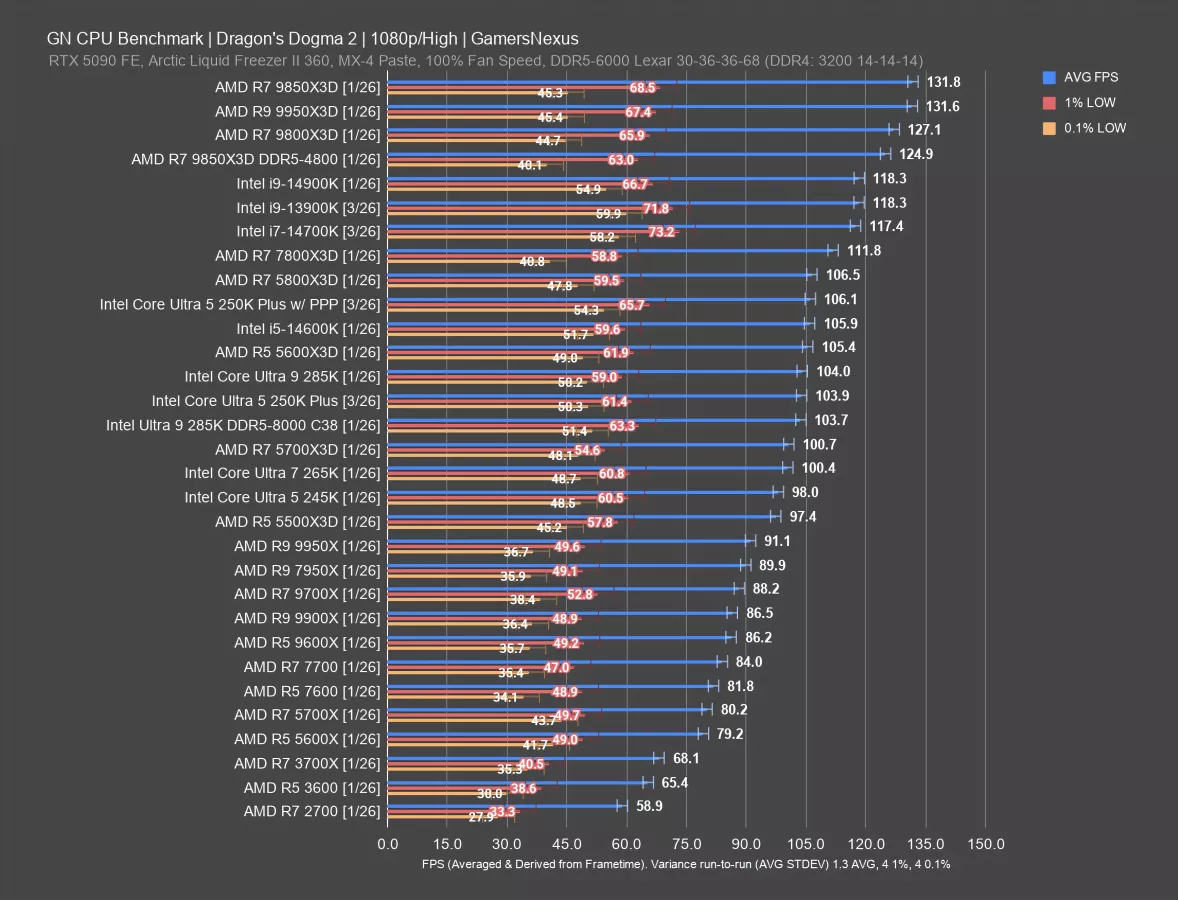
In this one, the Ultra 250KP ran at 106 FPS AVG with PPP and about 104 FPS without it. They’re roughly the same, but this matches the trend of slight improvements so far. In this case, that’s 2.1%. The lows also improved, although lows have more variance in the measurements.
Taking the higher of the numbers, the 250KP ends up just ahead of the 14600K — finally beating Intel’s prior 5-series CPU after the 245K lost to it significantly. The 14600K led the 245K by 8%, and now the 250KP has brought Intel back to where it was in 2023 — but at least the price improved more rapidly.
The 250KP also happens to match the 5800X3D this time, with the 7800X3D (watch our review) offering minimal uplift. The 9800X3D still has a jump up, but the 250KP is achieving most of the possible performance in this test at a fraction of the price of most of the other high performers. The 9600X falls behind in this one, down at 86 FPS AVG and yielding a lead of 23% to the 250KP.
Cyberpunk 2077 – 1080p/Medium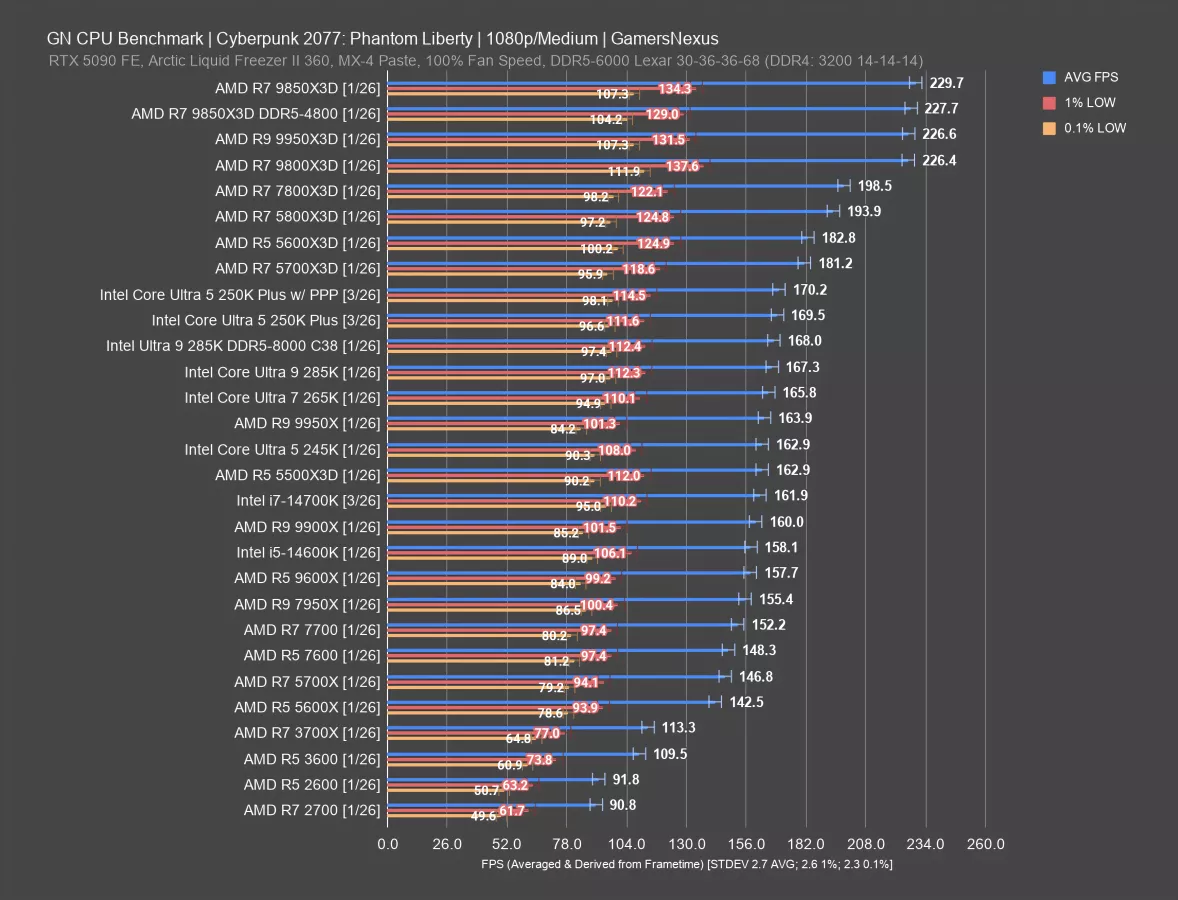
In Cyberpunk 2077 with 1080p/Medium settings, the 250KP ran at 169.5 FPS AVG against the 170.2 FPS AVG result of the version with PPP installed. The lows are comparable between the two and functionally the same. This is within margin of error and test variance for all 3 metrics. We’ll use the faster of these to compare.
In this game, X3D completely dominates the top of the chart: Every X3D CPU except the 5500X3D leads here, with the 5700X3D, 5600X3D, and 5800X3D likewise ahead of the 250K Plus. The 5800X3D has a lead of 14% in average framerate, with lows also improved. The 5600X3D isn’t far behind that and had a more similar MSRP for the people who lived near enough to a Micro Center to buy one at its launch.
Against something still sold by AMD, the 9600X ran at 158 FPS AVG and gives up a lead of 8% to the 250KP with PPP. The 245K is predictably also beaten by the 250KP, in this instance by about 4.5%.
The 14600K is down at 158 FPS AVG in this game, so this is an instance where it was below the 245K already.
Cyberpunk 2077 – 1080p/High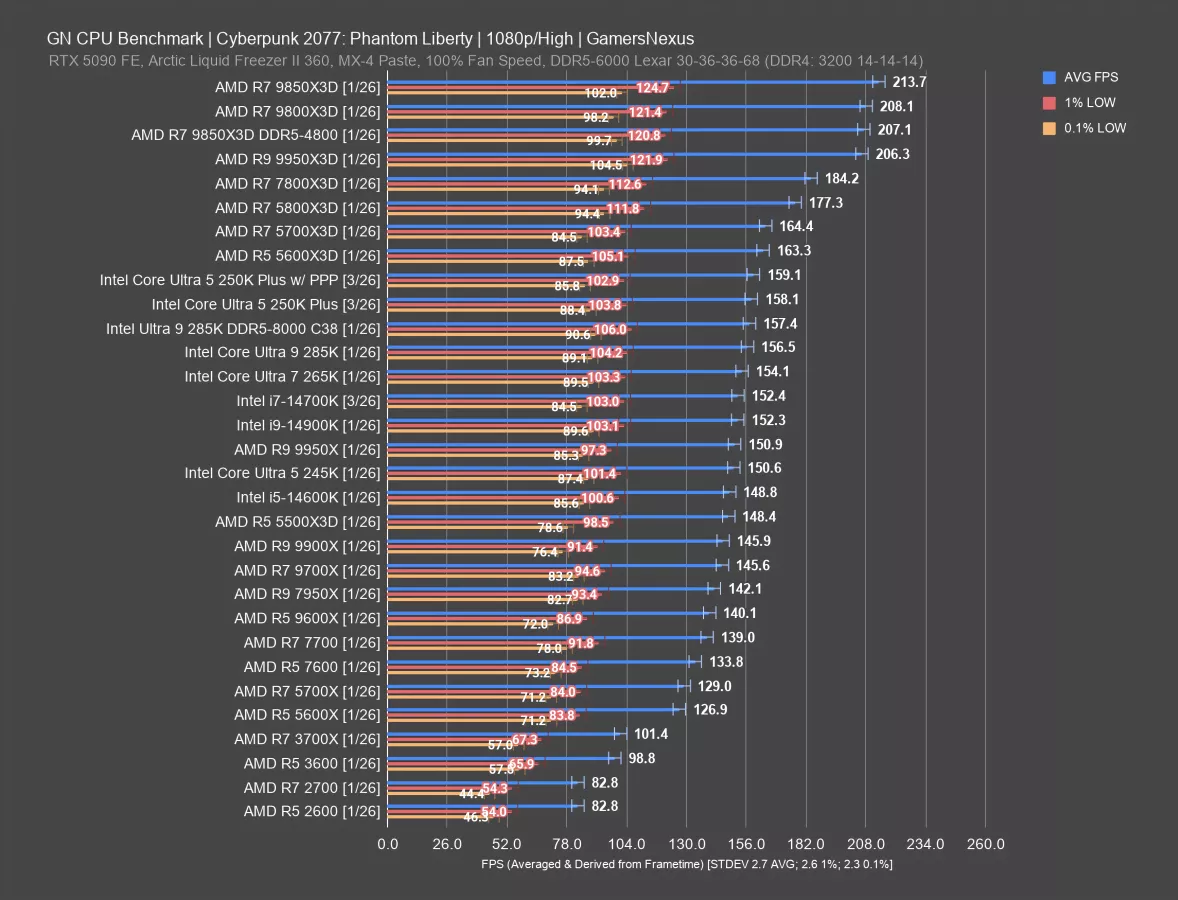
Increasing the graphics load by moving to High, the top-end drops from around 230 FPS to 214 FPS AVG now for the 9850X3D. Other than the top few, the rest of the CPUs aren’t affected much by imposing more of a bottleneck at the top-end.
The 250KP with PPP ran at 159 FPS AVG, outdoing the non-PPP test by 1 FPS AVG. Lows are within error of each other.
The 250KP is closer to the X3D parts now, landing about 4-5 FPS behind the 5600X3D and 5700X3D. The 5800X3D leads by 11%. The 9800X3D’s lead is less impressive now that it’s limited on GPU load, but it’s still 31% ahead.
For a more appropriate comparison, the 9600X ran at 140 FPS AVG and had lows at 87 and 72 FPS. The 250KP 159 FPS result is ahead of the 9600X by about 14% in this test.
Just for some references to older parts, users on the 2600, 2700, 3600, and 3700X would see large uplifts by moving to any of these newer CPUs from Intel or AMD. It’s not worth doing unless you really need the performance, just considering that’d require a move to DDR5 as well (and the RAM prices remain crazy), but the gains are large at this point.
F1 25 – 1080p
F1 25 is up next.
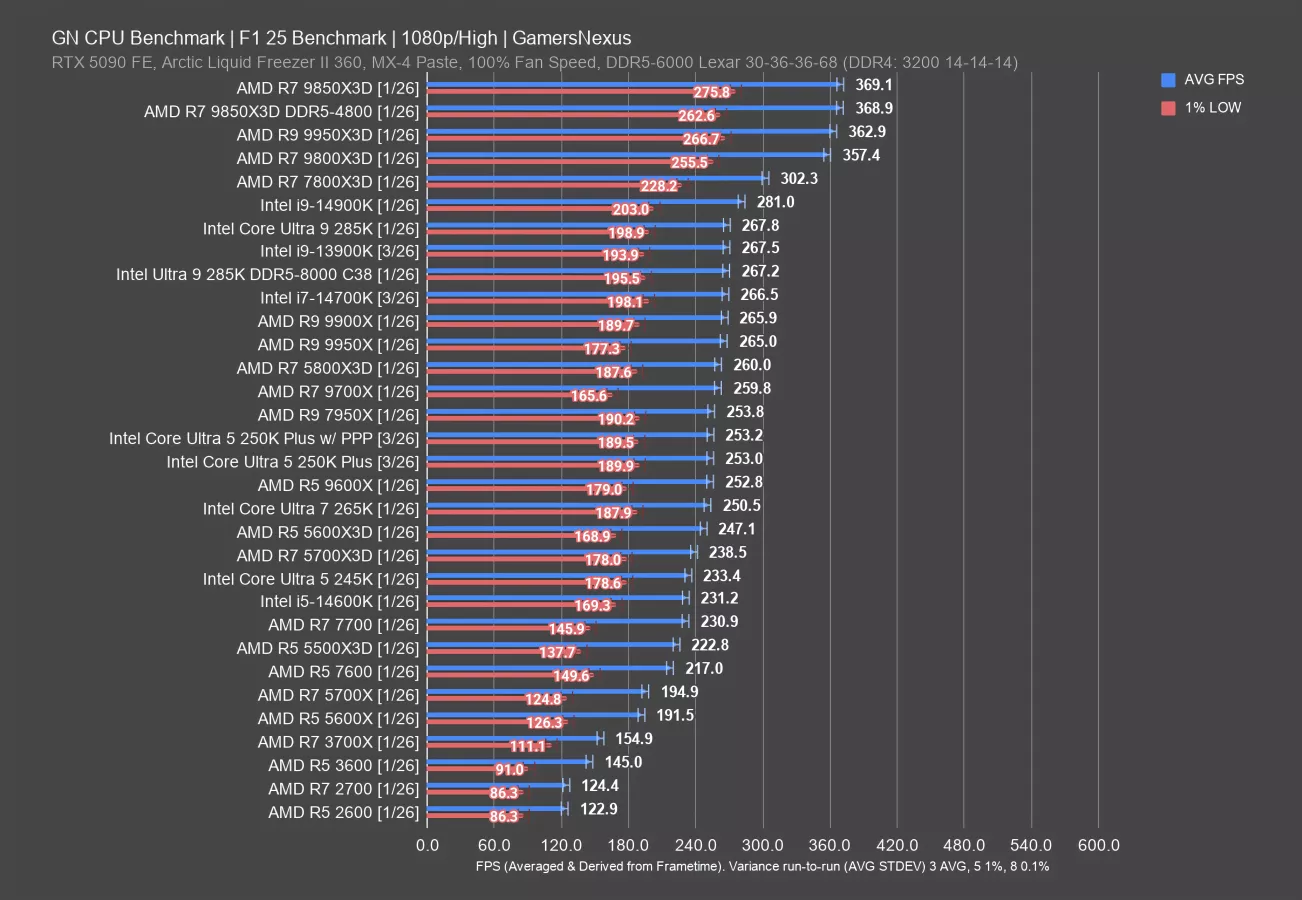
At 1080p, F1 25 positioned the 250K Plus with PPP at 253.2 FPS AVG, which is a staggering 0.2 FPS faster than without PPP. It is truly incredible what Intel’s technology can do. Their ingenuity knows no bounds.
The 250KP is equal to the 9600X in this game, although with slightly better 1% lows. Overall, these two CPUs are the same in performance, although one of them goes into a socket that has a few more years of support and presumably at least one generation after it — and it’s not Intel.
Intel’s 250KP is outdoing the 265K by a few frames per second. It doesn’t match the 285K in this one, which ran at 267 FPS AVG both with our standard RAM and with the DDR5-8000 C38 kit (which were tested within error of each other). The 285K with our standard RAM outperforms the 250KP by 5.8%. The 5800X3D also outdoes the 250KP, but the 250KP at least runs a higher framerate than the 5600X3D (although not by much) and the 5700X3D.
The improvement over the 245K’s 233 FPS AVG is 8.5% for the 250KP, with a similar lead over the 14600K. In this one, at least, Intel has outdone its predecessor.
Starfield
Starfield is up next.
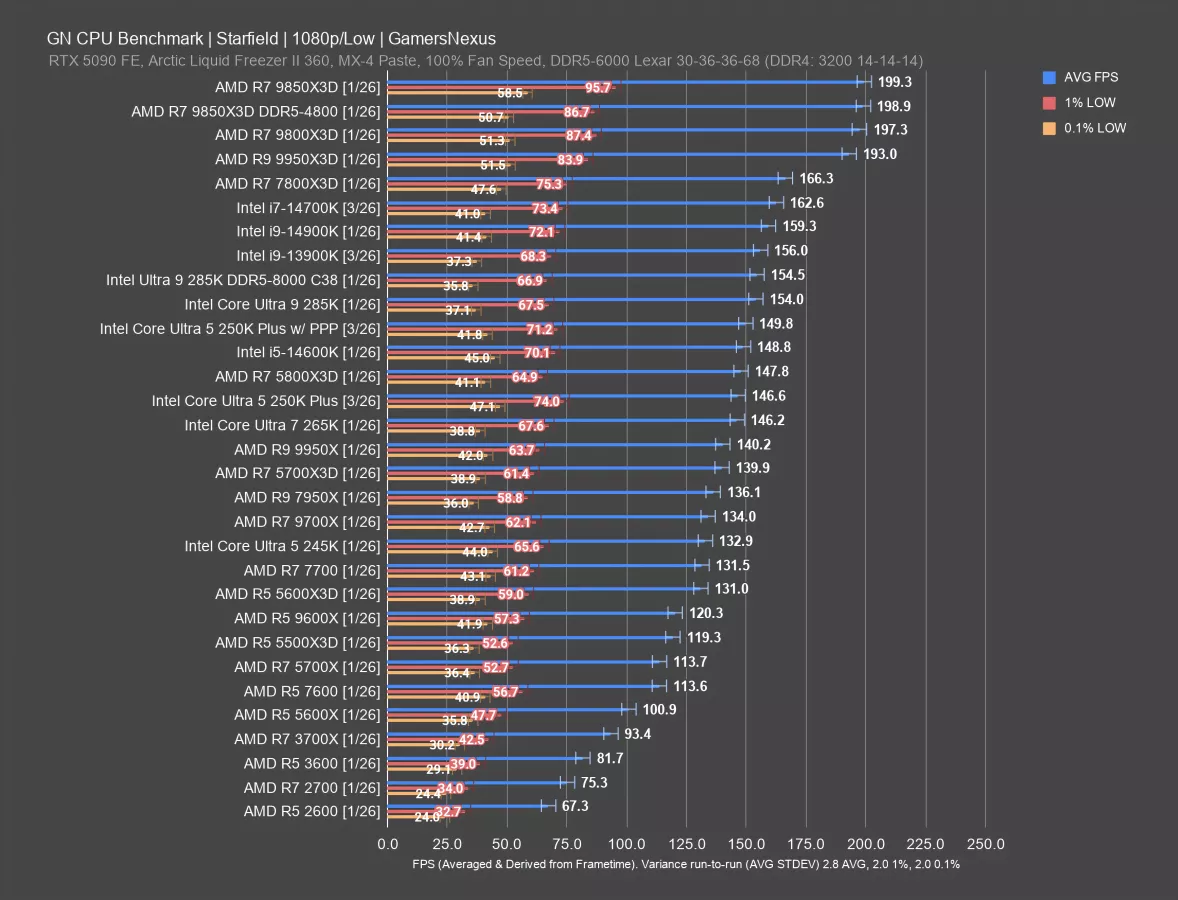
In this game, the 250K Plus ran at 147 FPS AVG, tying the 265K and also producing better 1% and 0.1% lows. This has the 250KP just below the 5800X3D. Installing PPP improved performance to 150 FPS AVG, about a 2.2% uplift that allows the 250KP to marginally surpass the 14600K (although they’re within error of each other). The 285K leads the 250KP with PPP this time, at 2.8% ahead. Adding fast memory didn’t do much for the 285K.
In this game, the 5600X3D and 5700X3D CPUs don’t do as disproportionately well as some other games. They’re still good, but the 250KP ends up ahead of them. As you’d expect, the 9800X3D and its refresh end up at the top of the chart but remain in a different price class.
Intel has managed to mostly invalidate its prior 200 series lineup with this $200 CPU when it comes to this game; however, we still have production workloads to look at.
Production Tests7-Zip Compression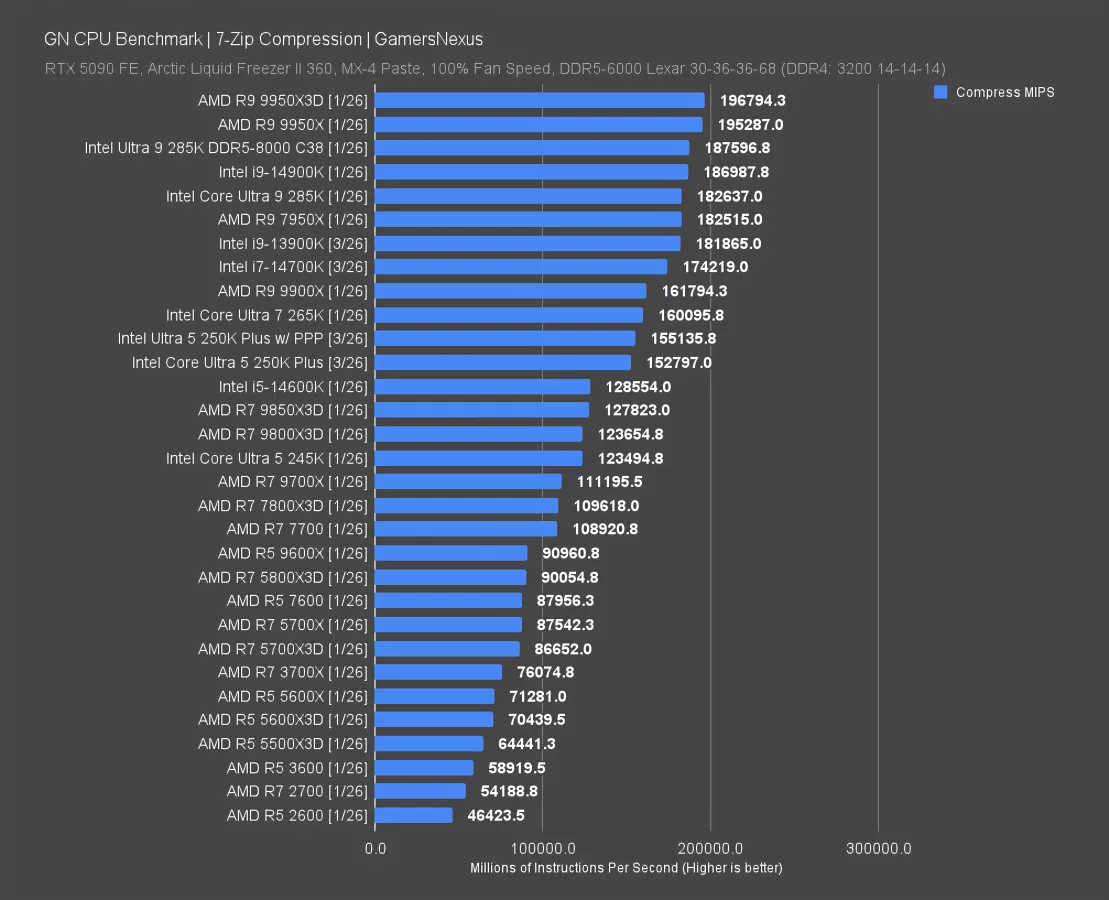
We’re moving on to production tests, which is one of the areas Intel’s newer CPUs have done a little bit better as compared to their gaming results. Extra X3D cache doesn’t offer much benefit in our production test suite.
In 7-Zip compression testing, we measure performance by calculating how many millions of instructions per second each CPU can complete. The 250K Plus completed 152.8K MIPS with our initial run, with PPP improving by 1.5% over the original result.
These results put the 250KP below the 265K, which has a 3.2% advantage over the 250KP PPP.
AMD’s 9600X is far down here, which isn’t news for the 6-core part in production tests. Intel’s 250KP has a 71% lead over the 9600X in this compression test, which is starting to feel like a mirror of 2017 AMD where production was its only real bastion of hope before it made gaming work.
The 285K at 182K MIPS leads the 250KP by 17.7%, with AMD’s 9950X (read our review) CPUs at the top. As for the 14600K, Intel’s new 250KP finally manages to move the needle beyond what we saw with the 245K, which was mostly a disappointing result previously. The 250KP leads the 14600K by 21% in this test.
7-Zip Decompression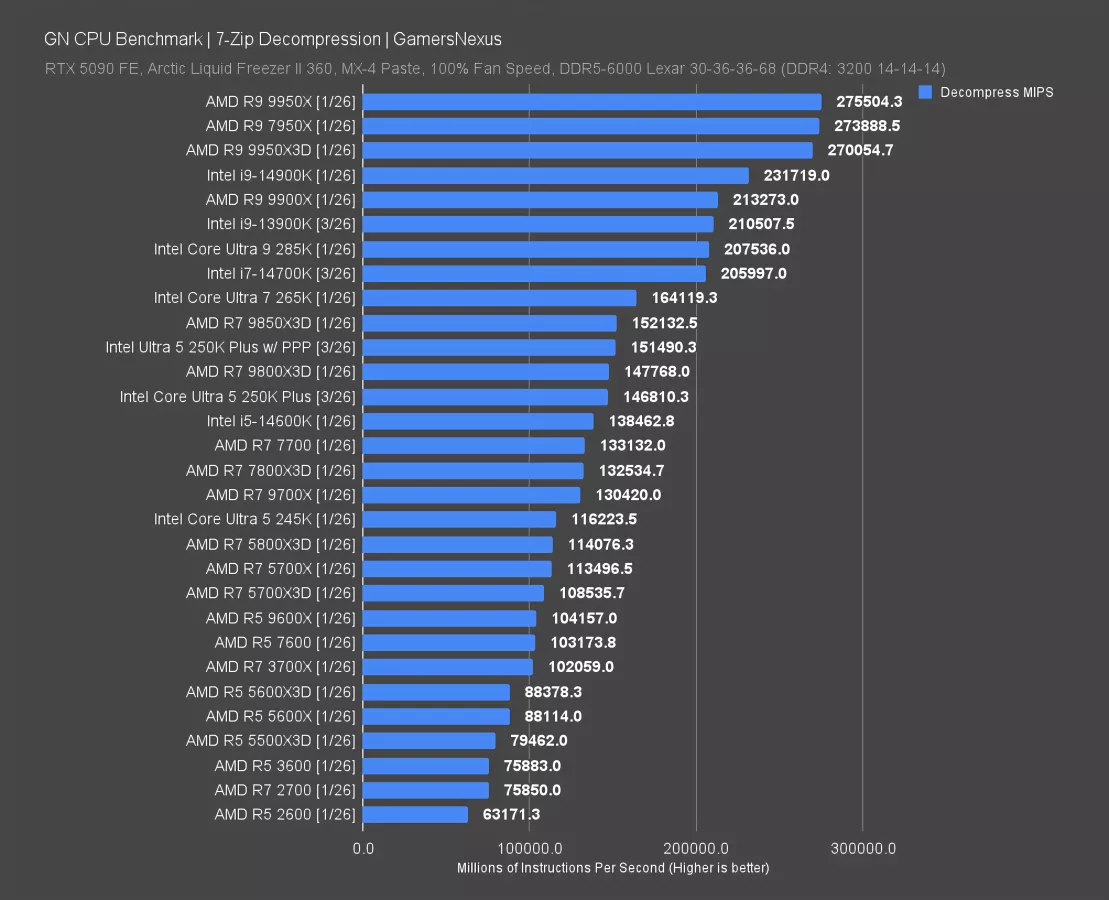
Decompression testing is next. In this test, the 250K Plus completed 146.8K MIPS, which matched it with the 9800X3D. The 8-core X3D CPUs have never been impressive in this test, as most of their benefit is in gaming. Enabling PPP pushed it up to 151K MIPS, an improvement from without PPP of 3.2%.
The 14600K only slightly trails the non-PPP result, at 138K MIPS. The 151K MIPS 250KP result leads the 14600K by about 9%.
AMD’s 9600X isn’t as far down as it was in compression, but the 250KP still has a 45% lead over the $190 AMD CPU.
The 285K is about 37% ahead of the 250KP here, so we’re interested to see how the 270KP does in our next review video.
Blender
Blender is next. For this, we run a tile-based CPU render of one frame from our intro logo animation, but at a higher sample count and quality.
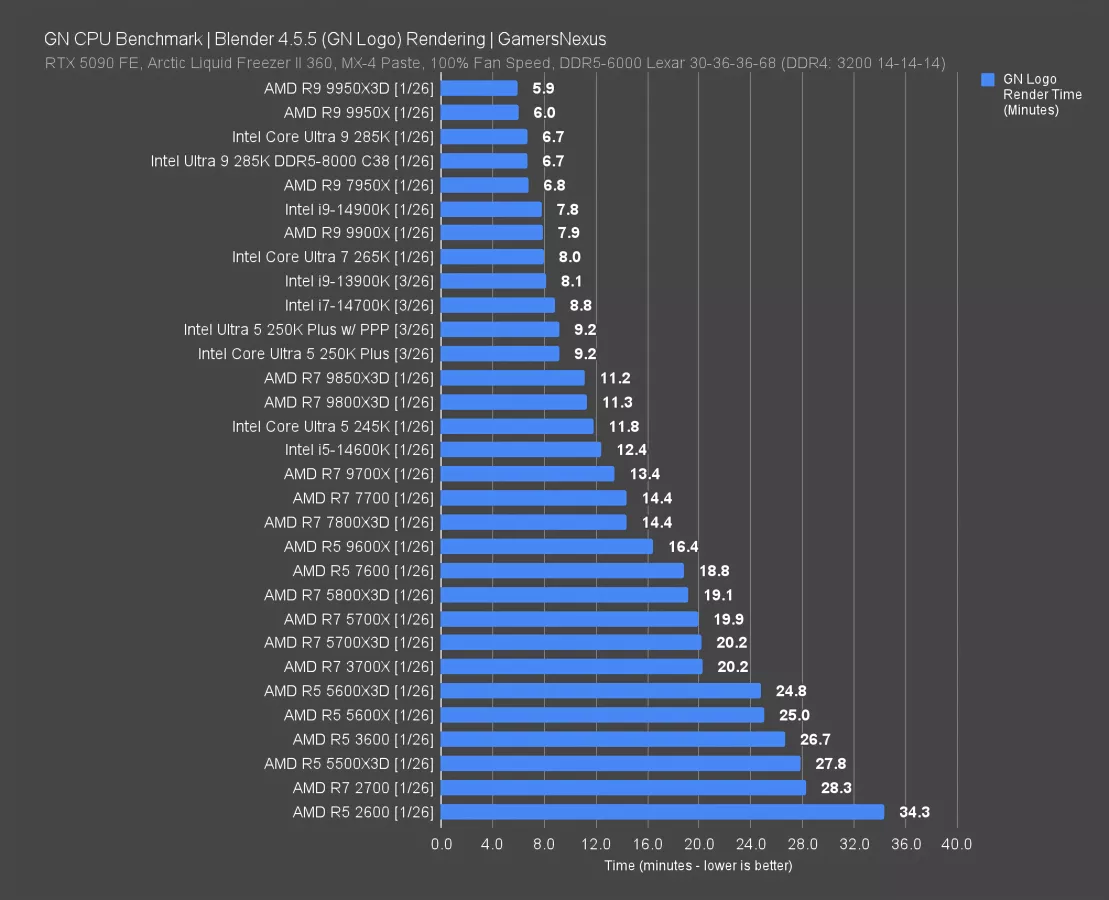
The 250KP required 9.2 minutes to complete the render under both test conditions. That render time requirement has its result reduced from the 14600K by 25.8%, with the time requirement reduction against the 245K at 22%. The 265K still leads the 250KP, unlike in some of the game tests, with thanks to its core configuration.
This is a highly core-dependent benchmark, so CPUs like the 8-core X3D parts fall below performance of higher thread count CPUs. This is also why the 6-core 9600X struggles in this one, down at 16.4 minutes render time. That means the 250KP required 44% less time than the 9600X.
Photoshop
Adobe Photoshop testing via the Puget Suite is next. This testing measures performance in points by running automated sequences of filters, scales, warps, and other Photoshop functions.
 _ GamersNexus-4x_foolhardy_Remacri_8.png.webp.webp)
AMD’s top CPUs here are all functionally the same in performance, with no real advantage to the 16-core parts versus some of its better 8-core parts. We don’t have the 14900K retested in this one anytime recently and were too busy benchmarking Crimson Desert to go back for it, but we do have the 14700K. The 14700K has about the same overall score as the 250KP and R5 7600 in this test, which matches the results we had in this test a little over a year ago in terms of relative scaling.
The 250KP outdoes the 285K by 4%, including with DDR5-8000 (by 1.7%). It also bests the 245K by 6.7%, below which we can find the 5800X3D and other AM4 CPUs.
As for AMD’s 9600X, which is its main price competition right now, that’s 14% ahead. AMD generally does well in Photoshop testing via the Puget Suite right now, which is a flip from several years ago when Intel used to be the holdout in this test.
Chromium
Chromium code compile testing in Windows is next, measured in minutes to build the codebase.
 _ GamersNexus-4x_foolhardy_Remacri_8.png.webp.webp)
This chart has the 9950X3D (read our review) comfortably at the top and benefitting from its extra cache and higher core count. The first Intel CPU on the chart is the 285K — which, credit to it, is doing really well here at 106 minutes to complete the compile. The 14700K is Intel’s next CPU behind that (until we retest the 14900K in this workload, anyway). Eventually, the 250K Plus both with and without PPP land at around 133 minutes to complete the compile. That means that these entries benefit from a reduction in compile time versus the 245K of 21%. The 285K and 265K both lead these CPUs, though, with thanks to the clocks, cache, and cores being put to good use here.
AMD’s gaming-class CPUs haven’t been as competitive in this test as Intel in a while: X3D isn’t really built for this, with the cache helping less than more cores or higher clocks on something like the 9800X3D, which is slower than the 250K Plus.
Other notables include the 9600X down at 235 minutes, or a full 100 minutes longer to compile than the 250KP. The 9600X is limited in its abilities here with its 6C/12T configuration.
DaVinci Resolve
DaVinci Resolve testing is next. We use Premiere internally as we’ve plugged-in a bunch of custom automation to it, but Resolve is well-respected video editing software for its non-subscription approach and its better utilization of hardware for rendering.
 _ EXPERIMENTAL CHART _ GamersNexus-4x_foolhardy_Remacri_0.p.webp)
This is an experimental chart. We label these clearly to disclose when our confidence threshold is lower than it is for other tests. We are new to testing DaVinci Resolve, so to be transparent about it, that means there’s more risk of an issue with the testing process or data in this chart than there is in other charts. We run experimental charts with disclosures because we need to begin gaining experience publishing it in order to gain the confidence to roll it into the full suite. We put these experimental charts out for the community to offer suggestions for improvement so that we can slowly work it into the full reviews at our usual high confidence.
In this one, the 250KP scored 12993 points, putting it below the 265K. The 250KP improves on the 245K by 12% and improves on the 9600X by 16.8%.
The 5600X3D and 5700X3D give us some pretty valuable information here: Because the power budget is the same but the 5700X3D has 2 more cores, the 5700X3D spreads the same power over more cores, resulting in a clock speed deficit as compared to the 5600X3D. Because the 5600X3D technically outperforms it, that means that in this test, Resolve seems to weigh clock speed at least moderately.
It also appears to make use of the memory change in the 285K, where we gained 7.4% to 14,383 points from 13,398 points. This is a much larger gain than we saw in most other tests, including gaming (which typically is more sensitive to memory and, in particular, timings improvement).
Power Consumption in All-Core Workload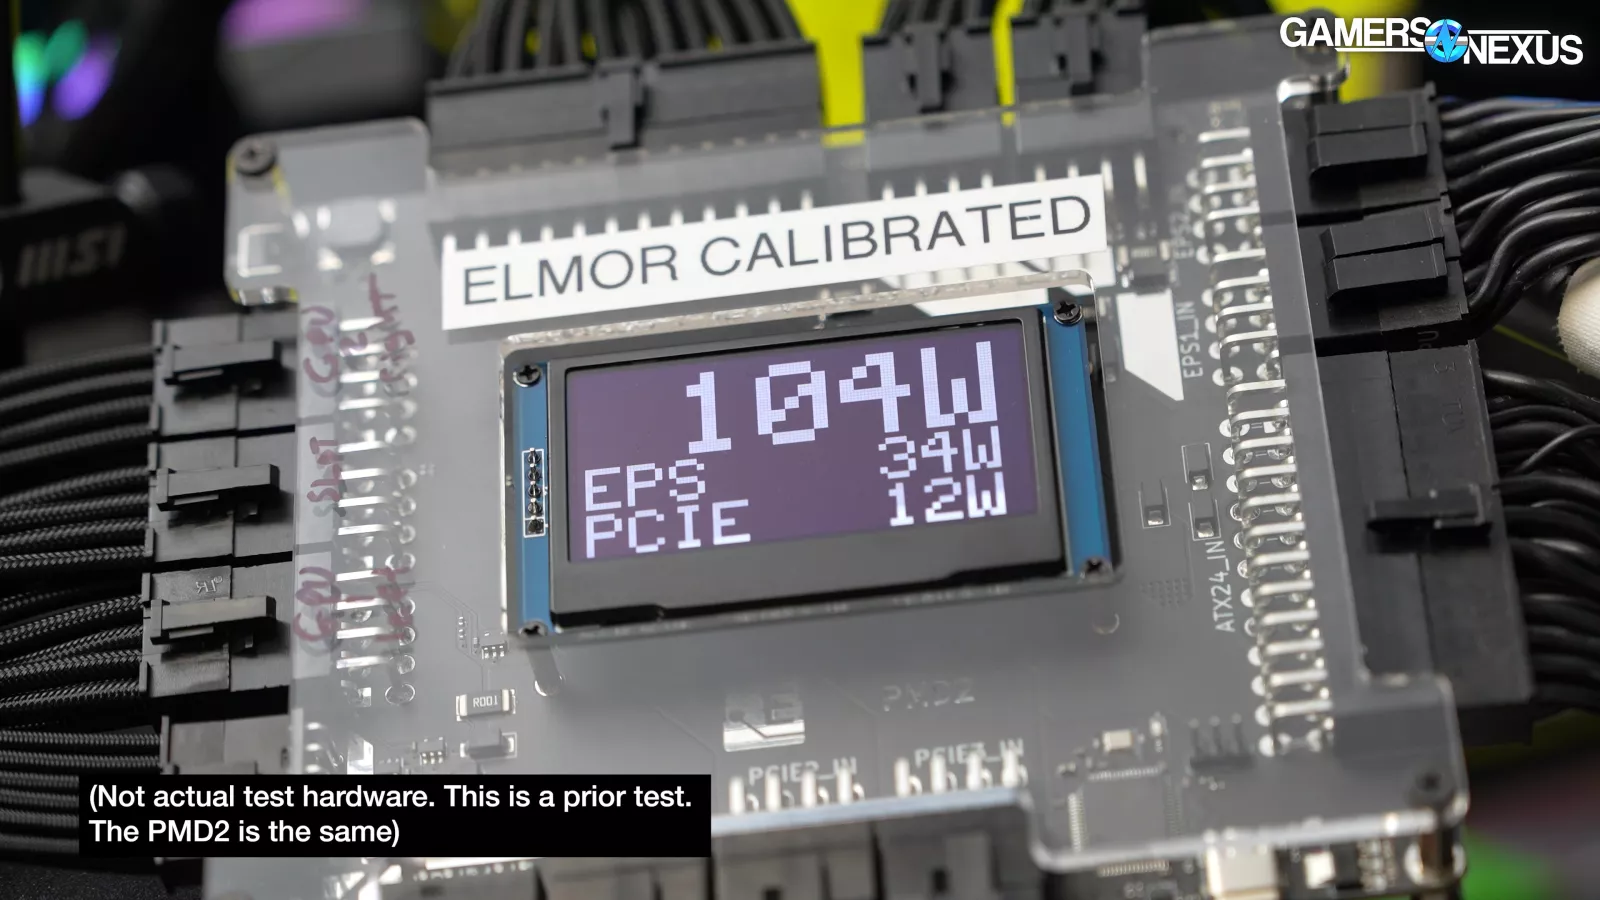
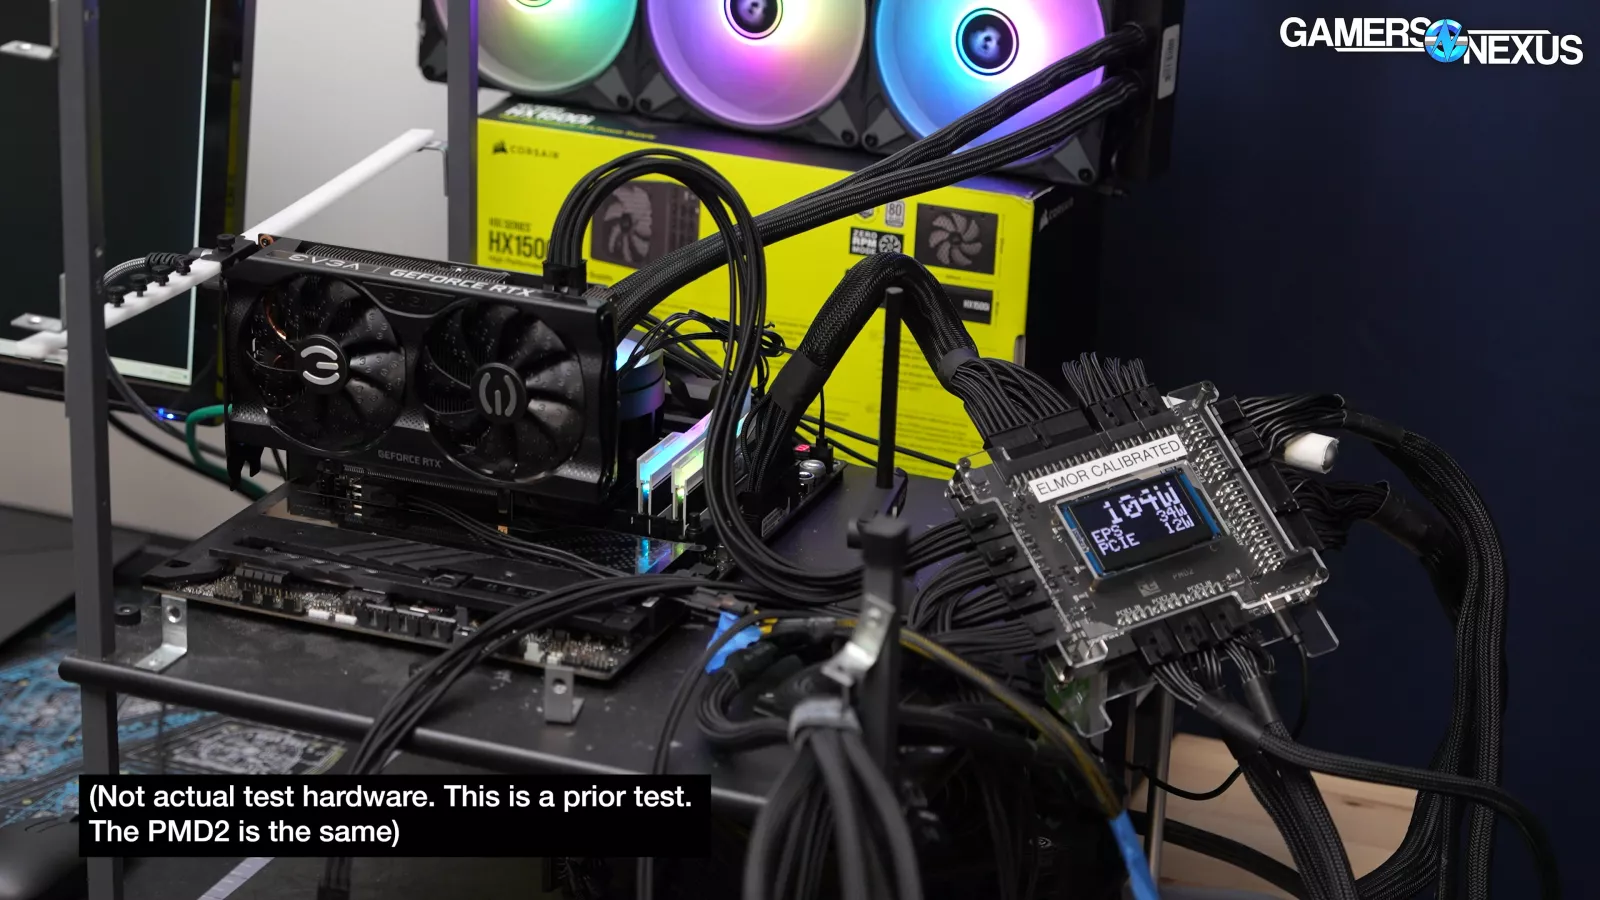
Now for our power test. This time, since the team was busy, we are keeping it pretty simple. For this testing, we set up a PMD2 as an interposer between the power supply and the test bench. So, there’s an external capturing device. It captures all the power delivered to the bench because the motherboard we’re using splits some of the 24 pin power to the CPU, which is abnormal. We take the ATX 12volt power, the EPS 12volt power, add them together, but we subtract out the PCIe slot, which we do by isolating the PCIe slot on a riser card strictly for this testing. So, that card is not there for the performance testing. And then we have some overhead for losses for VRM efficiency and other 12-volt parts on the board.
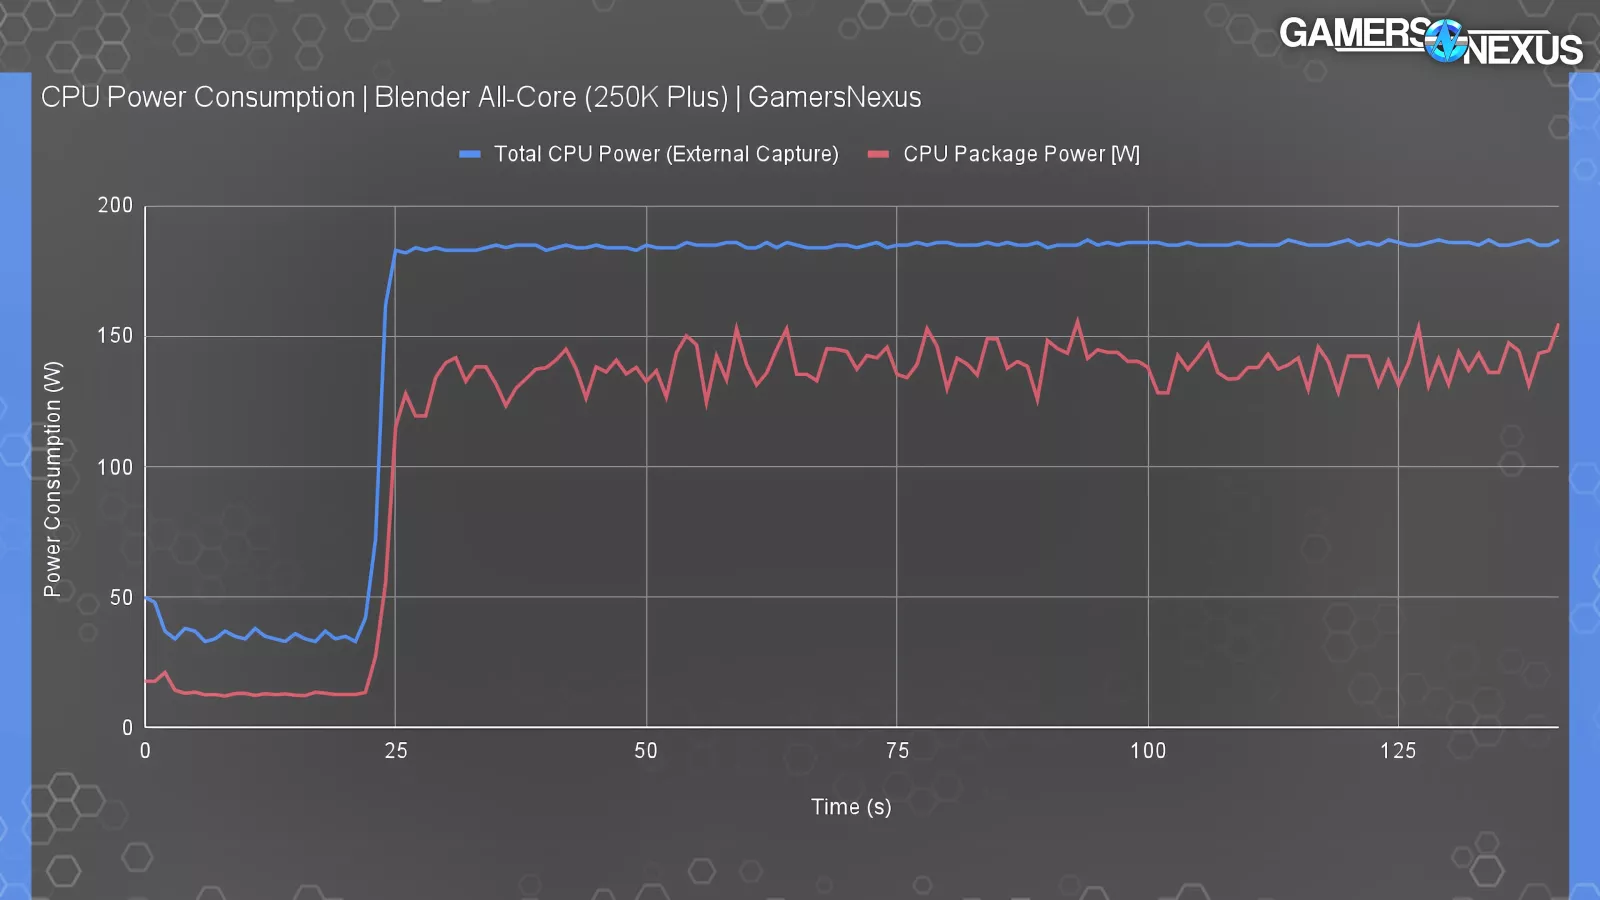
It’s not perfect, but it works pretty well. This test shows power consumption of the 250K Plus during an allcore Blender workload, which will be the worst case power draw scenario for the CPU. The external capture utilities using the method described have us at about 186 watts for the CPU. VRM efficiency losses and miscellaneous board components. That’s higher than TDP, but that’s also expected when taking external measurements. For reference, a CPU package power measurement using hardware info software yields around 140 to 150 watts in the same test.
Power Consumption in Gaming
We also measured some games as those scenarios tend to draw significantly lower power than an allcore workload. We’ll show just one because it kind of encapsulates all of them.
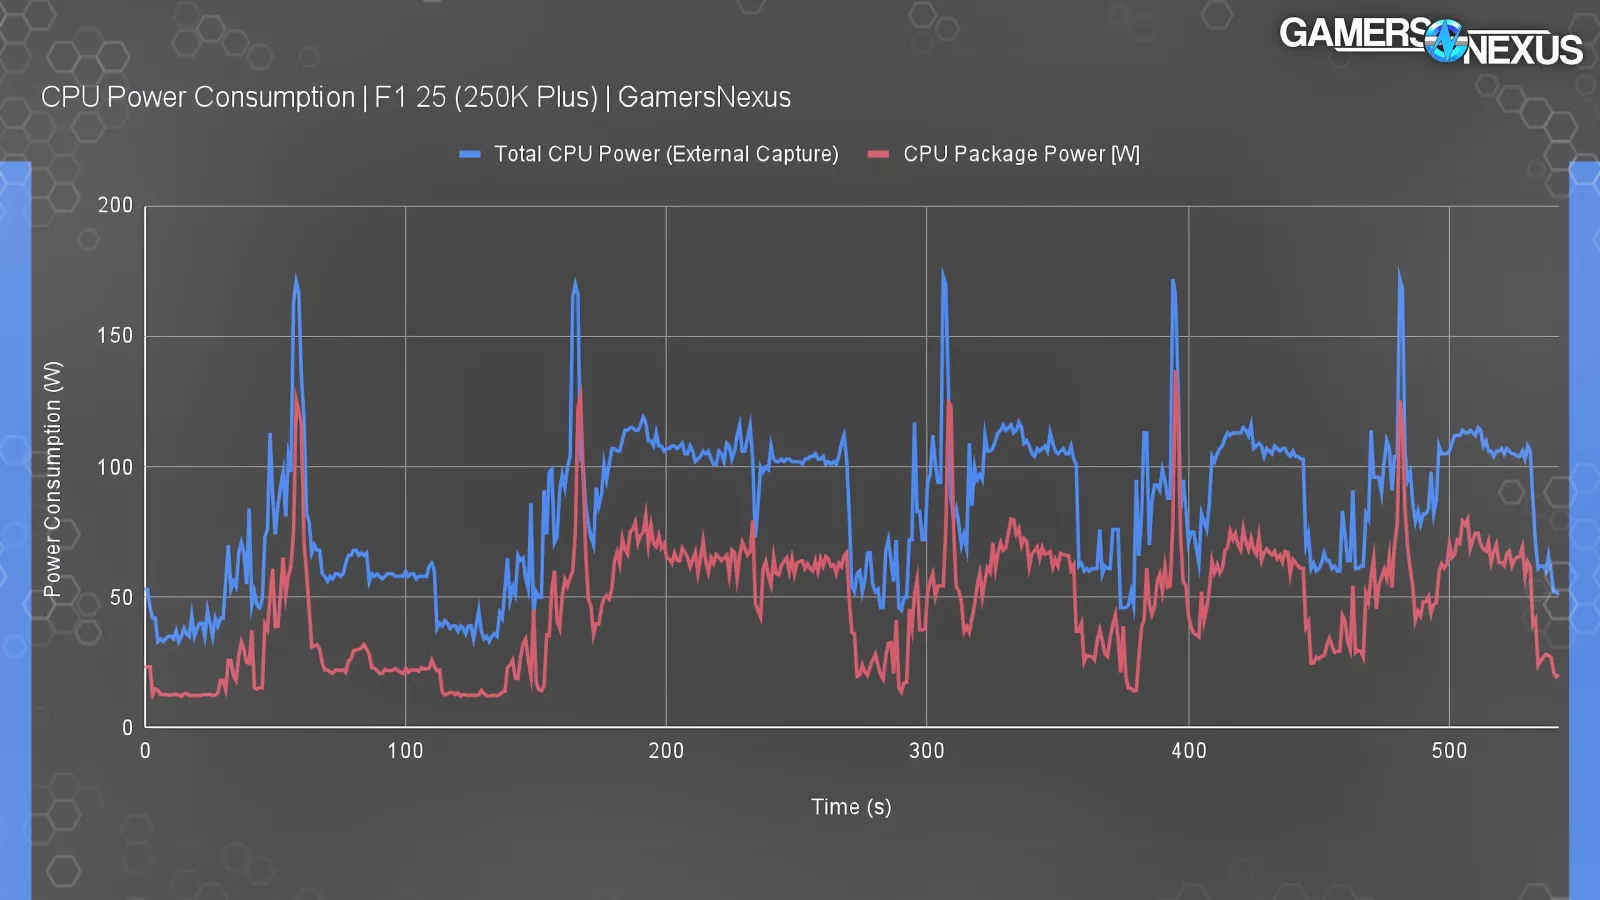
At F1 25 testing, you can see the loading screens and cycles with each of these spikes and dips. The peaks for externally captured power consumption landed at 171 watts with the valleys at 39 watts during low activity. During the game itself, such as around the 200 second to 270 second marks where we’re driving around the track, we saw around 100 watts from external capture. CPU package power was closer to 70 watts range via software readings. Our traditional power tests are complicated. They typically take two days of full time just to process the data and arrange it for performance per watt on charge. Plus, we need to do about a week of testing to get everything updated. So, for now, we’ll leave this one here just because of the time, but we may revisit it later.
Conclusion  Visit our Patreon page to contribute a few dollars toward this website’s operation (or consider a direct donation or buying something from our GN Store!) Additionally, when you purchase through links to retailers on our site, we may earn a small affiliate commission.
Overall, against Intel’s prior 200 series CPU launch, this is a lot better. The original launch was disastrous. It was a total mess and the price was astronomical for some of those CPUs.
Unfortunately, it’s arriving late in the cycle for these motherboards and likewise at a time when memory prices make system building difficult. Intel is partly to blame for that, as it’s all-in on the AI obsession alongside NVIDIA and AMD.
The big move here is price. Intel’s 245K was over $300 and its 285K, which is now often beaten or tied in gaming with the 250KP, is $530 to $560. The $200 CPU being an actually reasonable gaming part is great news. It’s actually competitive with AMD and sometimes better than it in a lot of price-for-price situations in non-gaming tasks. That’s good news. Intel’s 14600K gives it some trouble in some places, which does make it look a little bad sometimes, but in the very least, we’re just happy to see literally anything remotely affordable in this market because it has been really bad for a long time now. It’s tough because the memory pricing is still kind of ruining everything, but in a total vacuum, prices come down and their performance has gone up. And that’s what Intel needs to do if they want to start competing. And we’re starting to get some of the 2017 and 2018 era AMD 1000/2000 Ryzen vibes from this where Intel is starting to establish a bit more of a foothold at the lower price classes in non-gaming performance in particular, specifically in production workloads. They’re starting to establish a foothold there, which is how AMD got back into it with its 1000/2000 series where they were kind of okay in gaming, but they they really set up their foothold in production. And it almost looks like Intel’s going that direction right now. So, it could be pretty interesting in the next few years if you can still buy sticks of memory, but, we’re reviewing just the CPU today.
A few additional notes:

The 250K Plus does have an optional binary optimization tool, but it only works in two games in our test suite and 12 total. Of the two in our suite, even Intel itself is only claiming a 2% uplift.
We did go back through to run a couple quick comparisons with it and could not find a difference in Cyberpunk with any level of confidence. The numbers are basically within error. Final Fantasy saw a couple percent uplift, but outside of that, we didn’t have any affected scenarios.
As for the 200S Boost option that came out for the 285K previously, we ran that CPU back through just to collect some A/B numbers. This is what we came up with. It improves in some cases, so if you were to factor this into the earlier charts, it’d sometimes shift the 285K to parity with the 250KP rather than a slight loss.
That said, you rapidly get into an arms race here and this exits out-of-box defaults for the CPU. If we’re running this, we also need to go back through and enable other features for other CPUs, like PBO. Regardless, the numbers are there and it doesn’t move much for the 285K.
That’ll be it for this one. You have all the numbers. The memory market really casts a long shadow over everything, but we are happy to see pricing finally come down on something. We’d love to see Intel develop a platform with better longevity for its next release.