
After four rounds of the 2026 NRL season it looks like it’s Penrith against the field, and anyone taking the field is a clown. After last years reversion to the mean it seems like we’re back to peak 2020’s Panthers. Are we having a repeat of 2021 where we were just waiting for inevitable?
As for the rest of the NRL, it is early days but you can find flaws in any potential grand final opponent.
The Warriors looked like they could be contenders but stumbled against an under strength Wests Tigers side at home. Even if Melbourne were able to best the Panthers this weekend, I’d still be picking Penrith to be standing alone on the first Sunday in October based on the Storm’s capitulation against the Cowboys on Saturday night.
Penrith have conceded just 30 points after four games. At just 7.5 per game, they’ve allowed less than half of the next best defensive team (Canterbury at 16 per contest). They averaged 29.5 against for their first four games last season (118 points), and gave up 28, 38 and 30 points in their losses from Round 2 to 4 in 2025.
If we look at a heat map of their play the ball locations comparing the first four rounds of 2025 to 2026, you can tell corporate that they’re the same picture.
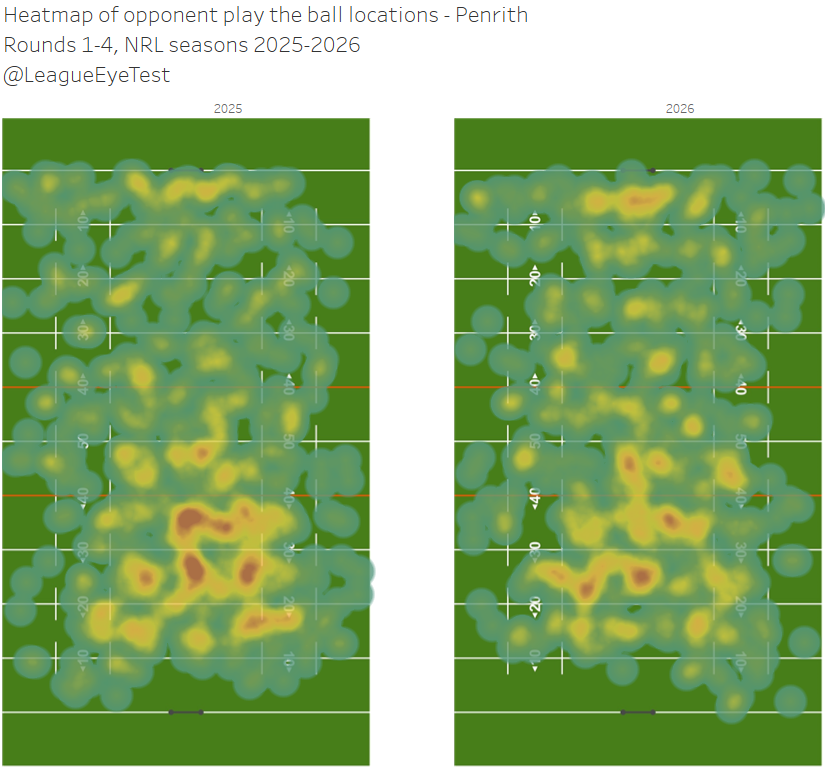
Yet one of them allowed nearly 30 points per game, and the other just 7.5. And it’s not as if Penrith have had an easy start to the season.
There was a lot of talk about the new rules suiting them. While that is true, it’s not just the set restarts and it’s incredibly reductive to say that’s the reason why. Penrith are -9 in net set restarts for the season which is first in the league. But Manly are -8 and the Dragons, Broncos and Cowboys are -6. Meanwhile the Tigers are +7, the Roosters and Dolphins +6, and the Warriors and Bulldogs are -1.
As I noted last week it’s not just the set restarts, but the compounding nature of consecutive play the balls.
Before I dive into the March efficiency update, first I need to update the weekly set restart cheat sheet:
Set restarts per game are up 55% year on year
29% are called inside 20-40m, the new addition for 2025
Removing the new zone, set restarts from 40m to the goal line are up 12.2% year on year
A set restart has been called every 30.4 play the balls, down from one every 47.3 in 2025
When including penalties, an infringement is called every 14.9 play the balls, down from 16.8 in 2025
76% of set restarts are Ruck Infringements v 24% for offside, last year was 73/26% split
Repeat sets (any type) are up to 39% of all sets, from 35% last year
Tries from repeat sets (any type) are up to 62% of all scores, from 59% last year
We saw the most set restarts in a half awarded on Friday night, as Ashley Klein handed out 12 of them in the first 36 minutes in the Broncos/Dolphins game. Somehow, we only ended up with another 2 over the remaining 44 minutes of that game, one in the 47th and one in the 79th minute from Reece Walsh that was probably a professional foul.
I decided to have a look at the half breakdowns, and this year we have 6.3 set restarts being called in the first half (the same average for a whole game in 2025), and just 3.5 in the second half. Meanwhile average penalties are 5.2 in the first half and 5.0 in the second half.
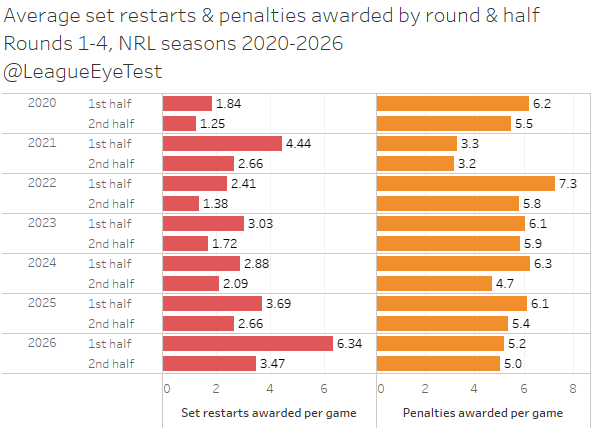
None of this is new though, it’s something I’d looked into previously. Set restarts just don’t get called after half time at the same rate. Are we meant to think that as players become increasingly more fatigued, that they still concede penalties at the same rate but not set restarts? That they’re able to improve their discipline around the ruck and stay onside as the game progresses but not other aspects of the game?
Thank you for reading The Rugby League Eye Test. Subscribe below to receive new posts in your inbox and support independent rugby league content.
It was just another week with an incredibly fast paced game and some significant injuries. Human bodies aren’t designed for this level of speed with high impact, I would love to hear a statement about this from the Players Association. It’s a credit to the players and teams involved that we had some incredibly exciting football played in Round 4 in spite of this chaos.
I’d like to give a big thanks to friend of the site and top tier yarn spinner Nick Campton who referenced this site in an excellent breakdown of the situation we’re in regarding set restarts. A recommended read.
On to the March efficiency update. To do this we use this site’s expected points model, the Eye Test Expected Points (ETxP). There’s an explainer on the site and last year’s Round 1 recap explains some updates as well.
Basically it looks at the probability of scoring a try based on a play the ball location, tackle number, minute of play and current margin. Based on that probability we then get an idea of the “value” of that field position, and the sum of every one of these possible try situations is summed and you get a number that represents the point value that an average team would have scored based on the field position and possession they had during a game.
It is not the total points that the two teams in the game would have scored, as no NRL team is exactly average, although some are pretty ordinary. Some are significantly above average like the Panthers, some above average like the Sharks, some below average like the Raiders and some like Manly that are just terrible. The final expected point scores are better viewed as the value of the field position they had.
For new readers, every month I compare each team’s actual points scored and conceded against the expected points they’ve gained and conceded. By comparing their on field output with the value of their field position, you get a greater understanding of how a team is traveling in attack and defense.
You can identify highly efficient teams who can score with limited goal line opportunities, or teams that need to hoard possession to cross the line, or teams that generate a high volume of red zone play the balls but don’t post points. We can also flip these defensively to see both sides of the game. I’ll explain more as we move on.
The first part is to plot each teams average for and against on a chart, with the average for and against for the league show as well.
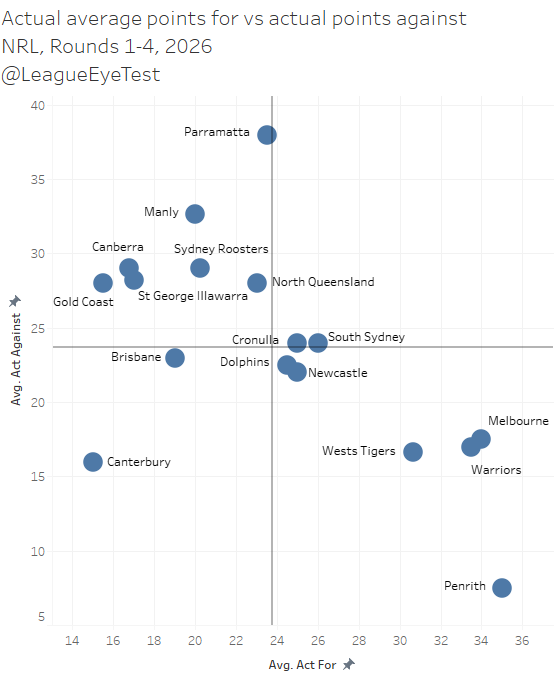
There’s a few notable things here other than the Panthers stingy defense. The first is the Bulldogs are averaging the fewest points in the league but have the second best defensive record on a per game basis. The Warriors, Melbourne and *checks notes* the Wests Tigers (?!) are the other three teams doing far better than league average defensively.
Meanwhile Parramatta are by far the worst defensive team in the league this season, giving up an average of 38 per game thanks to a draw having them play Melbourne, Brisbane and Penrith before Easter. Manly aren’t much better at 32.7 conceded per game, and have played considerably weaker competition in Canberra, Newcastle and the Roosters.
Now we can look at the same chart but this time by ETxP, giving us a view of the field position value for each team in attack and defense.
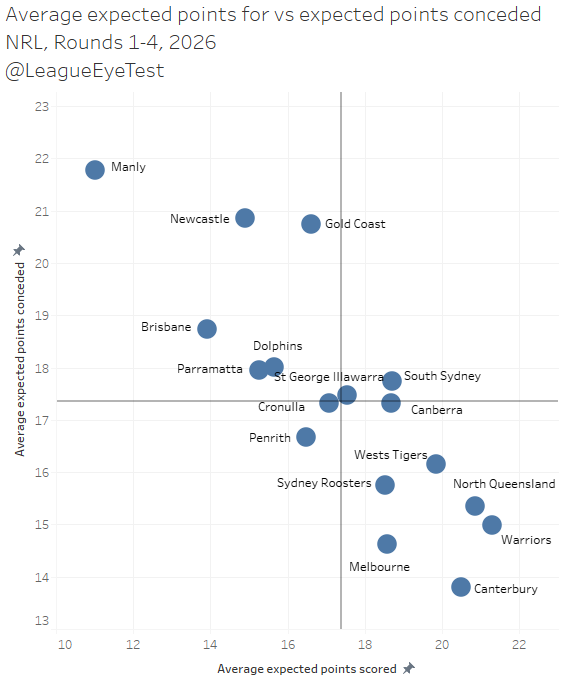
As for who is winning the field position battle, it’s easily the Bulldogs here. They have the third highest average ETxP per game at 20.5, and give up the lowest ETxP at just 13.8 per game. In simple terms, they get the ball to the right end of the field more than most teams, and no other team in the league is better than them at keeping opponents away from their line.
Melbourne are doing Melbourne things here, and The Warriors and Cowboys are also accumulating strong field position this season. Andrew Webster has the Warriors following the Ivan Cleary blueprint but they’re lacking the consistent focus that Cleary’s teams have.
The Knights and Titans are two of the worst teams at keeping opponents away from their line, both averaging over 20 ETxP per game, well above the league average this season of 17.4 expected points.
Here is where you can see the beginning of the issues for Manly. Not only do they concede the worst field position in the league this season at 21.8 ETxP per game, they also gain the least themselves at just 11.0 per contest. That is by far the lowest number of any team since 2016 over the first month of the season, with the prior low being Canberra in 2017 at 13.8. I’ll delve more into this Manly issue shortly.
With these two data points established, now we combine them to check actual points scored versus expected points scored to see how teams are using their field position. To assist in this, I split the chart into four quadrants based on league average for actual points and expected points.
From the top left we have “Efficient/Lucky”, for teams who have below league average expected point values (field position further away from the try line), but still manage to score a lot of points.
This can be because they’re a potent long range attacking team like the Dolphins, or especially this early in the season have benefited from a few poor reads by their opponents or lucky bounces of the ball. As the season progresses sitting in this quadrant moves more away from luck to skill.
The next quadrant is “Dominant”, where a team has above league average points scored and above league average expected points. Penrith are a pretty clear example of this style of attack.
Next is “Inefficient/Unlucky”, which is the inverse of “Efficient/Lucky”, where a team has below average point scoring but above league average expected points. Again, this early in the season it could be a case of a few dropped balls close to the line or a confusing Bunker decision.
And lastly we have “Incompetent”, for teams who can’t generate points on the scoreboard and are also unable to generate high value field position and are below league average for ETxP.
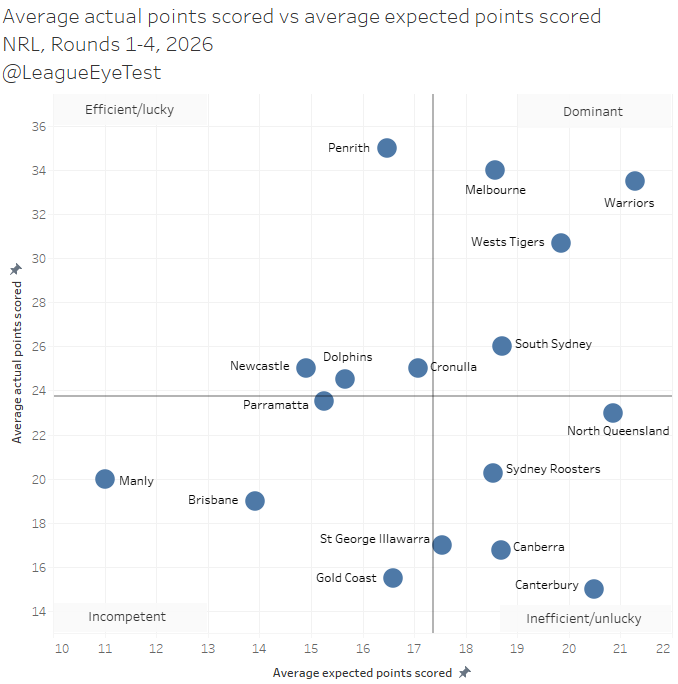
The surprising thing for me here is seeing Penrith in the “Efficient/Lucky” quadrant, as they’ve been a staple of the “Dominant” one since 2020. Granted they are nearing the boundaries of that quadrant, but this is why they’re a little more dangerous than prior seasons when they would score off a build up of attack.
This season they’re scoring quicker and from further away.
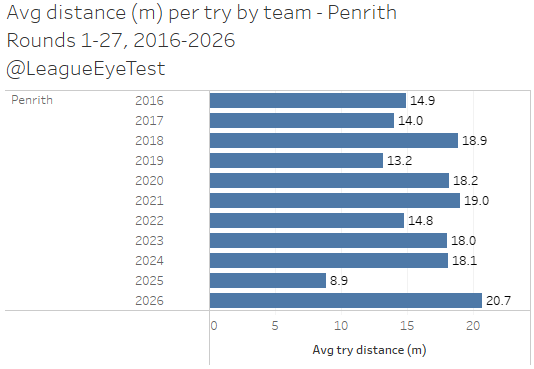
This season they’ve scored from an average of 20.7 metres away from the line, the highest since 2016 and more than double last years low of 8.9.
As for scoring quicker, Penrith have the lowest percentage of total play the balls coming from cumulative play the balls above eight in the NRL at just 4.98%, and their average consecutive play the balls this season is 3.44, which is the second lowest in the NRL. Last season those numbers were 8.51% and 3.75, and during their premiership seasons those numbers were in the high 6/low 7% range, and their average consecutive play the balls never dipped below 3.56.
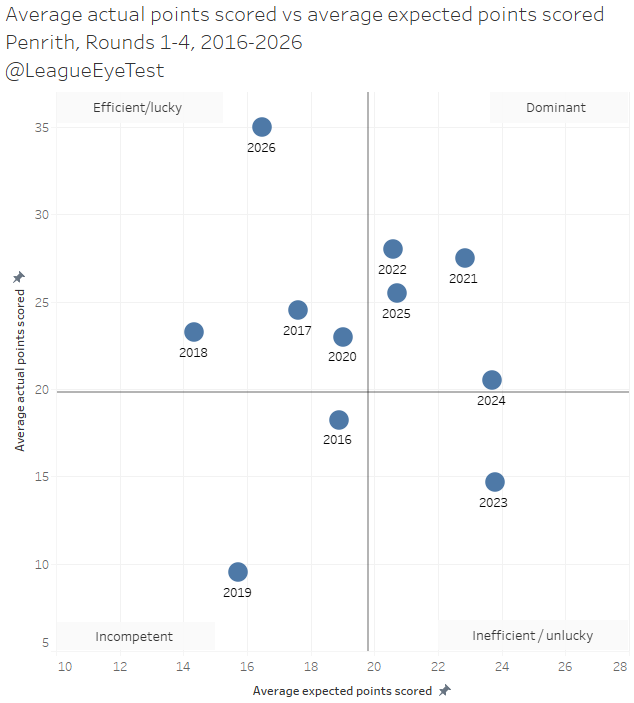
Here’s the same chart as above but broken down by Penrith seasons since 2016 showing they’re being more efficient with the ball.
Moving on from Penrith, the “Dominant” teams this season are the Storm, Warriors and Tigers, which lines up with what we saw from the expected point plot, with South Sydney also creeping in here. The Roosters are usually a perennial “Efficient/Lucky” team, but this season have had far more possession than usual and aren’t posting as many points. And as you’d expect given their lack of try scoring ability, the Bulldogs are firmly entrenched in inefficient territory.
Lastly, we have the “Incompetent” attacking quadrant, populated by Manly, Brisbane and the Gold Coast. Brisbane are here solely due to having the bad luck to have opened the season against Penrith, removing that game would see them push firmly into “Efficient/Lucky”.
Now we’ll look at the same chart again, but by average points conceded and expected points conceded per game.
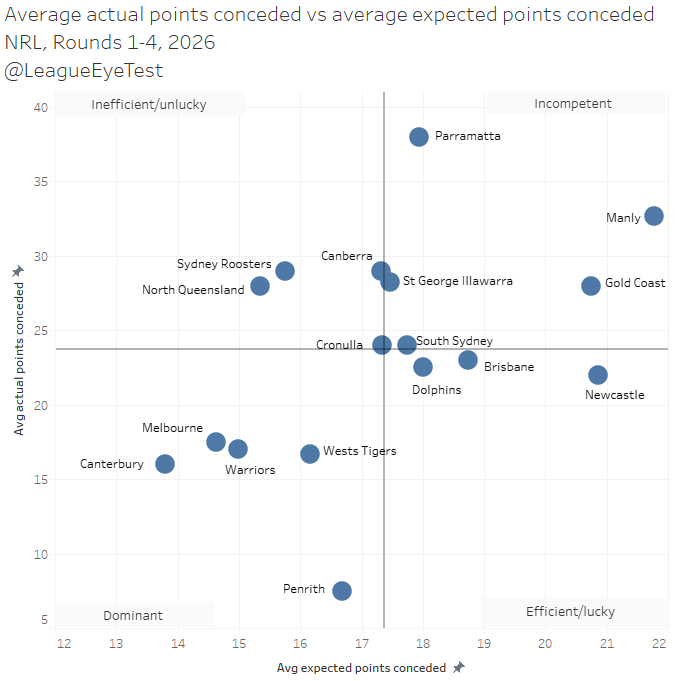
Again, you can see how Penrith are in a league of their own, with the Tigers, Storm, Bulldogs and Warriors also having a strong defensive start to the season. Cronulla are about league average here, as they were on the previous chart. They’re 2-2, with a +4 points difference, it’s hard to be more average than that.
With the volume of points scored this season, there’s few teams that are “Efficient/Lucky” when defending, but Newcastle is the closest and can probably thank the Bulldogs first 40 minutes when they offered little attacking threat for that.
And yet again we have the Eels, Sea Eagles and Titans camping in the “Incompetent” space defensively. We talked a bit about the first two already, and the Titans are also paying for giving up 50 in their season opener. Without it they would actually push slightly into “Efficient/Lucky” defensively, which indicates their defense has been improving under Josh Hannay leading up to their first win of the season.
The last part of the standard efficiency check is to look at each team’s point scoring compared to expected points as a percentage. These percentages lose some context from the prior charts where you could see the volume of possession a team had, but generally they provide a good quick glance at how a side is traveling.
First up we’ll check defensively how teams are tracking.
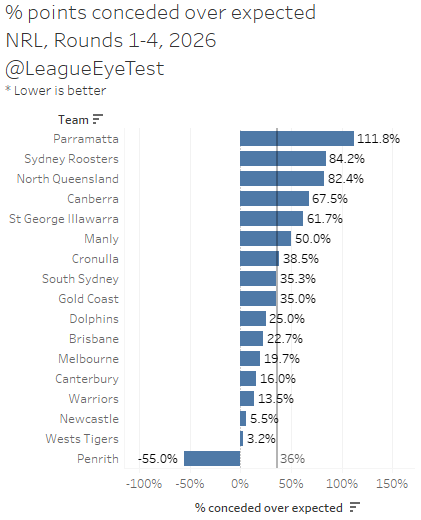
Nothing unusual here, just Penrith allowing -55% fewer points than expected, against a league that is +36% as a whole and there’s no other team in the negatives. Perfectly normal stuff. Newcastle and the Wests Tigers look to be the next best defensive teams, but based on history from both sides I’d want to see a much larger body of work from both before being comfortable with their performances.
The Eels are the most woeful defensive side in the competition at +112%, seemingly regressing from the improvements Jason Ryles made last season. Clearly it’s not positive, but the two losses to Penrith and Melbourne skew this, and if the Broncos were able to control the ball they’d probably be 1-3 instead of 2-2. With severe injuries to multiple fowards and Isaiah Iongi looking to be out for two months, it’s going to be a tough season.
The Roosters and Cowboys are also allowing 80% above what their field position would be valued at by expected points, with the Raiders and Dragons not much better in the 60% range.
To finish up we’ll look at point scored over expected, where there’s a lot of talking points.
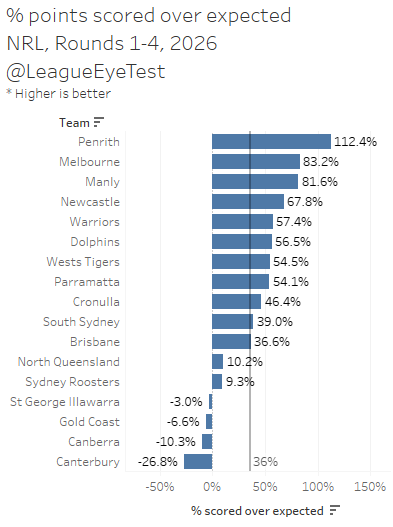
There shouldn’t be too many surprises here, with Penrith again setting the standard at +112% points over expected. Again very normal areas. Newcastle at +68% is probably the most shocking number here, with Justin Holbrook seemingly turning around a wretched attacking side into something resembling a modern NRL offense. Again it’s a small sample size but the signs are there.
Melbourne and Manly are also above 80%, which indicates for the Sea Eagles that when they did have the ball, they were scoring from positions that didn’t traditionally yield points. Their opening try against the Roosters, which was a tackle one play the ball 9 metres out and about 25 metres in from the left touch line in the first 30 seconds of the game would yield an expected point value of 0.008.
Friend of the site Mike Meehall Wood has often remarked to me about how Manly don’t know how to do anything but attack, and wrote about it in his newsletter last week. These number suggest it wasn’t an issue of converting possession into points that did them in, as they know how to attack with the ball. The issue was was having that possession in the first place.
The Sea Eagles net play the balls inside 20 are -72 this year, which is by far the worst in the NRL after a month. It’s also one of the worst marks since 2014, and the worst for Manly since 2017 when they were -71. And this is from just three games, all at home.
Manly have averaged just 135 play the balls per game in 2026, down from 158 over the same four rounds last season. Their opponents are controlling all of the ball, at 166 play the balls which is up from 150 per match in 2025 and the most by Sea Eagles opponents since 2014 when I started doing this.
A heat map of their play the balls shows exactly how and where they’ve been starved of the ball.
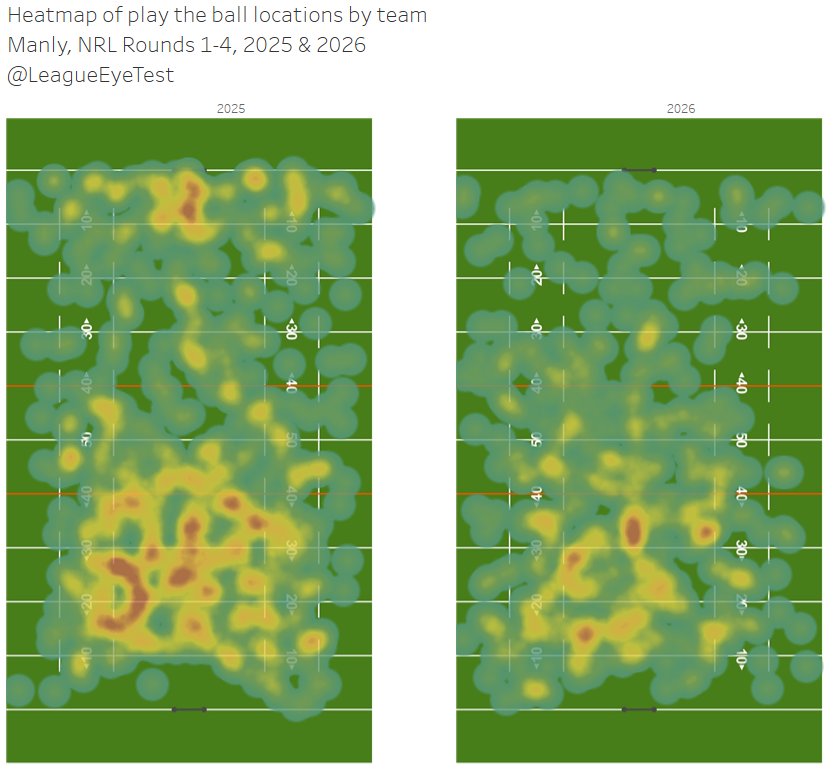
There’s still more intense red zones in their own half as they work the ball out in yardage sets, but the volume of ball in their opponents 30 metre zone is greatly reduced. Part of that is because the number of metres downfield on the first play the ball is the lowest in the league at just 28.7 meters.
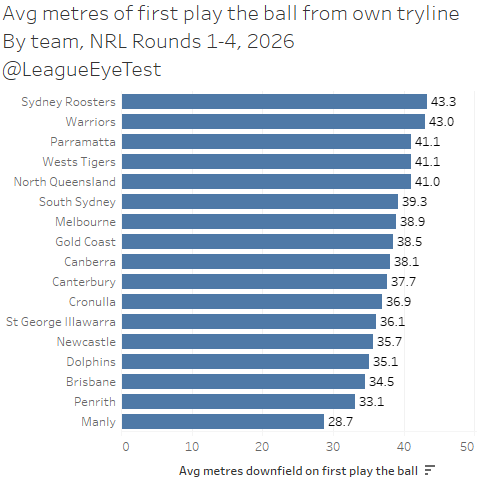
They’re a full four metres worse than Penrith, who are 16th, and nearly 15 metres worse off than the Sydney Roosters or Warriors. Manly lack presence through the middle and have limited impact off the bench, making it it hard to overcome these poor set starting points.
They also have the second lowest average of repeat sets in the NRL this season at just 12.3 per game, only ahead of Brisbane at 11.8. After four rounds last season Manly were first in the NRL at 19.3. You can’t survive being starved of repeat sets like this when the only thing you know is 100% attack.
Seibold getting shown the door this early is probably the right decision but is also unusual. Rugby league decision makers tend to wait until the absolute last minute to admit they were wrong, if in fact they ever do it in the first place. By making the decision now, at least they’ve started the process, but it will take a long time to unwind the damage done to the club over the past few seasons. If Kieran Foran can just get the club back to a normal level of possession then they’ll have a chance to compete.
Back to the rest of the league, and all but six teams are sitting at or above the +36% average across the 17 teams, with just four of them in the negatives, although even the Cowboys (+10.2%) and Roosters (+9%) are under performing here despite being in the positives.
The Dragons and Titans are low single digit negatives, which wouldn’t shock anyone who watched them play on the weekend. Canberra were probably lucky to be playing the worst team in the league at the start of the season as since then they’ve struggled to score as well. Both the Raiders and Sea Eagles are -11 in net errors this season, last in the NRL. Their inability to control the ball was noted in The Sportress’ game review. Maybe that’s why their Round 1 game was so close?
Speaking of their Round 1 game, Liam of the Maroon Observer went above and beyond looking at whether “14-0 dickhead” is actually a thing and a dangerous lead. It’s a fantastic read and will probably change how you think about margins.
And then we get to the Bulldogs, who are -27% below expected, and as noted above the average this season is +36%, meaning they’re substantially behind. Canterbury’s attack has been woeful. They have scored only seven tries this season – even Manly have 10 and the Dragons have 11.
What is more concerning is that the Bulldogs are the only team over the first month of the season not to have a try scored when they’ve accumulated at least 8 consecutive play the balls. Melbourne has 9 of their 24 total tries coming from the eight consecutive play the ball or greater, surpassing the Bulldogs seven in total.
It’s a small sample size but Canterbury went from averaging 26 points per game in March last season to just 15 this season and the consistent lack of points will eventually become a significant concern.
One of my favourite charts last season was showing how dire the Knights were in attack. Despite playing in one of the most attacking friendly eras of the NRL, they were averaging a similar level of points to the 2016 Nathan Brown era Knights. Here’s the chart in question for reference.
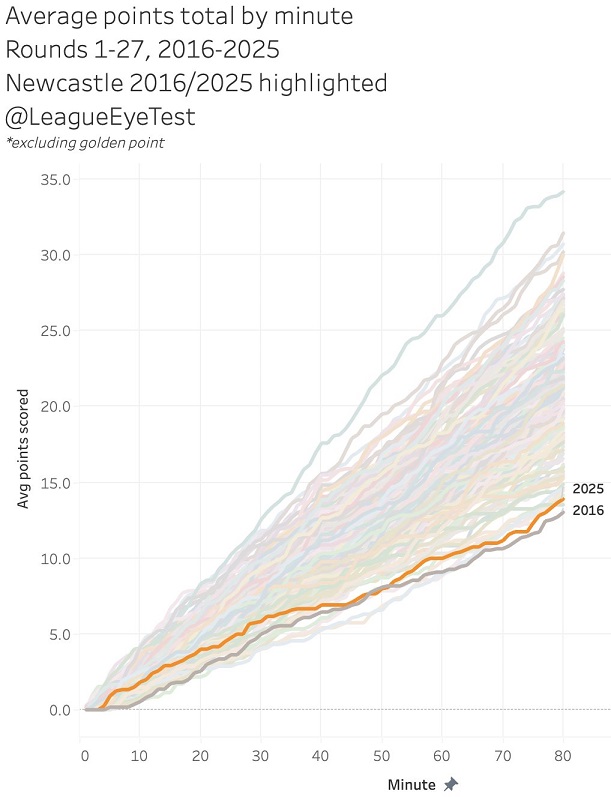
In 2025 the Bulldogs attack wasn’t elite, but when paired with their strong defense it made them a formidable opponent. Now they’ve added the head coach of the 2025 Knights to their coaching staff and it appears their attack has regressed.
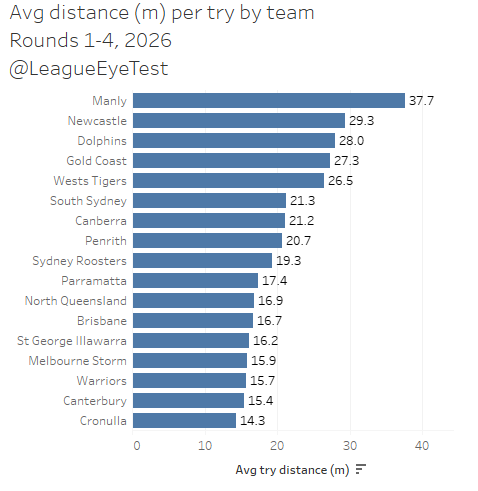
This year their average try distance from those seven crosses is just 15.4 metres, second lowest in the NRL
Not being able to cross the line from distance and also not scoring from repeat play the balls, which are generally closer to the line as you accumulate them, is a curious mix.
There’s no questioning their defense, it’s still one of the best in the competition and their attitude is second to none on that side of the ball. However, to beat Penrith you’ll need to actually cross the tryline, which I’m unsure they can do in sufficient numbers to cause a problem.
We’re past nine month of Lachlan Galvin arriving at Belmore and with a full pre-season under their schedule it’s hard to point to cohesion being an issue in attack. They were able to turn things around in the second half of the Knights game by switching Burton and Crichton, but that may not be a long term answer. I don’t know if I’d want to strengthen one position by weakening another, as Crichton is one of the best attacking centres in the game.
We’ll get a good idea of where Canterbury is at in Round 7 when they face Penrith, following the traditional Good Friday clash against an improved South Sydney.
—
The Rugby League Eye Test produces artisan small batch rugby league analysis that you can’t get anywhere else. In an era of low effort AI slop, the Eye Test offers hand crafted data and independent analysis that you can trust came from a human brain.
This sort of quality workmanship takes time and effort. Quality independent, ad-free rugby league content doesn’t exist without support from readers and the community. The Rugby League Eye Test operates under a value for value model.
If you’ve enjoyed this post, and are in a position to do so, then you can donate an amount of your choice through the PayPal link below, the Kofi page, or through the support page on the site’s menu. You can decide the level of contribution based on the value you believe the Eye Test provides to you.
Support The Rugby League Eye Test
For those of you in areas (such as New Zealand) where there’s issues with PayPal donations for some reason, I’ve set up a Kofi page as well for donations.
If you’re not in a position to donate financially, you can still support the site by sharing this post with others who might enjoy it. Support and promote independent rugby league content.