

New Zealand’s unemployment rate fell in the first quarter, but look under the hood and the jobs market remains flat, with slow turnover, longer unemployment spells, and weakness skewing young and north.
Chart 1: Unemployment falls, but…
Stats NZ reported a small drop in the unemployment rate yesterday, to 5.3 percent in the March quarter.
That we didn’t get the expected increase was welcome. But we’re obliged to flag a few caveats:
these numbers predate the fuel price shock
the details were far from strong (read on!)
we expect some further uplift in the unemployment rate this year
Rather than fixate entirely on the latest numbers, what follows is a rummage through the data highlighting (we think) some noteworthy trends in the labour market.
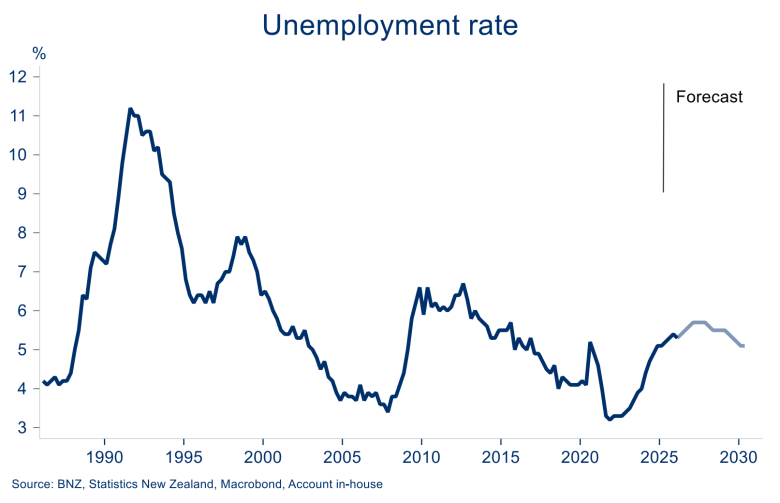
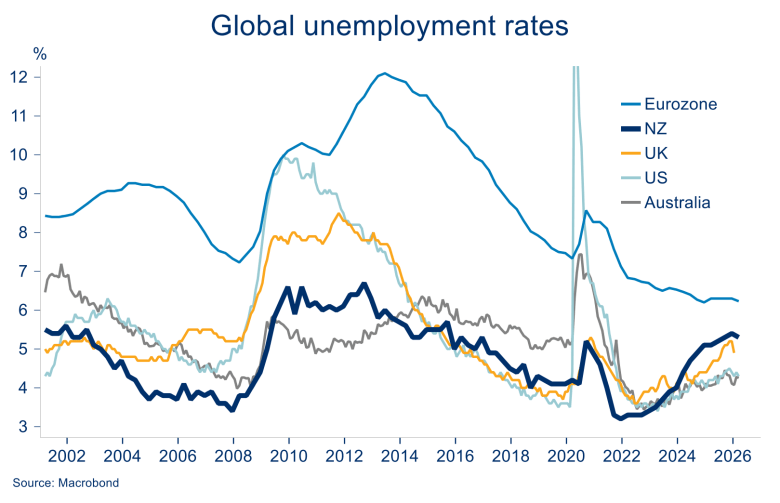
Chart 2: Global context
Zooming out a little shows the adjustment in NZ’s labour market has been more abrupt than many of our global peers.
From a lower starting point, the unemployment rate has reached higher levels than the US, UK, and Australia over the past four years. The normally large gap with Europe has narrowed.
Relatively sturdier offshore labour markets have been a key factor behind heightened migration departures out of NZ in the past few years. There are some signs this might be changing though (see chart 10 for example).

Start your day informed. Make room for newsroom’s top stories. Direct to your inbox daily.
Chart 3: Still hiring, but not enough
An expected drift up in unemployment this year need not entail a return to the aggregate job losses we saw over 2024 and early 2025.
Indeed, our forecasts have employment growth continuing. It’s just that we don’t think this growth will be firm enough to offset growth in the supply of labour. Especially now that migration is lifting population growth again.
To see the unemployment rate fall, the pace of hiring needs to be sufficient to soak up some of the capacity that exists. The delayed economic recovery means this now looks like a 2027 story. The moving parts are many and subject to change!
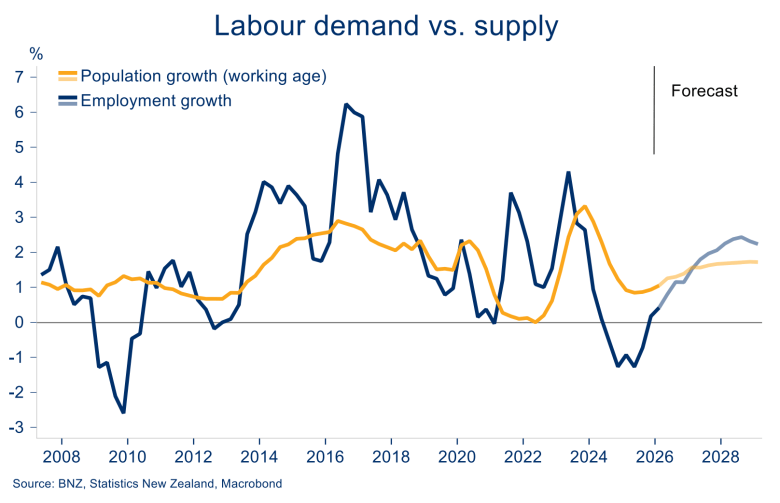
Chart 4: Turnover slow and low
The generally soggy hiring environment shows up in data tracking the flow of people in and out of the various labour market categories.
The proportion of those previously employed becoming unemployed remains very low. But the proportions moving into employment from being either unemployed or outside the labour force have been falling.
In short, it’s a low turnover environment – low job cuts, low job gains.
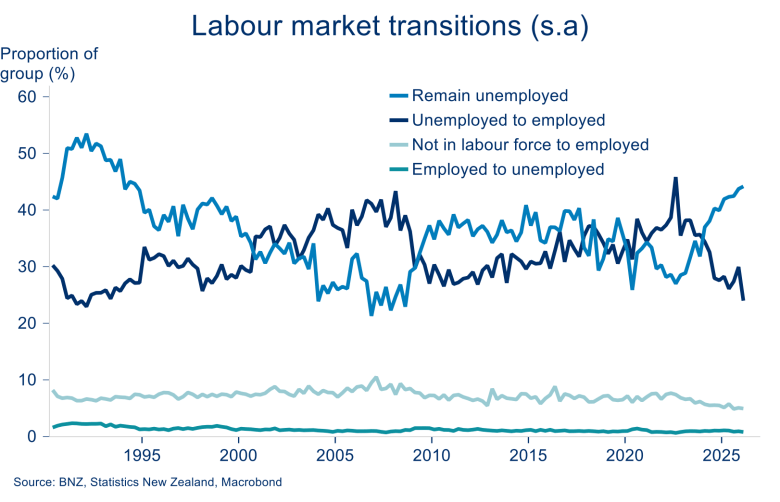
Chart 5: More hours, but more work wanted
Parsing a wider suite of labour market metrics highlights some of the other symptoms of a sluggish jobs market.
Average hours worked have lifted over the past few quarters, a sign activity was getting on the front foot before the Iran conflict.
But a rising share of people would still like more work – a rising underemployment rate – and the part-time share of employment has continued to nudge higher.
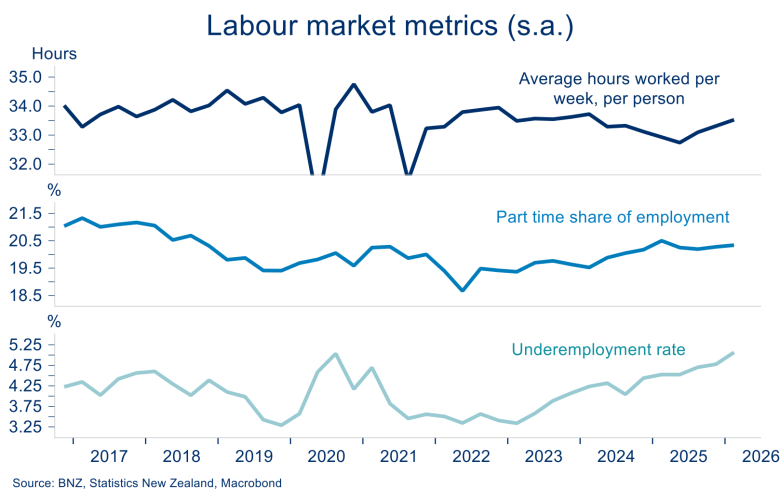
Chart 6: Longer periods out of work
The average duration of unemployment has lengthened over the past couple of years as labour market weakness has dragged on.
Numbers unemployed for six months or longer are now the largest share of total unemployment at 47 percent of the total.
It’s a broadly similar breakdown to the period of unemployment we saw back in the mid 1990s.
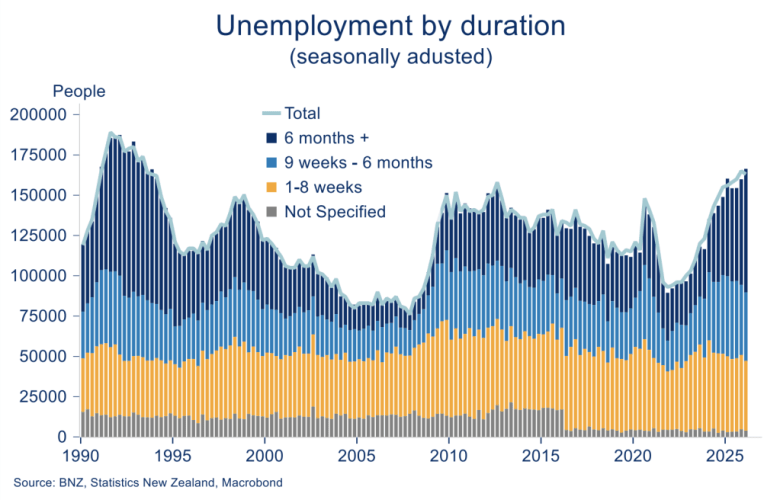
Chart 7: Breaking it down by age, region
The regional and age breakdown of the lift in unemployment skews young, and north.
The youth unemployment rate tends to be higher and more cyclical than other age cohorts. It hit a 13-year high in Q1. The highest unemployment rate among the other cohorts last quarter was the 4.4 percent (seasonally adjusted) recorded amongst 25-39-year-olds.
The North Island, and Auckland and Wellington in particular, continues to experience higher-than-average unemployment. Canterbury (4.2 percent) and Otago (3.2 percent) occupy the lower end of the regional range, although both experienced an uptick in Q1.
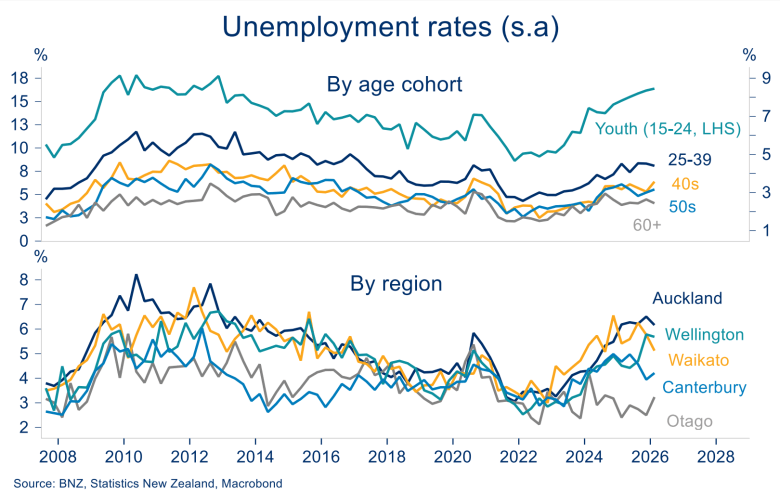
Chart 8: Sectoral differences
A look at jobs growth down sectoral lines shows a roughly even split of sectors adding or reducing jobs over the past 12 months to March.
The public admin, mining, transport/logistics, agriculture/forestry, and arts and recreation sectors all recorded filled jobs growth of 2 percent or more in the past year.
The media/telecommunications and rental/real estate categories experienced the largest percentage declines. But in raw number terms, the construction and manufacturing sectors have experienced the largest filled job declines of the past year, at 2900 and 3500 respectively.
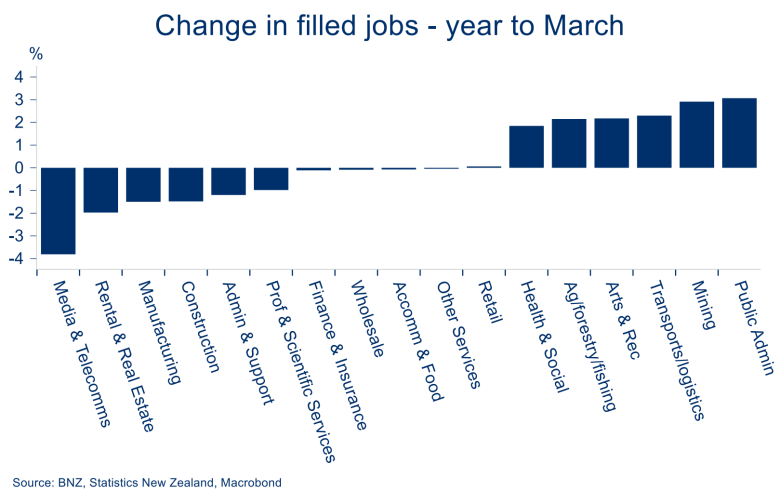
Chart 9: Cooling wage growth
The various wage growth measures for Q1 were either flat or slowed further. That’s unhelpful for purchasing power given our inflation forecasts have it hovering near 4 percent for most of the next year.
Stats NZ’s headline Labour Cost Index – a wage inflation proxy – recorded annual growth of 2.0 percent in the 12 months to March.
A look at the distribution of that figure showed the vast majority of workers (73 percent) receiving a sub-3 percent increase, and 44 percent receiving no change.
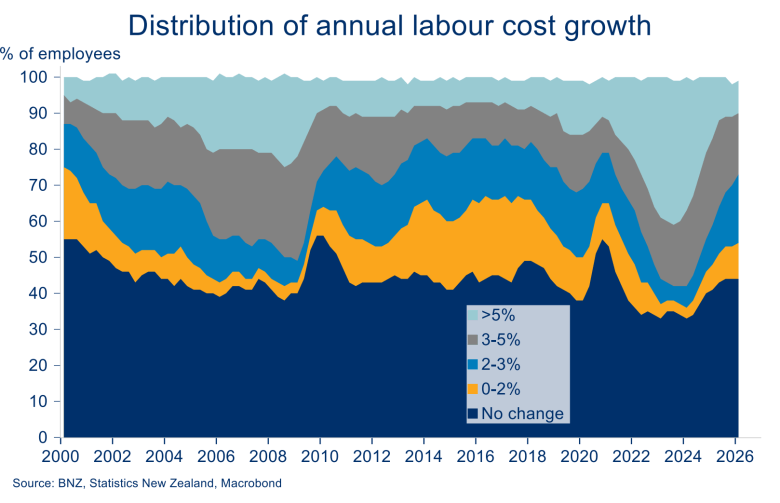
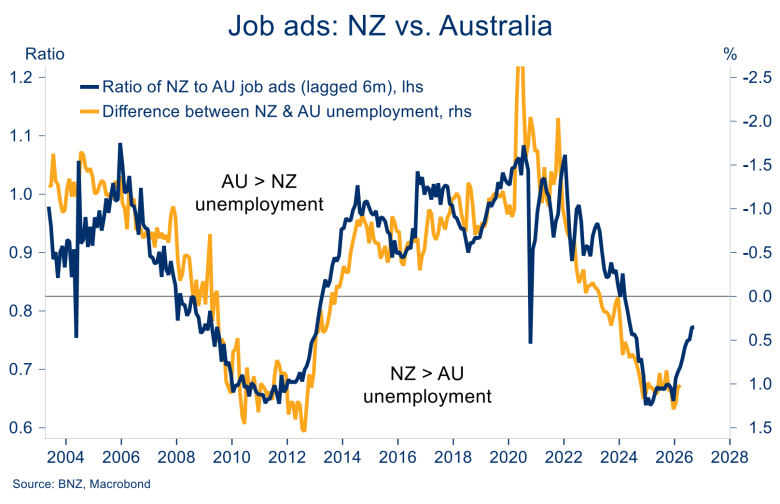
Chart 10: Oz’s relative appeal dimming?
Prior to March, the number of advertised job vacancies had increased for eight straight months – a positive sign for future jobs growth. However, the gains petered out in March via a 0.7 percent fall (seasonally adjusted).
It’s still the case though that the trend in job ads across the ditch remains a little flatter.
The ratio of NZ-to-Australian job ads has thus continued to nudge higher. It suggests that the antipodean labour market relativities that have heavily favoured Australia in recent years may soon tilt back towards NZ.
Disclaimer: This publication has been produced by Bank of New Zealand (BNZ). This publication accurately reflects the personal views of the author about the subject matters discussed, and is based upon sources reasonably believed to be reliable and accurate. The views of the author do not necessarily reflect the views of BNZ. No part of the compensation of the author was, is, or will be, directly or indirectly, related to any specific recommendations or views expressed. The information in this publication is solely for information purposes and is not intended to be financial advice. If you need help, please contact BNZ or your financial adviser. Any statements as to past performance do not represent future performance, and no statements as to future matters are guaranteed to be accurate or reliable. To the maximum extent permissible by law, neither BNZ nor any person involved in this publication accepts any liability for any loss or damage whatsoever which may directly or indirectly result from any, opinion, information, representation or omission, whether negligent or otherwise, contained in this publication.